Intro to Statistics crystal mark Intro to Statistics crystal mark Intro to Statistics
  • Home
  • Syllabus
  • Schedule
    • Notes
      • Overview
      • 1 — Data and evidence
      • 2 — Study design, bias, causality
      • 3 — One-variable summaries
      • 4 — Comparing groups
      • 5 — Association
      • 6 — Confounding & multivariable thinking
      • 7 — First-half synthesis
      • 8 — Simple regression
      • 9 — Multiple & logistic regression
      • 10 — Probability, risk, diagnosis
      • 11 — Simulation-based inference
      • 12 — Classical hypothesis testing
      • 13 — Categorical outcomes
      • 14 — Meta-analysis & forest plots
      • 15 — Final review
    • Resources
      • Overview

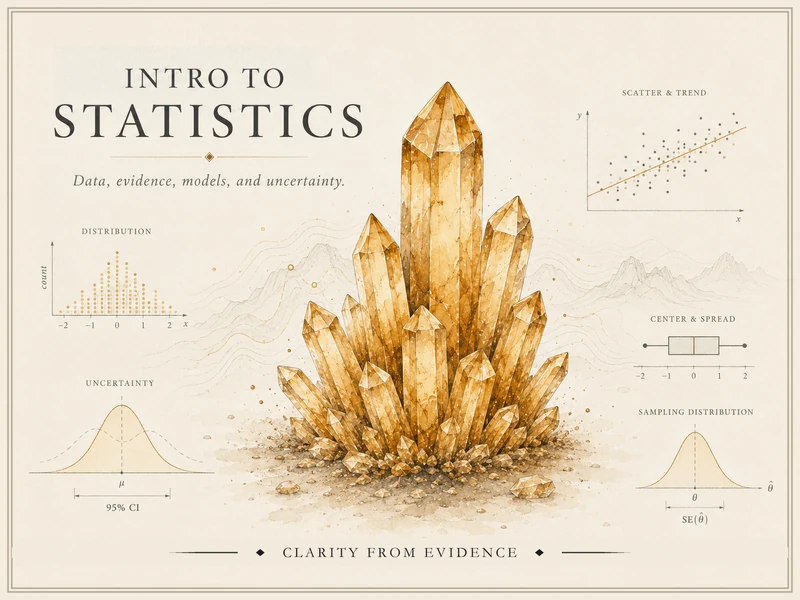
    Wide illustrated course identity image for Intro to Statistics, showing an amber crystal cluster surrounded by introductory statistics graphics including distributions, uncertainty, scatterplots, center and spread, and sampling distributions.

    Intro to Statistics

    This site collects public-facing notes for Intro to Statistics — the concepts and interpretation-focused examples behind reasoning with data, evidence, models, and uncertainty. Curated by Matt Hester.

    It is a reading and review layer, not a raw course archive. Anything section-specific lives in the learning management system; this site is what stays public.

    Where to start

    • Syllabus — what the course is about and how to use this site
    • Schedule — week-by-week topic map with links to the weekly notes
    • Notes — weekly notes and conceptual write-ups
    • Resources — readings, tools, and links (IMS, ISLBS, and StatKey / simulation support)

    © 2026 Matt Hester · Intro to Statistics

    Matt Hester · matthewhester.com

    Built with Quarto