Week 15 — Final review & synthesis
The whole modeling arc as one picture
The week question
This week asks one large question instead of one new one: how do asking, looking, fitting, checking, interpreting, comparing, and communicating fit together as a single practice? All semester you learned these moves one at a time. A statistical question came first, then a picture, then a fitted line, then diagnostics, then adjustment, then categories, interactions, prediction, binary outcomes, comparison, and finally reporting. Each was useful on its own. But none of them is the point. The point is the cycle they form — the loop you run whenever you turn a vague wish (“does studying help?”) into a defended claim (“each extra weekly study hour is associated with about a 1.8-point higher final, holding incoming GPA fixed; here is the uncertainty, here is what could still be wrong”). Week 15 is a single synthesis meeting on Monday, December 7 — the last class. We will not add machinery. We will pull the arc into one connected picture so that, going into the final-exam window (December 9–15, exact block to be announced through Blackboard), you can see the whole thing at once rather than fourteen disconnected topics.
Why this matters
Modeling is judged as a whole, not part by part. A flawless lm() call attached to the wrong question is worthless; a sharp question fit with no diagnostics is unconvincing; a well-checked model explained badly persuades no one. The value lives in the connections — choosing a model that matches the question, criticizing it honestly, interpreting it in the units a reader cares about, and saying plainly what the data can and cannot support. This matters now because the final asks you to reason across the arc, not to recite a single procedure. It matters later because real questions never arrive pre-sorted into “this is a logistic problem” or “this is an interaction problem.” You decide that. The skill the course is really building is the judgment to run the loop: to know which move comes next, and to know when to stop. Seeing the studyhabits thread as one continuous story — the same 200 synthetic students carried from a scatterplot all the way to a defended, compared model — is the most efficient way to lock that judgment in before the exam.
Learning goals
By the end of this week you should be able to:
- Recite the modeling cycle in order — question → look → fit → check → interpret → compare → communicate — and say what each stage protects against.
- Distinguish a model built for explanation from one built for prediction, and name how the goal changes what counts as a “good” model.
- Walk a single dataset through the entire arc, reusing the same fitted numbers, and say at each step what the number means and what could still be wrong.
- Choose between competing models on honest grounds — adjusted fit and parsimony for explanation, out-of-sample error for prediction — rather than chasing the highest in-sample \(R^2\).
- Plan, in a paragraph, how you would model a brand-new question you have never seen before.
Core vocabulary
- Modeling cycle — the repeating loop from question to communication; the unit of work in this course.
- Explanation — using a model to understand how and why variables relate (the meaning of a coefficient, after adjustment).
- Prediction — using a model to produce accurate values for new cases (judged out of sample).
- Adjustment / “holding constant” — isolating one predictor’s association by including others, the move that turned the crude
studyslope of \(2.5\) into the adjusted \(1.8\). - Parsimony — preferring the simplest model that explains the data well; the reason M2 beat the kitchen-sink model.
- Model criticism — the habit of asking what could be wrong: residual plots, extrapolation flags, crude vs. adjusted comparisons, in-sample vs. out-of-sample error.
- Out-of-sample error — prediction error on data the model did not train on (cross-validated RMSE), the honest judge of a predictive model.
Concept development
The modeling cycle revisited
Every week this semester was one stage of a single loop. Written out, it is:
\[ \text{question} \to \text{look} \to \text{fit} \to \text{check} \to \text{interpret} \to \text{compare} \to \text{communicate} \to \text{(repeat)}. \]
Read each arrow as a guard against a specific failure. Question (Weeks 1–2) guards against fitting something the data cannot answer — it fixes the response, the predictors, and whether you are explaining or predicting. Look (Week 2) guards against modeling a relationship you never inspected; the scatter of final against study told you a line was plausible before any lm() ran. Fit (Weeks 3–4) turns the picture into estimates: \(\hat y = 52.0 + 2.5\,x\). Check (Week 5) guards against trusting a fit whose assumptions fail — a residual plot, an extrapolation flag, an unusual point. Interpret (Week 4 onward) guards against numbers without meaning: a slope of \(2.5\) is a 2.5-point-per-study-hour association, not a fact about a single student. Compare (Weeks 6–13) guards against the first model you happened to fit — adjustment, categories, interactions, and selection all ask “is there a better account?” Communicate (Weeks 11, 14) guards against a correct model no one can use. The loop closes because communicating a result usually raises the next question. The arc is not a staircase you climb once; it is a wheel you turn.
The cycle is also a checklist for self-criticism. When a result feels off, walk backward through the arrows: Did I answer the question I asked? Did I look first? Is the fit checked? Is the interpretation in honest units? Have I compared it to a simpler rival? Can a reader follow it? Most modeling mistakes are a skipped arrow, not a botched computation.
Explanation vs. prediction — two goals, two ways to judge a model
The single most clarifying distinction in the course is why you are modeling. Two legitimate goals pull in different directions, and they are judged by different rulers.
Explanation asks what the relationship is: what does an extra study hour buy, once we account for the fact that stronger students also study more? Here the coefficient is the result, so it must be defended — adjusted, not crude. This is why the study slope falling from \(2.5\) to \(1.8\) once prior_gpa enters (Week 6) was the whole point, not an inconvenience: confounding means the crude number overstates the effect. An explanatory model is judged by whether its coefficients are credible and its comparisons honest — adjusted \(R^2\), AIC, and above all interpretability and parsimony. A model that explains well need not predict best; M2 (final ~ study + prior_gpa) was the explanatory sweet spot precisely because adding more predictors bought almost nothing.
Prediction asks for accurate values on new cases and does not care whether a coefficient is interpretable. Here the ruler is out-of-sample error. Week 10 made the lesson concrete: the 12-predictor kitchen-sink model reached training \(R^2 = 0.72\) and training RMSE \(\approx 6.9\), yet its cross-validated RMSE rose to \(\approx 11.0\) — worse than the simple two-predictor model’s CV-RMSE of \(\approx 9.3\). In-sample fit flattered the complex model; honest validation exposed it. The discipline:
\[ \text{explanation judged by } \{\text{credible adjusted coefficients, parsimony}\}, \qquad \text{prediction judged by } \{\text{out-of-sample error}\}. \]
When you sit down with a model, decide the goal first. It dictates which predictors belong, which comparison is fair, and which number you should believe.
The studyhabits thread as one connected picture
The same 200 synthetic students (data synthetic; seed set, set.seed(33003)) carried every idea, so the arc is one story rather than fourteen. The thread, in order:
- Simple line (Wk 3–4): \(\hat y = 52.0 + 2.5\,x\). Studying associates with higher finals; \(R^2 = 0.34\) says a third of the variation in
finaltracks withstudy. - Adjustment (Wk 6): add
prior_gpaand thestudyslope drops \(2.5 \to 1.8\). The crude line confused “studies more” with “was already stronger.” - Categories (Wk 8):
formatgroup means \(78 / 75 / 71\) for in-person / hybrid / online — a comparison, not a slope. - Interaction (Wk 9): the
studyslope is \(2.8\) for non-workers but \(1.6\) for workers — the effect is modified by working. - Binary outcome (Wk 11):
passed ~ studygives an odds ratio of \(\approx 1.42\) per study hour — same story, different response type. - Comparison (Wk 12): among M1, M2, and the kitchen sink, M2 wins on the parsimony–fit balance.
Notice the response and predictors change, but the moves repeat: look, fit, check, interpret, compare. That repetition is the synthesis. If you can narrate this thread out loud — what each number means and why the next move follows — you understand the course.
Worked examples
Worked example — studyhabits through the whole arc
Here is the entire studyhabits thread as one summarizing block. Data are synthetic; seed set; the code is shown, not executed, and the fitted numbers are the course’s locked values (#> comments). Read it as a narration of the cycle, not as code to run.
set.seed(33003)
# 200 synthetic students; response `final`, predictors as built across the term.

# 1) LOOK, then FIT — simple linear regression (Wk 3-4)
m_slr <- lm(final ~ study, data = studyhabits)
#> (Intercept)  52.0      study  2.5      R^2 = 0.34   s = 9.0
# Each extra weekly study hour ~ +2.5 points; the intercept (52.0 at study = 0) is extrapolation.

# 2) ADJUST — add prior_gpa (Wk 6)
m_adj <- lm(final ~ study + prior_gpa, data = studyhabits)
#> study  1.8      prior_gpa  8.0      R^2 = 0.51
# The study slope falls 2.5 -> 1.8 once prior_gpa is held constant: confounding revealed.

# 3) COMPARE GROUPS — categorical predictor (Wk 8)
m_cat <- lm(final ~ format, data = studyhabits)
#> in_person (baseline) 78.0    hybrid -3.0 (=75.0)    online -7.0 (=71.0)
# Coefficients are group differences vs. in-person, not slopes.

# 4) LET THE SLOPE DIFFER — interaction (Wk 9)
m_int <- lm(final ~ study * works, data = studyhabits)
#> study (works = FALSE) 2.8    study:worksTRUE -1.2  -> slope 1.6 for workers
# Studying buys less for students who also work many hours: effect modification.

# 5) BINARY OUTCOME — logistic regression (Wk 11)
m_log <- glm(passed ~ study, data = studyhabits, family = binomial)
#> logit(p_hat) = -2.0 + 0.35 * study     exp(0.35) ~ 1.42 (odds ratio per hour)
# Each extra study hour multiplies the odds of passing by ~1.42; p crosses 0.5 near study ~ 5.7.

# 6) COMPARE MODELS — selection (Wk 12)
#> M1 final~study           R^2 0.34  adj 0.337
#> M2 final~study+prior_gpa R^2 0.51  adj 0.505   <- M2 wins (large gain, AIC drops sharply)
#> M3 kitchen sink          R^2 0.55  adj 0.539   (tiny gain over M2; AIC barely better)
The picture below puts all six models side by side so you can see the same reasoning repeat across a line, a slope-drop, group bars, two fanning lines, an S-curve, and a bar chart of adjusted \(R^2\).
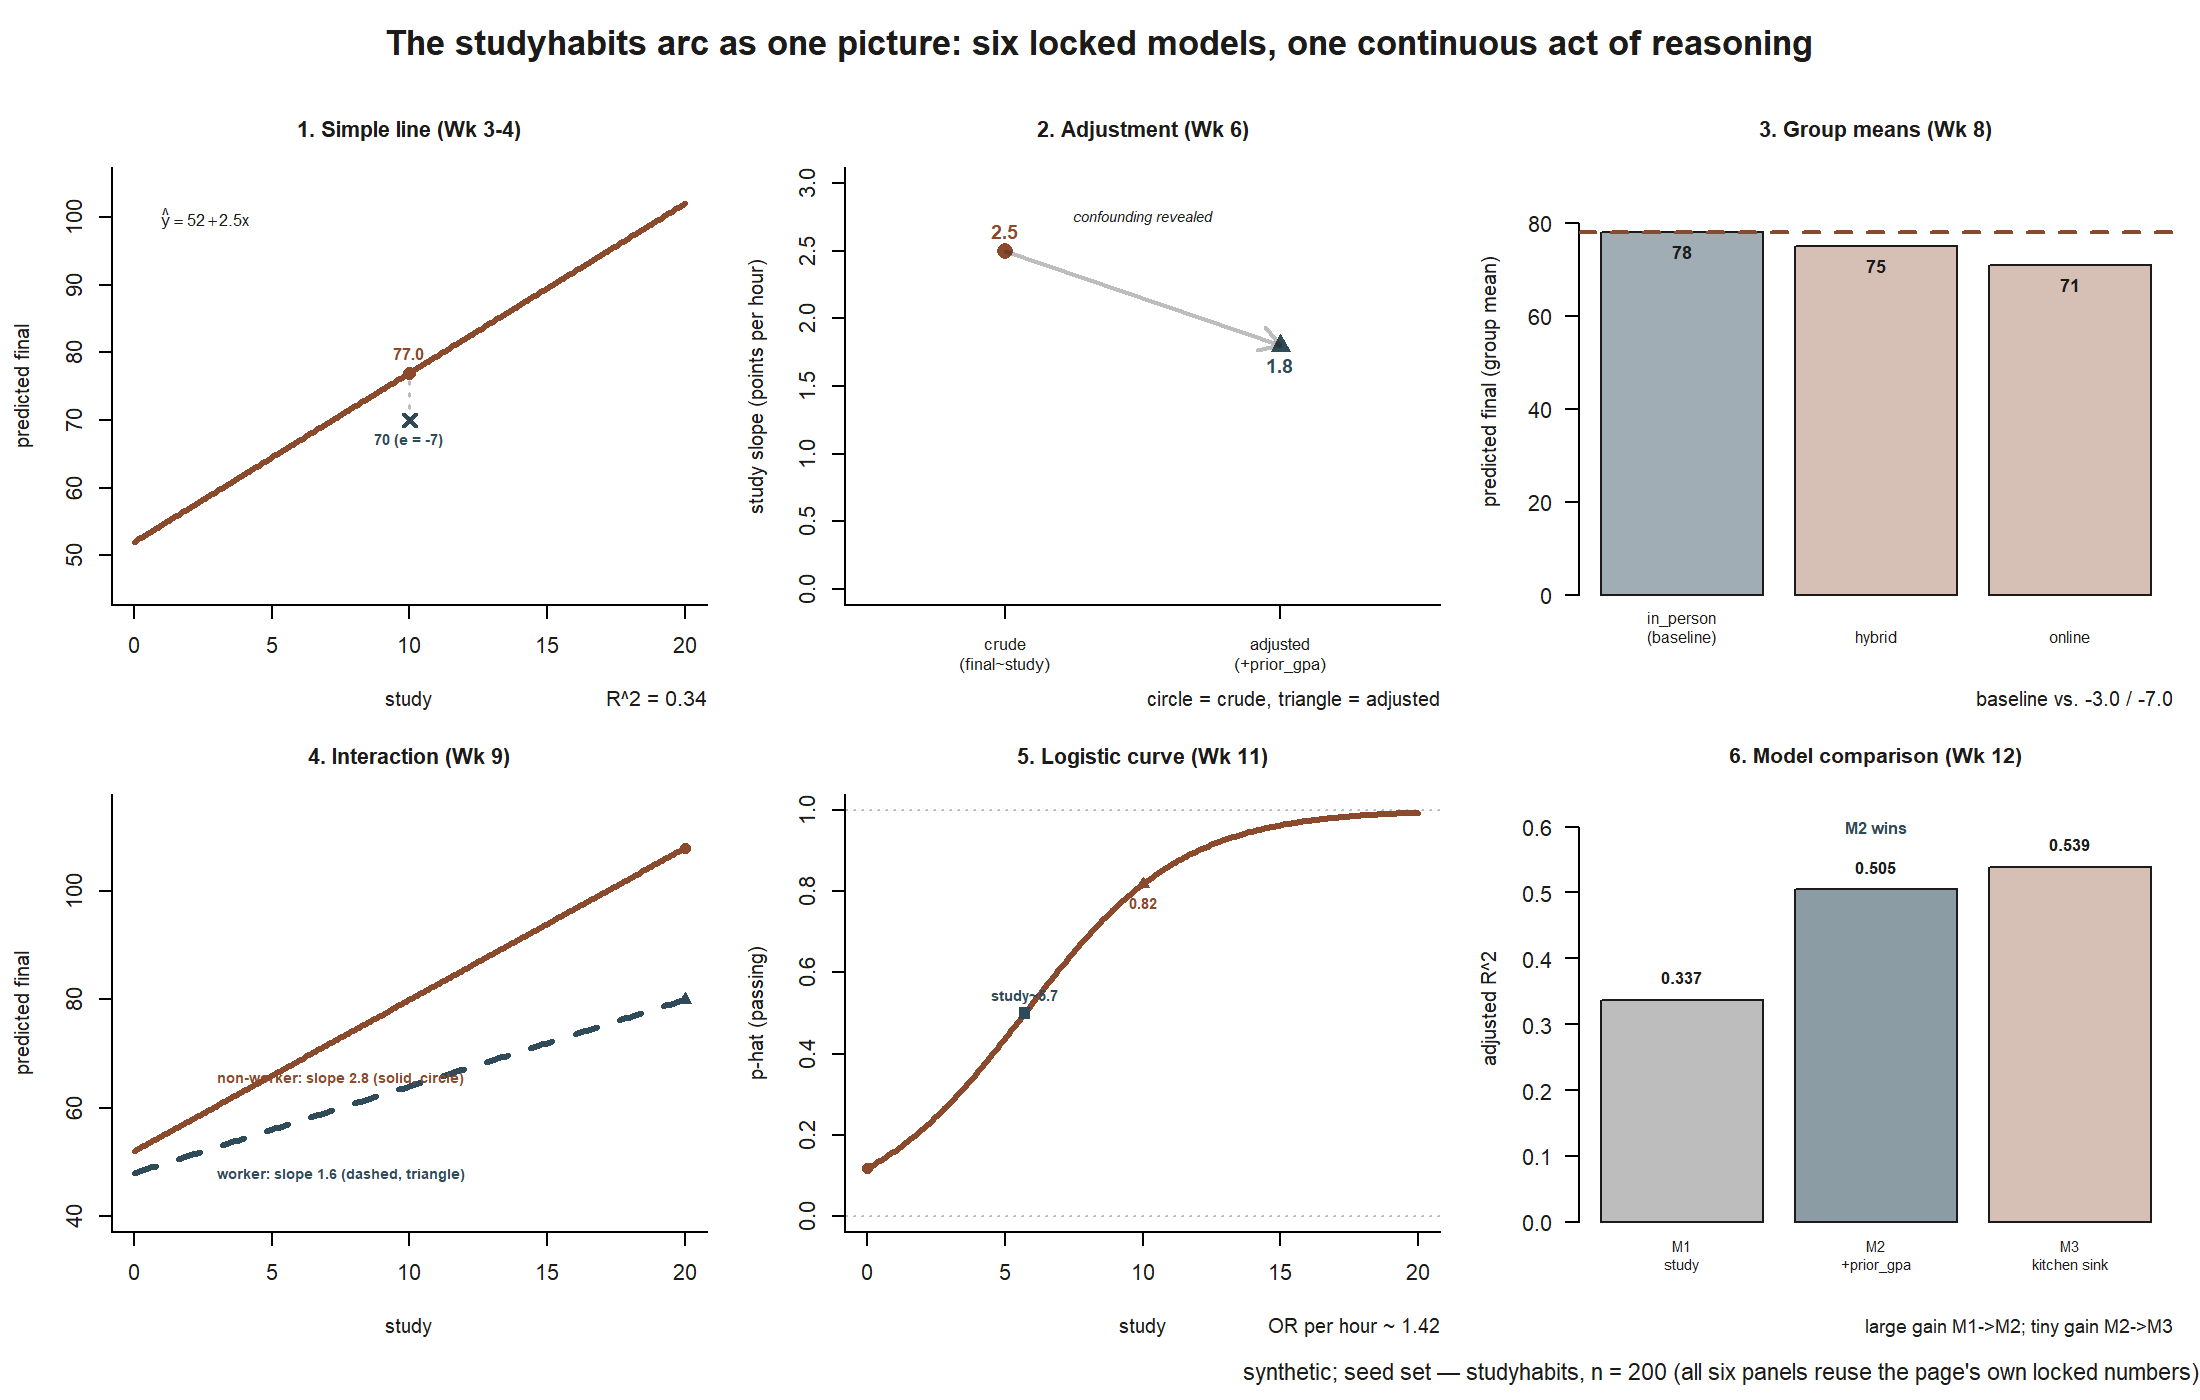
study slope dropping from \(2.5\) (crude) to \(1.8\) (adjusted for prior_gpa) — confounding revealed. Panel 3: the format group means \(78/75/71\) (in-person baseline, hybrid \(-3.0\), online \(-7.0\)). Panel 4: the interaction, non-worker slope \(2.8\) vs. worker slope \(1.6\), fanning apart as study hours increase. Panel 5: the logistic S-curve \(\operatorname{logit}(\hat p) =
-2.0+0.35x\), crossing \(\hat p = 0.5\) near \(x \approx 5.7\) and reaching \(\hat p \approx 0.82\) at \(x=10\). Panel 6: the adjusted-\(R^2\) comparison, M1 \(0.337\), M2 \(0.505\), M3 \(0.539\) — M2’s large jump over M1 and M3’s negligible gain over M2 is the parsimony argument in one bar chart (synthetic; seed set; studyhabits).
Now read the thread as one argument. The simple line (\(\hat y = 52.0 + 2.5\,x\)) gave a first, crude answer: studying is associated with higher finals, and at \(x = 10\) the model predicts \(\hat y = 77.0\), so a student who studied 10 hours and scored 70 sits \(e = 70 - 77 = -7\) points below the line. That residual is a criticism prompt, not a verdict. Adjustment then corrected the crude story: holding prior_gpa constant shrinks the slope to \(1.8\), because stronger students both study more and score higher — the honest explanatory number is \(1.8\), not \(2.5\). Categories showed the same response answering a comparison question (\(78 / 75 / 71\) across formats). The interaction showed the slope itself can depend on context (\(2.8\) vs. \(1.6\)). Logistic regression carried the identical “does studying help?” question to a yes/no response, where the natural summary is an odds ratio of \(\approx 1.42\) per hour. Finally, comparison weighed the candidates and chose M2: it captured the large jump in adjusted \(R^2\) (\(0.337 \to 0.505\)) while the kitchen sink’s extra predictors lifted adjusted \(R^2\) only to \(0.539\) — noise dressed as explanation. One dataset, six models, one continuous act of reasoning.
Worked example — a transfer plan: how would you model X?
New context (synthetic): a city bike-share program wants to understand daily ridership. For each of a year’s days you have rides (count of trips that day), temp (°C), precip (mm of rain), weekday (Mon–Sun), and holiday (TRUE/FALSE). A manager asks two different questions, and the modeling plan differs by goal — exactly the explanation-vs-prediction split.
Run the cycle. Question: separate the two asks. “Does rain depress ridership, and by how much, after accounting for temperature and day of week?” is explanation. “Can we forecast tomorrow’s ridership for staffing?” is prediction. Look: plot rides against temp and against precip, faceted by weekday, before fitting anything — you might see ridership rise with temperature then flatten, and drop sharply on rainy days. Fit: for the explanatory ask, a model with temp, precip, weekday, and holiday; because weekday is categorical it enters as group differences against a baseline day (as format did), and you would watch for an interaction if rain matters more on weekends than weekdays (effect modification, as with study * works). For prediction, you would consider the same predictors but judge them differently. Check: residual plots against temp and against time, an extrapolation flag if you forecast a hotter day than any in the data, and a look for unusual days (a festival, a transit strike). Interpret: the precip coefficient is “rides lost per millimeter of rain, holding temperature and weekday fixed” — adjusted, in the manager’s units. Compare: for explanation, weigh a lean model against a fuller one on adjusted \(R^2\) and parsimony; for the forecast, judge candidates on cross-validated error, not training fit, remembering the kitchen-sink lesson. Communicate: one short reproducible report with the picture, the chosen model, the adjusted effect, the uncertainty, and an honest note on what is still unmodeled (special events). You have never seen this dataset, yet the loop tells you exactly what to do next at every step — that portable loop is the synthesis.
A common mistake
The defining mistake of a final-review week is studying procedures in isolation instead of the modeling cycle. It looks like making a flashcard for “interaction,” another for “logistic regression,” another for “\(R^2\),” and memorizing each in a vacuum — the syntax of lm(y ~ x*z), the formula for an odds ratio, the definition of adjusted \(R^2\) — as if the exam rewards recall of disconnected facts. It does not, and neither does any real modeling problem. The trap is that isolated procedures give you no way to decide which one a new question needs, when to stop adding predictors, or whether the number you computed should be believed. A student who has memorized that study:worksTRUE = -1.2 but cannot say it means “studying buys less for working students” has learned a token, not a model. The fix is to study the arrows, not just the boxes: for each topic, be able to say which question it answers, what it guards against, what its key number means in a sentence, and which simpler rival you would compare it to. Rehearse by walking the studyhabits thread end to end out loud. If you can narrate the cycle, the individual procedures fall into place as moves within it — and that is exactly the reasoning the final is built to reward.
Low-stakes self-checks (ungraded)
These are ungraded self-checks — no points, no submission, no answer key. Use them to find the soft spots in your synthesis before the exam window.
- Recite the modeling cycle in order from memory, and for each arrow name one failure it guards against.
- For the
studyslope, explain in one sentence why the explanatory answer is \(1.8\) rather than \(2.5\). - The kitchen-sink model had a higher training \(R^2\) (\(0.72\)) than M2 (\(0.51\)) yet was the worse model. By which ruler, and what number, does the kitchen sink lose?
- Translate the logistic result into plain language: what does an odds ratio of \(\approx 1.42\) per study hour mean to a student deciding how to spend an evening?
- In the bike-share transfer example, state which question is explanation and which is prediction, and name the different ruler you would use to judge each model.
- Pick any week’s model and walk it backward through the cycle’s arrows, asking the self-criticism question at each step.
Reading and source pointer
This is a whole-book synthesis week. For the full arc, revisit ModernDive (Ismay, Kim & Valdivia) end to end — the regression and inference chapters you have already used — and read ModernDive Chapter 11, “Tell Your Story with Data,” which closes the loop by turning a fitted model into a clear, honest, reproducible account. Chapter 11 pairs naturally with the Week 14 reporting note: the cycle does not end at a coefficient, it ends at a story a reader can trust. These notes are the course’s own synthesis, grounded in but not copied from the sources.
Public vs. graded
These notes, the examples, and the practice here are public and ungraded — study material only. There is no graded content on this page: no graded prompts, answer keys, rubrics, point values, or due dates appear on this site. Graded modeling checkpoints, labs, quizzes, homework/modeling memos, the midterm, the project, and the final live in Blackboard (the LMS), which is authoritative for due dates, submissions, and grades — including the final-exam block in the December 9–15 window. If this page and Blackboard ever disagree, follow Blackboard.
Looking ahead
Next week there is no new note — the final-exam window opens (December 9–15, exact block announced through Blackboard), and your job is to carry the cycle, not a pile of procedures, into it: ask, look, fit, check, interpret, compare, communicate.
See also
- Week 1 — Models, data & statistical questions — where the cycle begins.
- Week 6 — Multiple regression & adjustment — the \(2.5 \to 1.8\) adjustment at the heart of explanation.
- Week 10 — Prediction & validation — the out-of-sample ruler.
- Week 12 — Model comparison & selection — why M2 wins.
- Week 14 — Reproducible modeling reports — communicating the result.
- Notation glossary and modeling reference.