Week 1 — Models, data & statistical questions
What a model is for, and the anatomy of a statistical question
The week question
When someone writes final ~ study — read aloud as “final exam score modeled by weekly study hours” — what are they actually trying to answer? That little tilde looks like a formula waiting to be solved, but it is really a question in disguise. This week we slow down before any line is drawn and ask: what is a model of final ~ study for, and what has to be true of a question before a model can sensibly answer it? The whole course hangs on getting this framing right, because a model fit to a badly posed question gives a confident, well-formatted, and completely useless answer.
So the week question is deliberately not “what is the slope?” That comes later. The week question is: what is the model final ~ study trying to find out, and how do we state that target precisely enough that a model can be held accountable to it?
Why this matters
It is tempting to treat statistical modeling as a button you press — feed in a spreadsheet, run lm(), read off a number. But a number with no question attached cannot be right or wrong; it can only be a number. The discipline of this course is the reverse of button-pressing: you name the question, the unit you are studying, the response you care about, the explanatory variable you suspect matters, and the comparison you want to make — and only then do you reach for a model. Every later week (slopes, diagnostics, adjustment, prediction, logistic regression) is machinery built on top of this framing, and the machinery is only as trustworthy as the question underneath it.
This matters beyond the classroom. A hospital asking whether a treatment helps, a school asking whether a tutoring program raises scores, a company asking whether a price change moves sales — each of these is a response ~ explanatory question with a unit and a comparison, and each goes badly wrong when the question is left vague. People who can state the question cleanly are the ones whose models get believed. A model, in this course, is never just a curve through points; it is a structured argument about how two or more variables relate, what is being compared, and what the data can and cannot support. Learning to read and write that argument is the real skill, and it starts here.
Learning goals
By the end of this week you should be able to:
- Explain what a statistical model is for — that it encodes a structured argument about how variables relate, not merely a line or a formula.
- Name the five parts of a statistical question: the unit of observation, the response, the explanatory variable(s), and the comparison being made.
- Read a model formula such as
final ~ studyand say, in plain words, the question it poses. - Distinguish, at a preview level, an explanation question from a prediction question, and place a given question in the modeling workflow (ask → look → fit → check → interpret → communicate).
- Identify the recurring
studyhabitsdataset’s structure and state the unit, response, and predictor for the question “how is final exam score related to weekly study hours?” - Catch the most common framing mistake — reaching for a model before naming the question, or swapping the response and the explanatory variable.
Core vocabulary
- Model. A structured, simplifying argument about how variables relate. It makes a claim (“more study hours go with higher scores, on average”) that the data can support, qualify, or undermine. A formula like
final ~ studyis the shorthand for such an argument, not the argument itself. - Unit of observation. The thing each row of the data describes — here, one student. Everything you measure is measured per unit, and the question is always a question about units of this kind.
- Response variable (\(y\)). The outcome you are trying to understand or predict — here,
final, the final exam score. It sits on the left of the tilde. - Explanatory variable (\(x\)), also called a predictor. The variable you think helps account for the response — here,
study, weekly study hours. It sits on the right of the tilde. - Comparison. The contrast that gives the question its meaning: students who study more versus less. No comparison, no statistical question — only a description.
- Explanation vs. prediction. Two different jobs a model can do: account for why the response varies (explanation) or forecast the response for a new unit (prediction). The same data can serve either, but the question must declare which.
- Synthetic data. Data generated on purpose for teaching — here, synthetic; seed set (
set.seed(33003)). It stands in for a real campus learning-analytics study but is not real student data.
Concept development
1. A model is a structured argument, not a line
The most common misconception coming into a modeling course is that a model is the line — that final ~ study “means” some equation \(\hat{y} = b_0 + b_1 x\) and the modeling is the act of computing \(b_0\) and \(b_1\). That is backwards. The line is the conclusion of an argument; the argument is the thing you should care about. When you write final ~ study, you are asserting a chain of claims: that final exam score is a quantity worth explaining; that weekly study hours are a plausible source of its variation; that the relationship is stable enough across students to be worth summarizing; and that whatever pattern exists can be expressed, at least approximately, as “more of \(x\) goes with more (or less) of \(y\).” Each link in that chain can be true or false, and the data are how you interrogate them.
Think of it the way a lawyer thinks of a case. The verdict (the fitted line) is short and quotable, but it is only as good as the argument that produced it — the premises, the evidence, the things ruled in and ruled out. A model you cannot narrate as an argument is a model you cannot defend, and a model you cannot defend is one you should not believe. Throughout this course, when we “criticize a model,” we are stress-testing its argument: is the comparison fair? is the summary honest about uncertainty? does the line hold where we are reading it, or are we extrapolating past the evidence? Those questions have answers only because there is an argument to question. This is why we refuse, this week, to fit anything: we want the argument fully in view before any line tempts you into thinking the work is done.
2. The anatomy of a statistical question
Every statistical question this course will touch has the same skeleton. Name the parts and the question becomes answerable; skip them and you get a number with no meaning. The parts are:
- Unit of observation — who or what is each row? For
studyhabits, the unit is one student in one intro course. If you cannot say what one row is, you are not ready to model. - Response (\(y\)) — what outcome do you want to understand? Here,
final, the final exam score. - Explanatory variable(s) (\(x\)) — what do you think accounts for the response? Here,
study. - The comparison — what contrast gives the question teeth? Here: students who study more hours versus students who study fewer hours. The comparison is the heart of the question. “What is the average final score?” is a description of one group; “how does final score differ between more- and less-studying students?” is a statistical question, because it sets two (or many) situations against each other.
Read final ~ study through this skeleton and it stops being a formula and becomes a sentence: “Across students (the unit), how does final exam score (the response) relate to weekly study hours (the explanatory variable), comparing students who study more with those who study less (the comparison)?” That sentence is the model. The arithmetic that comes later only sharpens it.
A subtle but crucial point lives in the order of the tilde. final ~ study and study ~ final are not the same question. The first asks how score responds to study time; the second asks how study time relates to score, treating study as the outcome. They share a correlation but answer different questions, and choosing the wrong one is one of the most common framing errors (see “A common mistake”). The response is the thing you are trying to account for; the explanatory variable is the thing you are accounting with. Decide which is which from the question, never from the spreadsheet’s column order.
3. Explanation vs. prediction, and the modeling workflow
There are two broad jobs a model can do, and naming the job early keeps you honest. An explanation question asks why the response varies and whether a particular variable is part of the story — for example, “is studying associated with higher scores once we account for incoming preparation?” A prediction question asks, for a new student we have not seen, “what final score should we expect given their study hours?” The two jobs reward different choices: explanation prizes interpretable comparisons and guards against confounding; prediction prizes out-of-sample accuracy and guards against overfitting. The same dataset can serve either, but a model that is excellent for one can be mediocre for the other, so the question must declare its job up front. This week is a preview — weeks 6 to 9 develop explanation, and weeks 10 to 12 develop prediction — but you should already start asking, of any question, “is this an explaining question or a forecasting question?”
Underneath both jobs runs a single repeatable workflow, and you will see it in every week of the course:
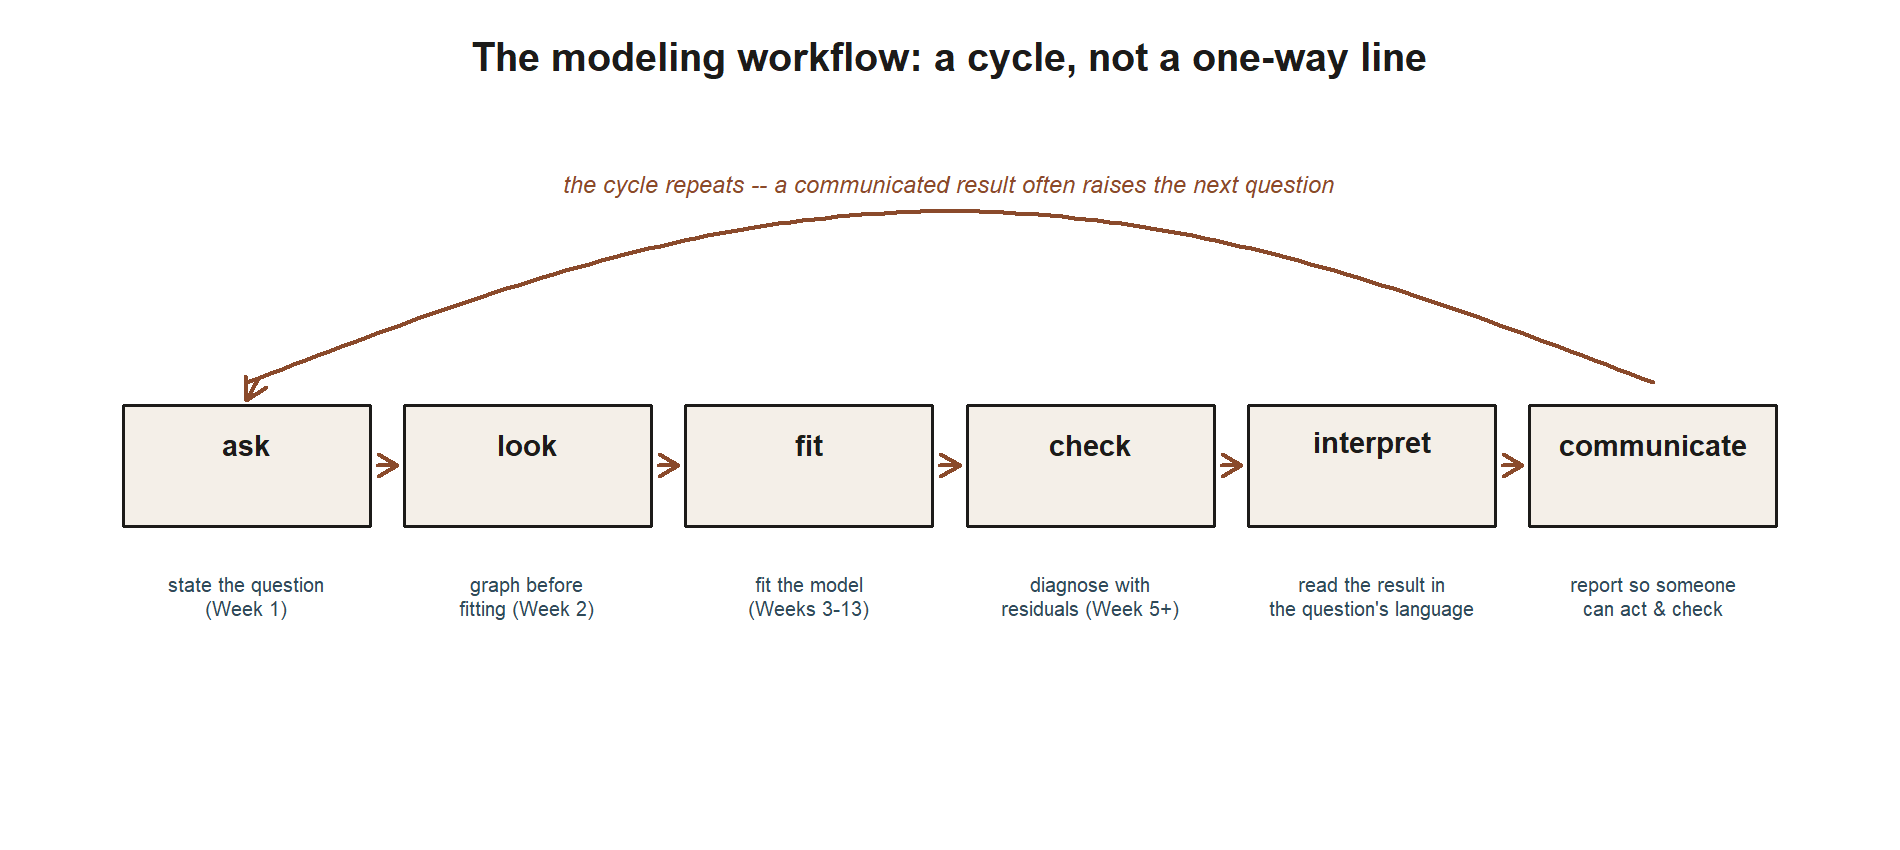
\[ \text{ask} \to \text{look} \to \text{fit} \to \text{check} \to \text{interpret} \to \text{communicate}. \]
You ask a precise question (this week). You look at the data with graphs before fitting anything (next week). You fit a model. You check it with diagnostics, because a fitted line can be wrong in ways the number does not advertise. You interpret the result in the language of the question. And you communicate it so someone else can act on it and check your work. Skipping “ask” — the most skipped step — is what produces confident answers to questions nobody actually posed. We spend Week 1 entirely inside the first arrow.
The picture below makes the point the arrows-in-a-line notation above can only hint at: this workflow is a loop, not a finish line. A communicated result routinely raises the next question, which starts the whole chain over again.
Worked examples
Worked example — the studyhabits study: stating the question
Meet the dataset that will accompany us all semester. studyhabits is synthetic; seed set (set.seed(33003)); it stands in for a campus learning-analytics study of \(n = 200\) students in a single intro course, and it is not real student data. Each row is one student. Here is the structure, shown as a glimpse()-style listing — note that we are only looking at the variables, not fitting anything yet:
set.seed(33003)
# studyhabits: synthetic teaching data, n = 200 students in one intro course
glimpse(studyhabits)
#> Rows: 200
#> Columns: 7
#> $ final     <dbl> 77, 64, 81, 70, ...   # final exam score, 0-100  (the response, y)
#> $ study     <dbl> 10,  6, 12,  8, ...   # avg weekly study hours, ~0-20  (predictor, x)
#> $ prior_gpa <dbl> 3.1, 2.4, 3.6, ...    # incoming GPA, 0-4
#> $ attend    <dbl> 0.95, 0.70, 1.00, ... # proportion of classes attended, 0-1
#> $ format    <fct> in_person, online, hybrid, ...   # section format
#> $ works     <lgl> FALSE, TRUE, FALSE, ...          # works a job >= 15 hr/week
#> $ passed    <lgl> TRUE, FALSE, TRUE, ...           # passed the course (final >= 70)
Now state the question this week is about: “How is final exam score related to weekly study hours?” Run it through the anatomy from Concept §2 and the framing falls out cleanly:
- Unit of observation: one student. Each row is a single student in the course, so every variable is a per-student measurement.
- Response (\(y\)):
final, the final exam score on a 0–100 scale. This is the outcome we want to understand. - Explanatory variable (\(x\)):
study, average weekly study hours. This is what we suspect helps account for differences infinal. - The comparison: students who study more hours versus students who study fewer hours — does the typical final score differ between them, and how?
So the model in question is final ~ study, which we read as: across students, how does final exam score relate to weekly study hours, comparing heavier with lighter studiers? Notice what we deliberately have not done: we have not drawn a line, computed a slope, or quoted an \(R^2\). That is correct for Week 1. The fitting comes in Week 3, where this exact question becomes \(\hat{y} = 52.0 + 2.5\,x\) — but that equation is meaningful only because the question behind it is already pinned down here. A slope of \(2.5\) “points per study hour” is an answer; without the question, it is trivia. The interpretation that matters this week is the framing one: we have turned a vague hunch (“studying probably helps”) into a precise, checkable modeling question with a named unit, response, predictor, and comparison — which is exactly what makes any later number defensible.
One more reading habit to build now: when you see the eventual fitted form \(\hat{y} = 52.0 + 2.5\,x\), read the hat on \(\hat{y}\) as “the model’s predicted value, not a guarantee.” The model is an argument about averages and tendencies, not a promise about any one student. Keeping that humility in the notation is part of keeping the model honest.
Worked example — apartment rent and square footage (transfer)
Now watch the same anatomy move to a completely different context, so you can see that the framing is general and not a quirk of the studyhabits data. Suppose a renter is studying apartment listings in a city and asks: “How is monthly rent related to an apartment’s size?” The data (also imagine it as synthetic; seed set) might be one row per listing, with rent in dollars, sqft in square feet, plus bedrooms, neighborhood, and floor. The model in question is rent ~ sqft:
set.seed(33003)
# apartments: synthetic listings, one row per apartment
glimpse(apartments)
#> Rows: 150
#> Columns: 5
#> $ rent         <dbl> 1450, 1875, 1100, ...  # monthly rent in dollars  (the response, y)
#> $ sqft         <dbl> 720, 980, 540, ...      # apartment size, sq ft   (predictor, x)
#> $ bedrooms     <int> 1, 2, 1, ...
#> $ neighborhood <fct> downtown, midtown, ...
#> $ floor        <int> 3, 5, 1, ...
Run the anatomy:
- Unit of observation: one apartment listing — each row is a single advertised unit.
- Response (\(y\)):
rent, monthly rent in dollars — the outcome we want to understand. - Explanatory variable (\(x\)):
sqft, the apartment’s size in square feet. - The comparison: larger apartments versus smaller ones — does typical rent differ with size, and by how much?
The skeleton is identical to the studyhabits case even though the subject is housing, not students. That is the point of the transfer example: the anatomy of a statistical question does not depend on the topic. And the same order-of-tilde caution applies — rent ~ sqft (“how does rent respond to size?”) is a different question from sqft ~ rent (“how does size relate to rent, with size as the outcome?”). For a renter deciding what a fair price is for a given size, rent ~ sqft is the question; the response is the thing you want to account for (rent), and size is what you account for it with. Naming that correctly, before fitting, is what keeps the eventual answer pointed at the question you actually have.
A common mistake
The signature Week 1 mistake is reaching for a number or a model before naming the question — opening the data, running lm(final ~ study), and reading off a slope without ever stating the unit, the response, the predictor, or the comparison. The result looks like an answer: it has decimals and a confidence interval. But because no question was posed, there is nothing for the number to be an answer to, and subtle errors (wrong unit, wrong comparison, a mismatch between the question and the data) sail through unnoticed. The cure is procedural and cheap: write the one-sentence question, with all five anatomy parts, before you touch lm(). If you cannot write the sentence, you are not ready to fit.
A close cousin is swapping the response and the explanatory variable — fitting study ~ final when the question is “how does score relate to study time.” These two formulas share a correlation, so the software runs happily either way and prints plausible-looking output, but they answer different questions and their slopes mean different things. The response is always the quantity you are trying to account for; the explanatory variable is what you account for it with. Decide which is which from the question in words, never from which column happens to come first in the spreadsheet.
Low-stakes self-checks (ungraded)
These are ungraded self-checks — no points, no submission, just a way to test whether the framing has landed. Work them in words before you ever think about software.
- For the question “how is final exam score related to weekly study hours?”, state in one sentence the unit of observation, the response, the explanatory variable, and the comparison.
- Read the formula
final ~ studyaloud as a full English question, naming all four anatomy parts. - Explain, in your own words, why
final ~ studyandstudy ~ finalare not the same question even though they share a correlation. - Invent a statistical question from your own life or major (sports, music, work, a hobby). Write it with a named unit, response, explanatory variable, and comparison, then write its model formula.
- Classify each as primarily an explanation or a prediction question, and say why: (a) “does adding incoming GPA change whether study hours still seem to matter for final score?” (b) “for a new student who studies 8 hours a week, what final score should we expect?”
- A classmate says, “I already ran the regression — the slope is 2.5, so I’m done.” Name what step of the workflow they skipped, and why that makes their number hard to defend.
Reading and source pointer
Read ModernDive Chapter 1 (Getting Started with Data) for the language of units, variables, and data frames, and skim the opening framing of ModernDive Chapter 5 (Basic Regression) to see where the response ~ explanatory idea is heading — but stop short of the fitting mechanics, which we take up in Week 3. As you read, map the book’s vocabulary onto this week’s anatomy: their “observational unit” is our unit of observation, their “outcome/explanatory” split is our response/explanatory split.
These notes are the course’s own synthesis, grounded in but not copied from the sources.
Public vs. graded
These notes, the examples, and the practice here are public and ungraded — study material only. No graded prompts, answer keys, rubrics, point values, or due dates appear on this site. Graded modeling checkpoints, labs, quizzes, homework/modeling memos, the midterm, the project, and the final live in Blackboard (the LMS), which is authoritative for due dates, submissions, and grades. If this page and Blackboard ever disagree, follow Blackboard.
Looking ahead
Next week we take the second arrow of the workflow — look — and graph final against study before fitting anything, learning to read a scatterplot for shape, strength, and trouble so that when the line finally arrives in Week 3 we already know what it should and should not be allowed to claim.