Week 6 — Multiple regression & adjustment
Adding a predictor and the “holding constant” interpretation
The week question
For five weeks the model carried a single predictor: final ~ study, the line \(\hat{y} = 52.0 + 2.5\,x\). That line said each extra weekly study hour was associated with a \(2.5\)-point higher predicted final exam score. It was a clean, defensible summary — but a worried question was sitting underneath it the whole time. Students who study more are not a random sample of the class. They tend, on average, to be the students who already arrive stronger: better-prepared, more confident, higher incoming GPA. If that is true, then the \(2.5\)-point slope is doing two jobs at once. It is partly capturing what an extra study hour adds, and it is partly capturing the fact that the studiers were already going to score higher anyway.
This week’s question is therefore sharp and practical: what happens to the study effect once we adjust for incoming GPA? Concretely, when we fit a model that holds prior_gpa constant, does the study slope stay at \(2.5\), or does it move? And whichever way it moves, what does that movement mean about the claim we are allowed to make? Multiple regression is the tool that lets us ask the question in a disciplined way: put both predictors in the same model and read each slope as an adjusted comparison rather than a raw one.
Why this matters
Almost every interesting modeling question in a real setting is a question about adjustment. Does a tutoring program raise scores once you account for which students enrolled? Does a drug lower blood pressure once you account for age and baseline health? Does a neighborhood’s rent reflect its size once you account for how far it sits from campus? In each case a one-predictor comparison is suspect precisely because the groups being compared differ in other ways too. The crude comparison answers “what is associated with the predictor, ignoring everything else”; the adjusted comparison answers “what is associated with the predictor among units that match on the other variables.” Those are different questions, and conflating them is one of the most common ways a data analysis goes wrong.
Multiple regression is the workhorse that makes adjustment routine. It does not require you to physically find matching students — the arithmetic of least squares does the matching for you, statistically. That power is also what makes interpretation subtle, which is why this week leans hard on the phrase “holding the other predictor constant.” Get that phrase right and the rest of the course opens up: confounding (next week), categorical adjustment, interactions, and model comparison are all variations on the move you learn here.
Learning goals
By the end of this week you should be able to:
- Write and read a multiple regression equation \(\hat{y} = b_0 + b_1 x_1 + b_2 x_2\), and say in plain words what each coefficient is.
- Interpret a partial slope as the change in the predicted response per one-unit change in that predictor, holding the other predictors constant, and explain why “holding constant” is essential.
- Explain what adjustment does to a coefficient — why the
studyslope can move whenprior_gpaenters the model — and connect that movement to confounding. - Fit
final ~ study + prior_gpawithlm(), read the coefficient table, and report \(R^2\) for the multiple-predictor model. - Recognize when a partial-slope interpretation is being abused (the “as if the other predictors do not exist” error) and correct it.
Core vocabulary
- Multiple regression. A linear model with two or more predictors: \(\hat{y} = b_0 + b_1 x_1 + b_2 x_2 + \cdots\). The response is still modeled as a sum of an intercept plus a weighted contribution from each predictor.
- Partial slope (adjusted coefficient). The coefficient \(b_j\) on predictor \(x_j\) in a multiple regression: the predicted change in \(y\) for a one-unit increase in \(x_j\) with all other predictors held fixed. It is “partial” because it isolates one predictor’s contribution after the others are accounted for.
- Crude vs. adjusted. The crude (or unadjusted, or marginal) slope comes from a model with that predictor alone; the adjusted slope comes from a model that also controls for other variables. Comparing them is how we detect and describe confounding.
- Adjustment / controlling for. Including a variable in the model so that comparisons are made among units that are alike on that variable. “Adjusting for
prior_gpa” and “controlling forprior_gpa” mean the same thing here. - Confounder. A variable associated with both the predictor of interest and the response, which can distort the crude comparison. Incoming GPA is a candidate confounder for the study–final relationship.
- Multiple \(R^2\). The fraction of variation in \(y\) explained by all the predictors together. It cannot decrease when you add a predictor, so a rise in \(R^2\) alone is weak evidence — interpretation, not \(R^2\), is the point.
Concept development
From one predictor to a plane: \(\hat{y} = b_0 + b_1 x_1 + b_2 x_2\)
A simple regression fits a line through a cloud of points in two dimensions: response on the vertical axis, one predictor on the horizontal. Add a second predictor and the picture gains a dimension. Now each observation lives in a three-dimensional space — study on one floor axis, prior_gpa on the other, final rising vertically — and least squares fits a flat plane through that cloud instead of a line. The fitted equation is
\[\hat{y} = b_0 + b_1 x_1 + b_2 x_2,\]
with $x_1 = $ study and $x_2 = $ prior_gpa. The structure is the same as before — an intercept plus a weighted sum of predictors — but now there are two slopes, one for each direction you can move along the floor. The intercept \(b_0\) is still the predicted response when every predictor is zero, and each slope is the tilt of the plane in its own direction. The model still chooses \(b_0, b_1, b_2\) to make the residuals \(e = y - \hat{y}\) as small as possible in the squared-error sense, exactly the least-squares idea from Week 3, just in one more dimension. Beyond two predictors we lose the picture but keep the algebra: the response is modeled as a flat surface (a hyperplane) in however many predictor dimensions we have.
The partial-slope interpretation: “holding the other predictor constant”
Here is the single most important sentence of the week. In the model \(\hat{y} = b_0 + b_1 x_1 + b_2 x_2\), the coefficient \(b_1\) is the predicted change in \(y\) for a one-unit increase in \(x_1\) while \(x_2\) is held constant. Algebraically this is exactly what the equation says: compare a student with study hours \(x_1 + 1\) to a student with study hours \(x_1\), both at the same prior_gpa. The intercept and the \(b_2 x_2\) term are identical for the two students, so they cancel, and the difference in predicted finals is just \(b_1\):
\[\big(b_0 + b_1(x_1+1) + b_2 x_2\big) - \big(b_0 + b_1 x_1 + b_2 x_2\big) = b_1.\]
The phrase “holding prior_gpa constant” is not decoration — it is the comparison the coefficient encodes. The slope answers a question about two students who have the same incoming GPA and differ by one study hour. That is a fundamentally different comparison from the crude one, which compared any extra-study-hour student to any fewer-study-hour student, GPA differences and all. The same logic gives \(b_2\): it is the predicted change in final per one-point increase in prior_gpa, holding study fixed. Each partial slope describes a “march in one direction only” across the fitted plane, with the other predictor pinned in place.
What adjustment does to a coefficient
So why does the study slope move when prior_gpa enters the model? Because the two predictors are themselves correlated. Stronger students (higher prior_gpa) also tend to study more. In the simple model, the study slope had no way to separate “the effect of an extra study hour” from “studiers were already higher-GPA students who score higher anyway” — both effects were loaded onto the one available coefficient. When prior_gpa joins the model, it claims the part of the score variation that travels with GPA. The study slope is left to describe only the residual relationship between study and final after GPA’s share is removed — the comparison among students who match on incoming GPA.
The direction and size of the move are informative. If the crude and adjusted slopes are close, the other predictor was not confounding the relationship much. If the adjusted slope shrinks toward zero (as it will in our example), some of the crude association was really GPA’s doing, “borrowed” by study because the two move together. A slope can even change sign under adjustment — a reversal dramatic enough to have its own name, Simpson’s paradox. The practical takeaway: a coefficient has no fixed meaning on its own. Its value depends on what else is in the model, because each coefficient is adjusted for the other predictors present. Reporting a slope without saying what it was adjusted for is reporting half a result.
Worked examples
Worked example — studyhabits: adjusting the study effect for incoming GPA
We return to the recurring studyhabits data (synthetic; seed set, \(n = 200\) students in one intro course). In Weeks 3–5 we fit final ~ study and got the crude line \(\hat{y} = 52.0 + 2.5\,x\). Now we add prior_gpa and fit the two-predictor model.
set.seed(33003)
# studyhabits: synthetic teaching data, n = 200 (NOT real student data)

fit2 <- lm(final ~ study + prior_gpa, data = studyhabits)
summary(fit2)

#> Coefficients:
#>             Estimate
#> (Intercept)   35.000   # b0: predicted final at study = 0 AND prior_gpa = 0 (extrapolation)
#> study          1.800   # b1: per study hour, HOLDING prior_gpa constant
#> prior_gpa      8.000   # b2: per GPA point, HOLDING study constant
#>
#> Multiple R-squared: 0.51
The picture below makes the adjustment visible. Every point is one of the \(200\) synthetic students, shaped and colored by which prior_gpa tertile they fall in (low / mid / high). The single gray line is the crude comparison — the Week 3–5 line, \(\hat y = 52.0 + 2.5x\), drawn across the whole class regardless of GPA. The three shorter, flatter lines are the adjusted comparison in picture form: each one uses the fitted plane’s own slope, \(1.8\), but plugs in that tertile’s own average prior_gpa for the intercept, so it traces the predicted final-vs-study relationship among students who share roughly the same incoming GPA. Read within one tertile at a time and the association looks visibly gentler than the steep gray line suggests — exactly the crude-to-adjusted flattening the coefficients describe.
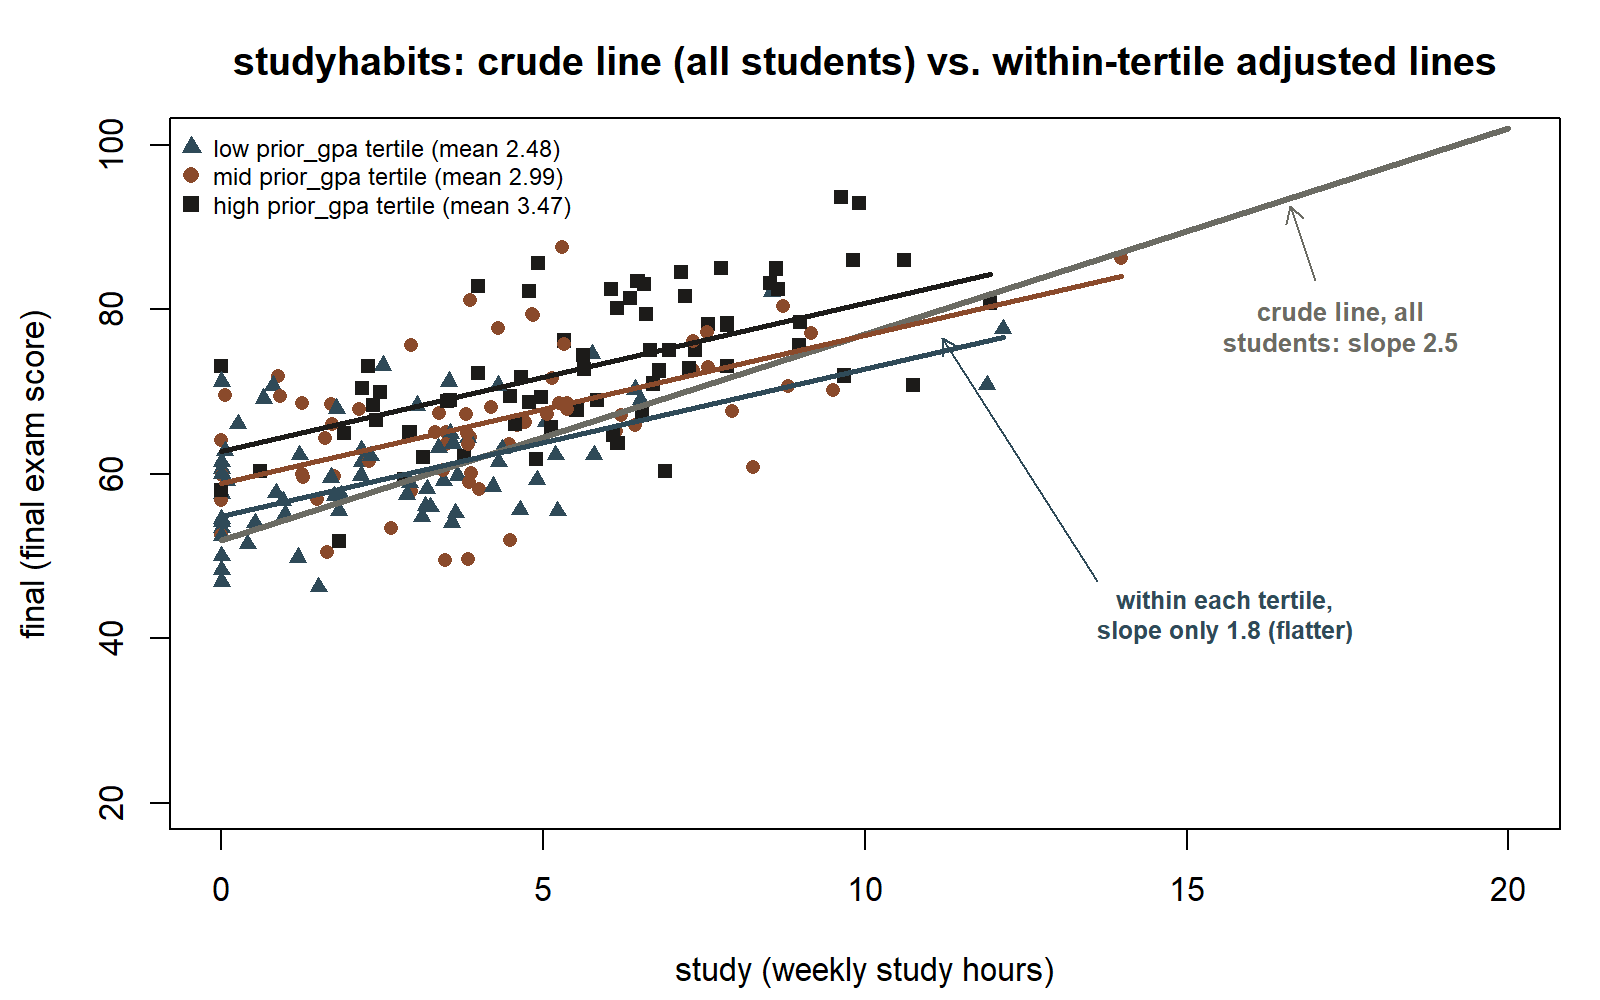
prior_gpa constant” flattens the study slope. Synthetic studyhabits scatter of final vs. study (\(n = 200\); seed set), shaped and colored by prior_gpa tertile (triangle = low, circle = mid, square = high). The single gray line is the crude comparison across everyone, \(\hat y = 52.0 + 2.5x\) (Weeks 3–5). The three shorter tertile-colored lines share the adjusted slope \(1.8\) but use each tertile’s own mean prior_gpa for the intercept (\(35.0 + 8.0 \times \overline{\text{prior\_gpa}}_{\text{tertile}}\)) — within any one tertile, the study–final association is visibly flatter than the crude line. The point cloud itself is an illustrative synthetic construction consistent with the locked coefficients, not raw data (synthetic; seed set).
The fitted plane is
\[\hat{y} = 35.0 + 1.8\,x_1 + 8.0\,x_2, \qquad x_1 = \texttt{study},\ x_2 = \texttt{prior\_gpa}.\]
Read each piece as a sentence. The intercept \(b_0 = 35.0\) is the predicted final for a student with zero study hours and a zero incoming GPA — a combination no real student has, so this is double extrapolation and should be treated as a mathematical anchor for the plane, not a meaningful prediction. The study slope \(b_1 = 1.8\) says that among students with the same incoming GPA, each additional weekly study hour is associated with a \(1.8\)-point higher predicted final, on average. The prior_gpa slope \(b_2 = 8.0\) says that among students who study the same number of hours, each one-point-higher incoming GPA is associated with an \(8.0\)-point higher predicted final.
The headline is the comparison with Week 3. The study slope dropped from \(2.5\) (crude) to \(1.8\) (adjusted) once prior_gpa is held constant:
\[b_1^{\text{crude}} = 2.5 \;\longrightarrow\; b_1^{\text{adjusted}} = 1.8.\]
That drop is exactly the confounding story. Stronger students both study more and score higher, so in the simple model the study slope had been quietly carrying some of GPA’s credit. After adjustment, study still shows a positive association — studying is not an illusion — but a meaningful slice of the original \(2.5\) was really about who studies, not about studying itself. The model’s \(R^2 = 0.51\), up from \(0.34\) for the one-predictor model, meaning the two predictors together explain \(51\%\) of the variation in final scores versus \(34\%\) for study alone. The jump is real, but remember \(R^2\) can only rise when predictors are added, so the interpretive gain — separating study’s contribution from GPA’s — is the substantive result, not the \(R^2\) by itself. As always with a fitted model, the next move is criticism, not celebration: a residual plot (Week 5’s tool) should still be checked before trusting the plane, since adjustment fixes the comparison but not, on its own, the model’s fit.
Worked example — transfer: apartment rent, size, and distance to campus
Now move the same idea to a new context. Imagine a synthetic listings dataset (synthetic; seed set) of off-campus apartments with monthly rent (dollars), size (square feet), and distance_to_campus (miles). A simple model rent ~ size gives a crude size slope — say each extra square foot is associated with some dollars of rent. But size and distance are entangled: the larger apartments tend to sit farther from campus, where land is cheaper, while the small, pricey studios cluster near campus. So the crude size slope mixes “bigger costs more” with “the big ones happen to be in cheaper, farther-out areas.”
set.seed(33003)
# apartments: synthetic listings (NOT real rental data)

fit_rent <- lm(rent ~ size + distance_to_campus, data = apartments)
summary(fit_rent)
#> Coefficients: (illustrative — the size coefficient changes once distance is in the model)
#> the size slope shifts after adjusting for distance_to_campus
The diagram below draws the structure that makes this happen — the same shape as the studyhabits story, just with new variable names. distance_to_campus sits upstream of both size and rent: it is a common cause, so it can create an association between size and rent even before accounting for whatever direct relationship those two have with each other.
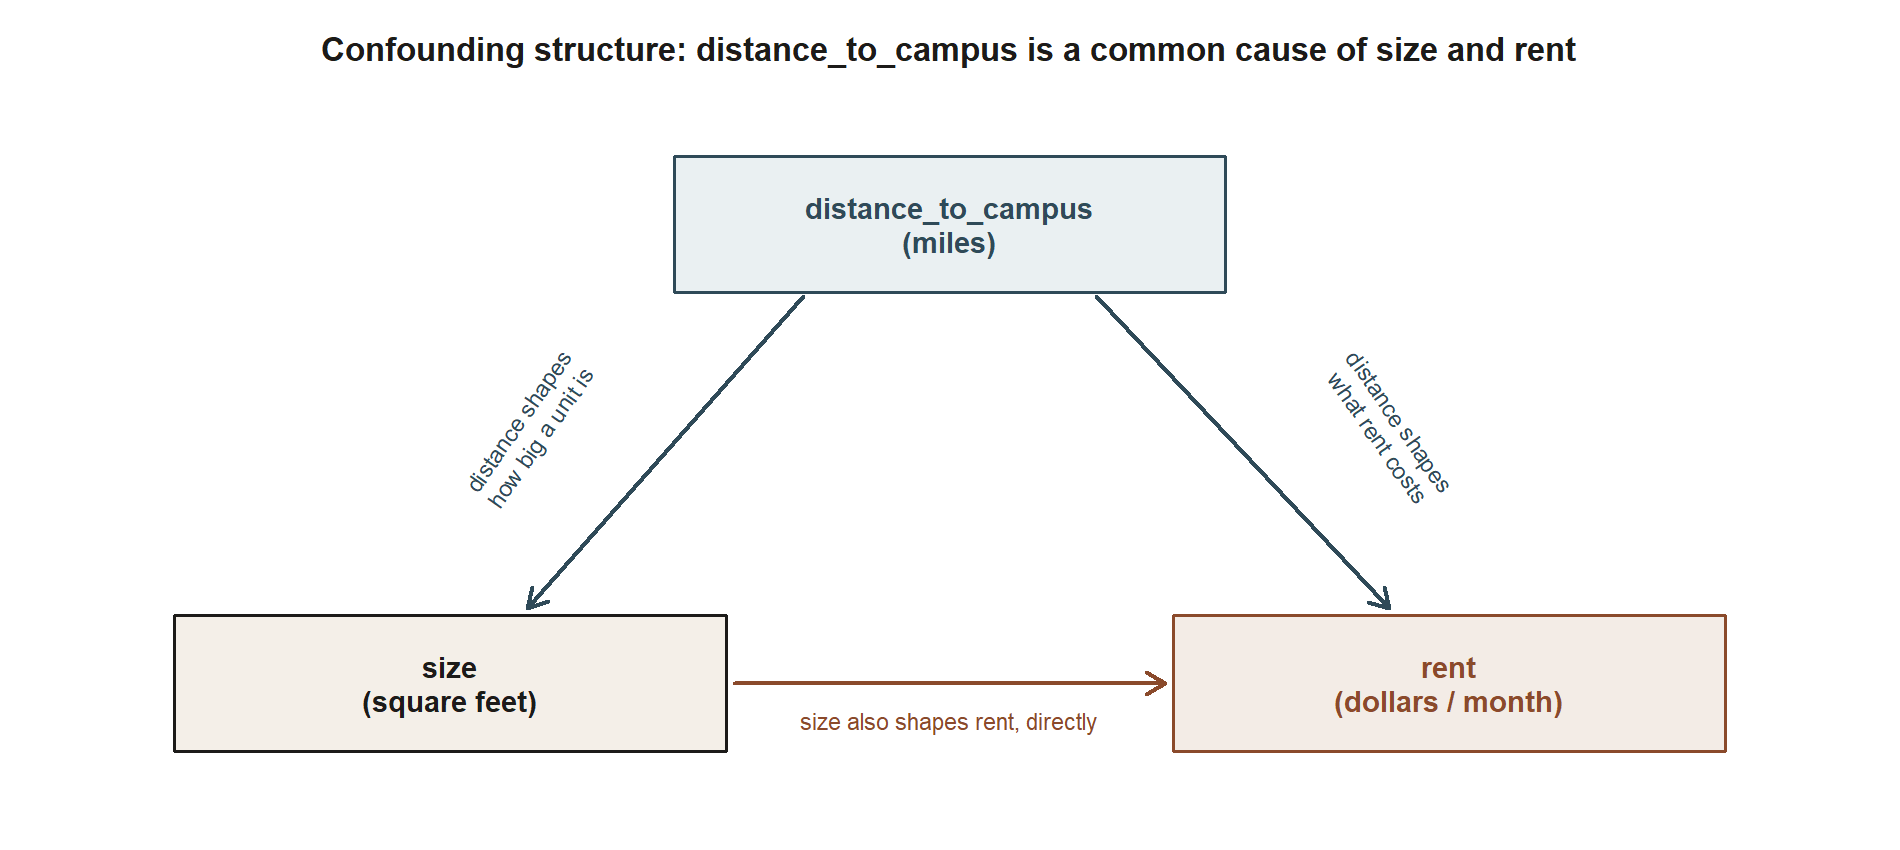
distance_to_campus points into both size and rent — it shapes how big a typical unit is at that distance and what rent that distance commands — while size also points directly into rent. Because distance_to_campus is a common cause of the predictor (size) and the response (rent), the crude size slope mixes “bigger costs more” with “the big ones happen to sit farther out, where rent is cheaper anyway”; adjusting for distance_to_campus isolates the direct size () rent arrow.
When distance_to_campus enters the model, the size coefficient changes, because part of what looked like a size effect was really a location effect: the bigger units were discounted for being far out. The adjusted size slope now compares apartments at the same distance from campus that differ in square footage — a cleaner answer to “what is space worth, holding location fixed?” The structural lesson is identical to the studyhabits case: a coefficient means “the association with this predictor, adjusted for the others in the model,” and that adjustment can move it up or down. Same move, different field — which is the point of a transfer example.
A common mistake
The signature error this week is interpreting a partial slope as if the other predictors do not exist — dropping the “holding constant” clause. A student reads \(b_1 = 1.8\) from final ~ study + prior_gpa and says “so each study hour is worth \(1.8\) points.” That sentence is wrong in a quiet, dangerous way. The honest sentence is “each study hour is associated with \(1.8\) more points among students with the same incoming GPA.” Strip the clause and you have silently changed the comparison back to the crude one — except now you are attaching the crude claim to the adjusted number, which matches neither model.
The same mistake shows up when people compare a coefficient across two different models as if the number had a fixed meaning: “study was \(2.5\), now it’s \(1.8\), so the data changed.” The data did not change; the comparison changed. The \(2.5\) answered an unadjusted question and the \(1.8\) answers an adjusted one. A coefficient is only interpretable together with the list of predictors it was adjusted for. Whenever you read or write a partial slope, finish the sentence with “holding the other predictors constant” — and name them. If you cannot name what is held constant, you do not yet know what the coefficient means.
Low-stakes self-checks (ungraded)
These are ungraded self-checks — no submission, no points. Use them to test whether the partial-slope idea has landed.
- In \(\hat{y} = 35.0 + 1.8\,x_1 + 8.0\,x_2\), write the full one-sentence interpretation of the \(1.8\), including the “holding constant” clause and naming the variable held fixed.
- Two students differ by \(2\) study hours but have the same incoming GPA. By how many points does the model predict their finals differ? Now answer for two students who differ by \(0.5\) GPA points at the same study level.
- Explain, in your own words, why the study slope fell from \(2.5\) to \(1.8\) when
prior_gpaentered the model. What would it have meant if the slope had not moved at all? - The two-predictor \(R^2\) is \(0.51\) versus \(0.34\) for study alone. Why is “the \(R^2\) went up” by itself weak evidence that adding
prior_gpawas the right modeling choice? What is the stronger reason? - A classmate says “adjusting for GPA proved that studying barely matters.” Rewrite their claim so it correctly describes what the adjusted slope of \(1.8\) does and does not show.
Reading and source pointer
Read ModernDive Chapter 6 — Multiple Regression alongside these notes; it develops the two-predictor model \(\hat{y} = b_0 + b_1 x_1 + b_2 x_2\), the “holding the other variable constant” interpretation of partial slopes, and the way a coefficient shifts when a second predictor enters. Chapter 5 (simple regression) is the foundation this week extends. These notes are the course’s own synthesis, grounded in but not copied from the sources.
Public vs. graded
These notes, the examples, and the practice here are public and ungraded — study material only. There are no graded prompts, answer keys, rubrics, point values, or due dates on this site. Graded modeling checkpoints, labs, quizzes, homework/modeling memos, the midterm, the project, and the final live in Blackboard (the LMS), which is authoritative for due dates, submissions, and grades. If this page and Blackboard ever disagree, follow Blackboard.
Looking ahead
Next week we name the move you made here for what it is — confounding — and sharpen the crude-versus- adjusted contrast into the central question of explanation: when can an adjusted slope support a claim about why, and when is it still just an association? (Week 7 also carries the in-class midterm.)
See also
- Companion lab: Lab 6 — Fitting multiple regression
- Previous: Week 5 — Diagnostics & model adequacy
- Next: Week 7 — Confounding & explanation (midterm)
- Reference: Notation glossary · Modeling reference