Week 12 — Model comparison & selection
Comparing reasonable models without outsourcing judgment
The week question
For ten weeks you have built models one decision at a time — add a predictor, check a residual plot, adjust for a confounder, validate on held-out data. Each choice was local. This week the choices pile up into a genuine dilemma. You sit down with the studyhabits data and you can write down three perfectly reasonable regressions: a lean one with a single predictor, a middle one with two, and a sprawling one with everything you measured. All three fit. All three are defensible. You have to pick. The week question is the one every modeler eventually faces and almost everyone gets wrong at least once:
When several reasonable models all fit, which one should you trust — and why is the answer almost never “the biggest one”?
The honest surprise of the week is that the obvious tiebreaker fails. The model that fits the training data best — the one with the highest \(R^2\) — is, mechanically, always the one with the most predictors. So \(R^2\) cannot break the tie; it is rigged in favor of complexity before you even look. You need a comparison that charges a model for the predictors it spends, and, just as importantly, you need to understand that the final call is a judgment you make, not a verdict an algorithm hands you.
Why this matters
Choosing a model is the moment a modeler’s judgment becomes visible. Up to this point the data has been doing a lot of the talking: fit the line, read the slope, check the residuals. But when two or three models all pass their diagnostics and all tell a coherent story, the data has said everything it can say, and the choice falls to you. Get it wrong and you carry the cost into everything downstream — a bloated model gives you coefficients you can’t interpret, confidence intervals that are wider than they need to be, and, as Week 10 showed, worse predictions on the next student despite a prettier fit on this one.
It matters even more because the wrong instinct here is so natural and so well-rewarded in the short run. More predictors always raise \(R^2\). Always — not usually, not on average, but as a mathematical certainty. So if you let \(R^2\) pick, you will pick the biggest model every single time, and you will feel like you are being rigorous while doing it, because you are pointing at a number that went up. This week installs the two things that protect you: tools that penalize complexity (adjusted \(R^2\), AIC) so the comparison is fair, and the discipline to treat those tools as advisors rather than oracles. Selection is where statistical modeling stops being a procedure and becomes a craft — and where the temptation to outsource the craft to a stepwise algorithm is strongest and most dangerous.
Learning goals
By the end of this week you should be able to:
- Explain why adding any predictor — even a useless one — can only raise (never lower) the training \(R^2\), and why that makes raw \(R^2\) useless as a tiebreaker between models of different sizes.
- Describe how adjusted \(R^2\) and AIC repair the comparison by charging a penalty for each predictor, so that a predictor must earn its place by explaining more than noise would.
- Compare a set of candidate models on adjusted \(R^2\) and AIC, read an
AIC()table, and identify the parsimony sweet spot — the smallest model that captures essentially all the signal. - Articulate why model selection is a judgment informed by these criteria, not an algorithm that returns the one true model, and name the specific dangers of treating stepwise selection as objective truth.
- Defend a chosen model to someone who only looked at \(R^2\) and wanted the biggest one.
Core vocabulary
- Parsimony. The preference for the simplest model that adequately explains the data — fewest moving parts for the explanation you need. Often called Occam’s razor in this setting.
- \(R^2\) (coefficient of determination). The fraction of variation in \(y\) the model accounts for on the training data. Monotonically non-decreasing in the number of predictors — it can never go down when you add one.
- Adjusted \(R^2\). A version of \(R^2\) that penalizes the model for each predictor it spends. It rises only when a new predictor explains more than a useless predictor would be expected to by chance.
- AIC (Akaike Information Criterion). A model-comparison score that balances fit against complexity: \(\mathrm{AIC} = -2\,\ell + 2k\), where \(\ell\) is the maximized log-likelihood (fit) and \(k\) is the number of parameters (complexity). Lower is better. Only differences in AIC between models on the same data are meaningful.
- Penalty for complexity. The “\(+2k\)” in AIC and the degrees-of-freedom correction in adjusted \(R^2\): the price a model pays per predictor, so that fit has to be bought, not gifted.
- Stepwise selection. An automated procedure that adds or removes predictors one at a time to optimize a criterion. Convenient, widely used, and routinely misread as objective truth — it is neither.
- Parsimony sweet spot. The model where adding the next predictor stops buying meaningful explanation — the point where the criteria flatten out and bigger stops being better.
Concept development
More predictors always raise \(R^2\) — so \(R^2\) can’t pick
Start with the fact that breaks the naive approach. Take any model and add one more predictor — any predictor at all. The new model’s training \(R^2\) will be at least as large as the old one’s, and in practice strictly larger. This is not a tendency or an empirical regularity; it is a mathematical guarantee of least squares. The reason is simple once you see it. Least squares chooses coefficients to minimize the sum of squared residuals. Adding a predictor enlarges the set of models the fitter can choose from — it can always set the new coefficient to exactly zero and recover the old model, so it can never do worse, and it will only set it to zero if no nonzero value helps at all. With real data, some nonzero value always shaves at least a sliver off the residuals, even if that predictor is pure noise. So \(R^2\) ticks up.
Sit with the consequence. Suppose you generated a column of random numbers — coin flips, dice, anything with no relationship to final whatsoever — and added it to your model. The training \(R^2\) would still go up. Slightly, but up. A criterion that rewards you for adding noise is worse than useless as a tiebreaker; it is actively misleading, because it dresses complexity up as improvement. This is the same optimism you met in Week 10 wearing a different coat: training fit always flatters the bigger model, so training fit can never be the thing that tells you to stop. If \(R^2\) is your judge, the kitchen-sink model wins every contest it enters, and you will never once be warned that you have overbuilt.
Adjusted \(R^2\) and AIC — making complexity cost something
The repair is to make every predictor pay rent. Two tools do this, and you should know both.
Adjusted \(R^2\) modifies the formula so that it accounts for the number of predictors \(p\) and the sample size \(n\):
\[ R^2_{\text{adj}} = 1 - (1 - R^2)\,\frac{n - 1}{n - p - 1}. \]
The ordinary \(R^2\) can only rise when you add a predictor; adjusted \(R^2\) can rise or fall. It rises only if the new predictor explains more variation than a typical useless predictor would be expected to explain by chance alone. If a predictor pulls its weight, adjusted \(R^2\) goes up and rewards you. If it is mostly noise, the penalty outweighs the sliver of fit and adjusted \(R^2\) goes down — a built-in warning that ordinary \(R^2\) can never give. That asymmetry is the whole point: adjusted \(R^2\) is a fair scorecard where raw \(R^2\) is rigged.
AIC comes at the same problem from information theory. It scores a model as
\[ \mathrm{AIC} = -2\,\ell + 2k, \]
where \(\ell\) is the maximized log-likelihood — a measure of fit that goes up as the model fits better, so \(-2\ell\) goes down — and \(k\) is the number of estimated parameters. The first term rewards fit; the second charges \(2\) units for every parameter the model spends. Lower AIC is better. A predictor only lowers AIC if the fit it buys (the drop in \(-2\ell\)) exceeds the \(+2\) it costs. The numbers themselves have no absolute meaning — an AIC of \(1{,}480\) is neither good nor bad in isolation — only differences between models fit to the same data are interpretable. A drop of a few AIC units is a real but modest preference; a drop of, say, \(30\) or \(40\) is decisive. Adjusted \(R^2\) and AIC usually agree on the ranking, and when they do you can lean on the conclusion with confidence.
Selection is judgment, not an algorithm to outsource
Here is the part the criteria cannot do for you. It is tempting to imagine you could feed all your predictors to a procedure that automatically keeps the ones that lower AIC and drops the rest, and read off “the best model” at the end. That procedure exists — it is stepwise selection — and it is one of the most overused and most misunderstood tools in applied statistics. The trouble is not that it never picks a reasonable model; sometimes it does. The trouble is what people believe about its output.
Stepwise selection does not return the true model; it returns a model that happened to optimize a criterion on this sample, with all the noise that implies. Run it on a fresh sample from the same population and it can hand you a different set of predictors. Worse, by trying many models and reporting only the winner, it quietly invalidates the very \(p\)-values and confidence intervals it prints — they were computed as if you had specified that one model in advance, which you did not. The standard errors come out too small, the intervals too narrow, the significance overstated. The algorithm launders a search through dozens of models into output that looks like a single confirmatory analysis, and that disguise is exactly why it is dangerous: it produces overconfident, hard-to-interpret models while wearing the costume of objectivity.
So treat the criteria as advisors. Adjusted \(R^2\) and AIC tell you where the fit-versus-complexity tradeoff sits; they do not tell you what your predictors mean, whether a coefficient has the sign theory expects, whether a variable belongs on causal grounds, or whether the residuals are well-behaved. Those are your calls. A predictor you keep for a sound substantive reason — like adding prior_gpa in Week 6 to address confounding — stays even if the criteria are lukewarm, because explanation has reasons the criteria can’t see. A predictor the algorithm wants to keep purely because it nudged AIC down by half a unit can go. Selection is a conversation between what the data prefers and what you understand; outsourcing your half of that conversation to a stepwise routine is the failure this week is built to prevent.
Worked examples
Worked example — studyhabits: M1 vs. M2 vs. M3
We return to the recurring studyhabits dataset (synthetic; seed set; \(n = 200\) students in one intro course; set.seed(33003)). The response is final, and we have three reasonable candidates for explaining it. M1 is the lean Week 3 model, final ~ study. M2 adds the one predictor we already trust on substantive grounds, final ~ study + prior_gpa. M3 is a kitchen sink — everything we measured thrown in at once. Fit all three and read their raw \(R^2\):
set.seed(33003)

m1 <- lm(final ~ study, data = studyhabits)                                # 1 predictor
m2 <- lm(final ~ study + prior_gpa, data = studyhabits)                     # 2 predictors
m3 <- lm(final ~ study + prior_gpa + attend + format + works,              # kitchen sink
         data = studyhabits)

#> raw R^2:   M1 = 0.34   M2 = 0.51   M3 = 0.55
Read those raw numbers exactly the way this week warns you not to, and M3 “wins”: \(R^2 = 0.55\) is the highest, so the biggest model fits best. But you already know why it’s highest — it has the most predictors, and more predictors can only push \(R^2\) up. The raw column is rigged toward M3 before we look at a single coefficient. To compare fairly, we charge for complexity. Here is the adjusted \(R^2\) for each model:
summary(m1)$adj.r.squared
summary(m2)$adj.r.squared
summary(m3)$adj.r.squared

#> adjusted R^2:   M1 = 0.337   M2 = 0.505   M3 = 0.539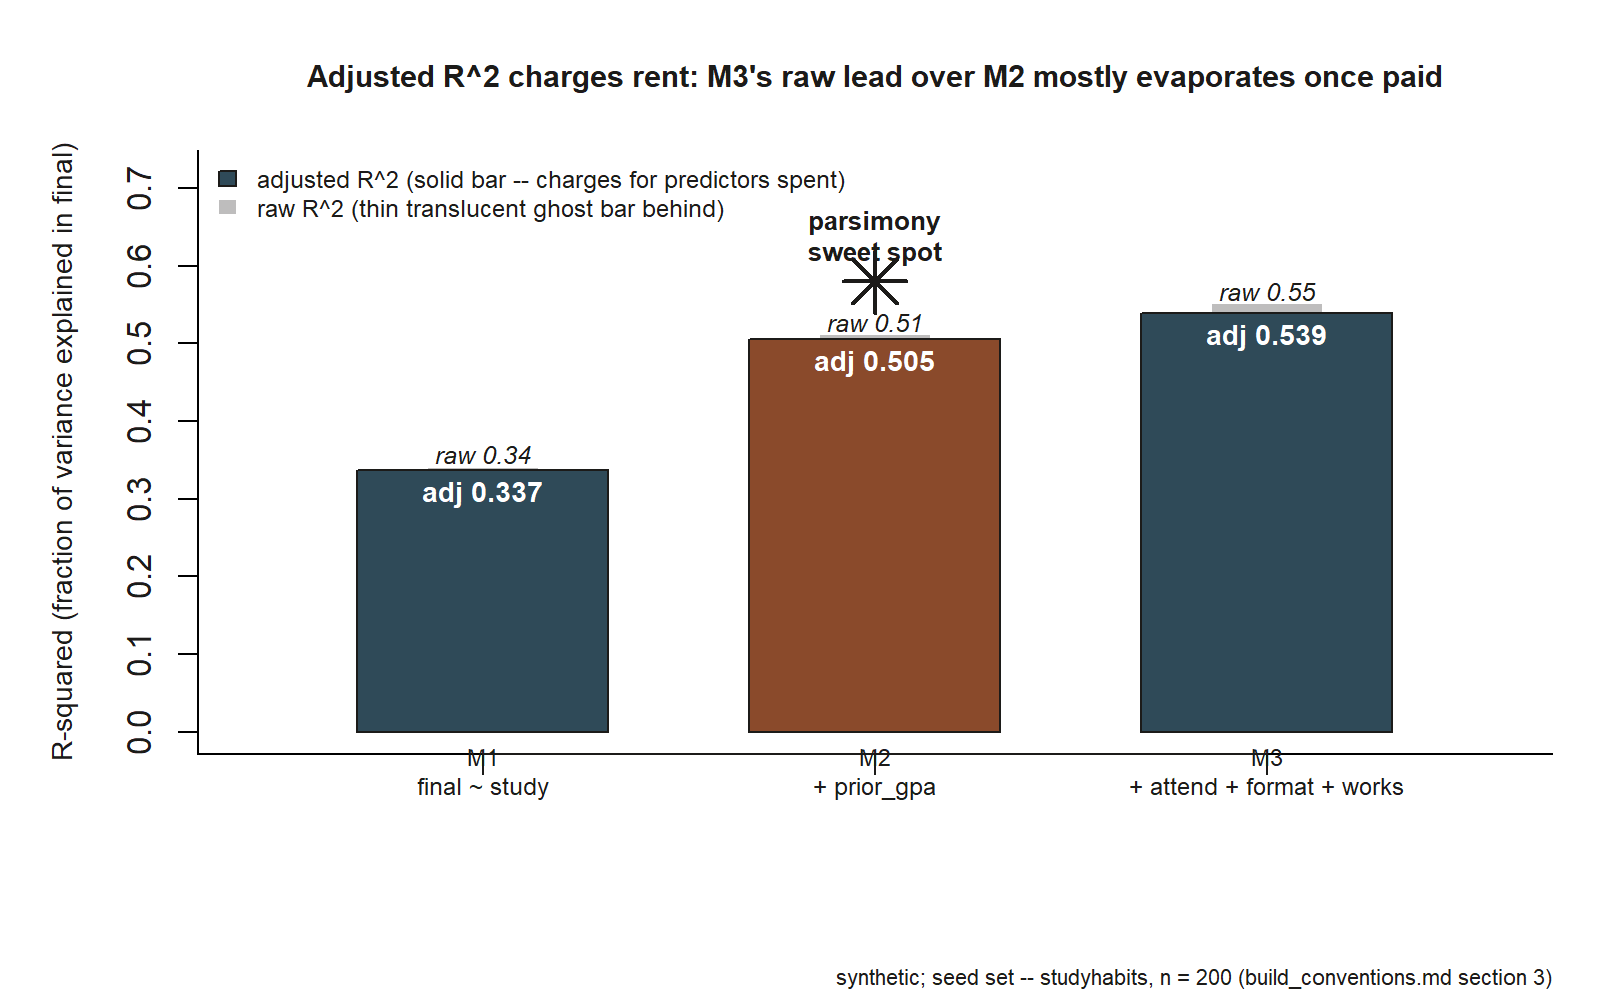
studyhabits).
Now the story changes shape. Going from M1 to M2, adjusted \(R^2\) leaps from \(0.337\) to \(0.505\) — a gain of about \(0.17\). That is enormous: adding prior_gpa to study buys a large, real improvement that easily survives the complexity penalty. The predictor is pulling its weight, and the fair scorecard says so. Going from M2 to M3, adjusted \(R^2\) creeps from \(0.505\) to \(0.539\) — a gain of about \(0.034\), despite throwing in three extra predictors (attend, format, works). The raw \(R^2\) rose from \(0.51\) to \(0.55\), but once we charge for those three predictors, almost all of that gain evaporates. The kitchen sink is buying a sliver of fit at a heavy price in complexity.
AIC tells the same story in its own currency. Lower is better, and only the differences matter:
AIC(m1, m2, m3)

#>     df      AIC
#> m1   3   <high>          # baseline
#> m2   4   <much lower>    # AIC drops sharply from M1 — prior_gpa earns its place
#> m3   8   <barely lower>  # AIC barely improves on M2 — extra predictors don't pay
The pattern is decisive and consistent with adjusted \(R^2\): AIC drops sharply from M1 to M2 — the large fit improvement far outweighs the cost of one extra parameter — and then barely budges from M2 to M3, even though M3 spends four more parameters than M2. When a model adds several predictors and the AIC improves only marginally, those predictors are mostly absorbing noise, not explaining final. The criterion is telling you the same thing adjusted \(R^2\) did: the explanatory work was essentially done by study and prior_gpa.
So which model do we trust? M2 is the parsimony sweet spot. It captures the large, real signal that M1 misses (the entire point of adjusting for prior_gpa — a student’s incoming preparation matters a lot, and Week 6 already gave us a sound confounding reason to include it), while avoiding the noise-fitting that M3 pays for and barely benefits from. M2’s two coefficients are interpretable: the study slope, the prior_gpa slope, each with a clean meaning. M3’s eight-ish coefficients are a thicket — harder to interpret, with wider intervals, and, per Week 10, likely to predict worse out of sample despite the higher training \(R^2\). Every criterion that charges for complexity — adjusted \(R^2\), AIC — points to M2, and so does the substantive reading. We choose M2, and we can defend the choice to anyone who only saw M3’s \(0.55\) and wanted the biggest.
Worked example — transfer: choosing a polynomial degree
Move the idea to a fresh setting where the “extra predictors” are powers of a single variable. Suppose a lab measures how the yield of a chemical reaction depends on temperature, and the relationship has a gentle curve. You can model yield as a polynomial in temp and you must choose the degree — and each higher degree is just another predictor (temp, temp^2, temp^3, …), so this is exactly the same problem in disguise:
set.seed(33003)
d1 <- lm(yield ~ temp, data = reaction)                       # straight line
d2 <- lm(yield ~ poly(temp, 2), data = reaction)              # quadratic
d3 <- lm(yield ~ poly(temp, 3), data = reaction)              # cubic
d8 <- lm(yield ~ poly(temp, 8), data = reaction)              # degree-8 wiggle

AIC(d1, d2, d3, d8)
#> straight line (d1):  AIC high           — misses the curve
#> quadratic    (d2):   AIC drops sharply  — captures the curve: the sweet spot
#> cubic        (d3):   AIC barely better  — the cubic term adds little
#> degree 8     (d8):   AIC worse again    — fitting wiggles that aren't there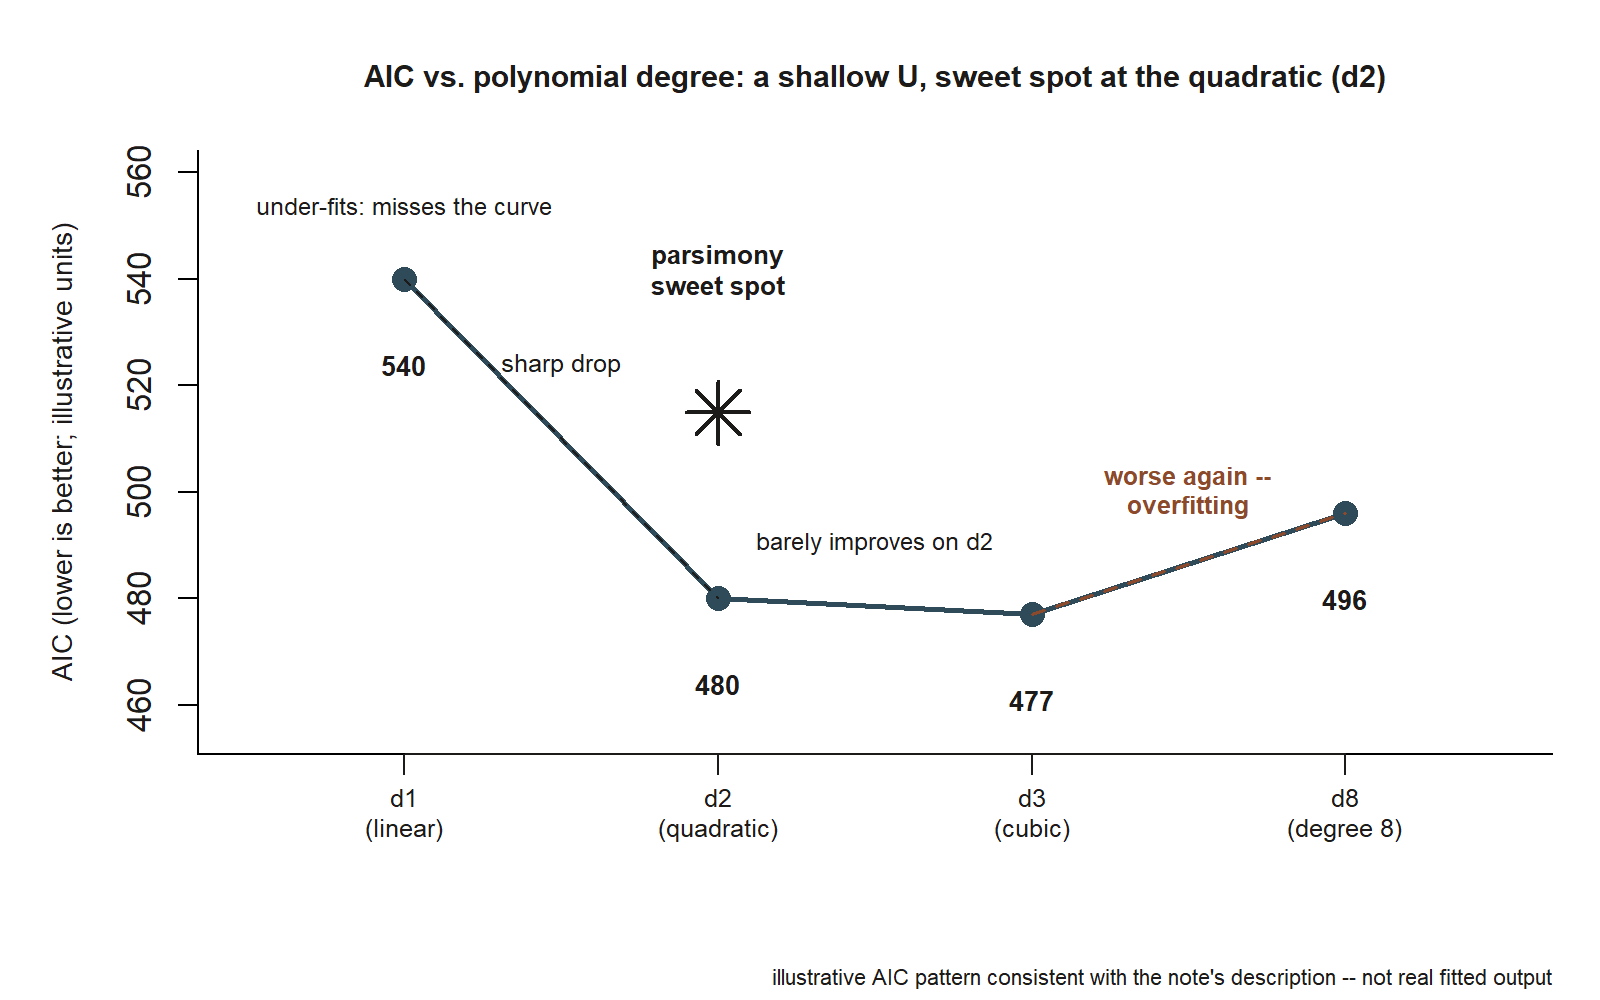
The shape of this AIC table is the lesson of the week made geometric. The straight line under-fits — it can’t bend to follow the curve, so its AIC is high. The quadratic captures the real curvature and AIC drops sharply, exactly the way it did from M1 to M2: a genuine feature of the data, well bought. The cubic barely improves on the quadratic, the same flat step we saw from M2 to M3 — the third-degree term is mostly chasing noise. Push all the way to degree eight and AIC turns worse: the curve now snakes through individual points, fitting wiggles that won’t reappear in the next batch of measurements — overfitting, and AIC’s penalty finally punishes it outright. The parsimony sweet spot is the quadratic: the simplest curve that captures the real shape, chosen because the criteria flatten right after it, not because some routine declared it optimal. And note the same caution applies — if chemistry told you the mechanism is genuinely cubic, you would keep the cubic term on substantive grounds even with a lukewarm AIC. The criterion advises; your understanding decides.
A common mistake
The signature mistake of this week is picking the model with the highest raw \(R^2\) — and, its more sophisticated cousin, treating the output of a stepwise routine as objective truth. Both are the same error: letting a number or an algorithm make a judgment that belongs to you. Reaching for the highest \(R^2\) guarantees you pick the biggest model every time, because raw \(R^2\) can only go up as predictors are added — you have handed the decision to a quantity that is structurally incapable of preferring a simpler model. In the studyhabits comparison, that logic ships M3 (\(R^2 = 0.55\)) over M2 (\(R^2 = 0.51\)) and saddles you with a thicket of barely-helpful predictors, worse out-of-sample prediction, and coefficients you cannot cleanly read — all for a \(0.04\) bump that mostly vanishes the moment you charge for complexity.
The stepwise version feels more rigorous and is, if anything, more dangerous. Running an automated search and reporting its winner as “the model the data chose” disguises a hunt through many models as a single planned analysis. The reported \(p\)-values and intervals were never corrected for that search, so they are overconfident, and the selected predictors can change wholesale on a fresh sample. People trust the output precisely because it came from an algorithm and feels objective — which is exactly backwards.
The fix is a habit: compare candidate models on criteria that penalize complexity, look for the parsimony sweet spot where bigger stops buying meaningful fit, and then make the final call yourself, informed by what the predictors mean. Ask of every extra predictor the question raw \(R^2\) can’t ask: does it raise adjusted \(R^2\) or lower AIC by enough to matter, and does it belong on substantive grounds? If the criteria flatten and the predictor has no story, leave it out. If a criterion is lukewarm but theory demands the variable, keep it. The decision is yours to defend — not the algorithm’s to dictate.
Low-stakes self-checks (ungraded)
These are ungraded self-checks — no points, nothing to submit. Use them to test whether the idea has landed.
- Explain in one sentence why adding a column of random numbers to a regression will still raise the training \(R^2\). Why does that fact disqualify raw \(R^2\) as a tiebreaker between models of different sizes?
- Going from M1 to M2, adjusted \(R^2\) rose from \(0.337\) to \(0.505\); going from M2 to M3, it rose only from \(0.505\) to \(0.539\) despite three more predictors. In words, what does the difference between those two jumps tell you about which predictors are earning their place?
- AIC drops sharply from M1 to M2 but barely improves from M2 to M3. Which model does AIC prefer, and why is “barely improves despite four more parameters” a signal to stop rather than to keep going?
- A classmate selected a model with stepwise regression and says, “I didn’t choose it — the algorithm did, so it’s objective.” Name two specific reasons that confidence is misplaced.
- In the polynomial transfer example, AIC drops sharply for the quadratic, barely changes for the cubic, and gets worse by degree eight. Which degree is the parsimony sweet spot, and what is going wrong at degree eight?
- You have a predictor that lowers AIC by only half a unit but that theory says clearly belongs in the model on causal grounds. Do you keep it? Explain what this says about who makes the final selection decision.
Reading and source pointer
For this week’s reading, see ModernDive Chapter 10 (inference for regression), which develops how to judge what a fitted regression supports — the standard errors, the tests, and the reasoning about whether a predictor’s contribution is real rather than noise — the exact machinery you lean on when deciding whether a predictor earns its place. Pair it with Beyond Multiple Linear Regression (Roback & Legler), Chapter 1 (review of multiple linear regression), which revisits the multiple-regression framework and frames model-building as a deliberate, criterion-informed choice rather than an automatic one. Together they ground the fit-versus-complexity tradeoff, AIC, and the case against treating selection as a push-button procedure.
These notes are the course’s own synthesis, grounded in but not copied from the sources.
Public vs. graded
These notes, the examples, and the practice here are public and ungraded — study material only. No graded prompts, answer keys, rubrics, point values, or due dates appear on this site. Graded modeling checkpoints, labs, quizzes, homework/modeling memos, the midterm, the project, and the final live in Blackboard (the LMS), which is authoritative for due dates, submissions, and grades. If this page and Blackboard ever disagree, follow Blackboard.
Looking ahead
Next week we connect the comparison of group means to the regression machinery you already know: one-way ANOVA of final by format turns out to be the indicator regression final ~ format in different clothing, the same total variation split the same way — the unifying idea that ANOVA is regression with a categorical predictor.