Week 14 — Reproducible modeling reports
Turning a fitted model into a trustworthy, reproducible report
Concept note
For thirteen weeks you have been building a single skill — making a careful claim from data and saying honestly what it can and cannot support. This week the object of attention shifts from the claim itself to the record of the claim. A fitted model is an argument; a report is the document that lets someone else check the argument. And here is the idea that organizes the whole week: reproducibility is part of a model’s credibility. A result that no one — including future you — can re-run is not yet trustworthy.
That sentence deserves to be taken literally, not as a slogan. When you report that studying one more hour a week is associated with a \(2.5\)-point higher predicted final, you are asking a reader to believe a number. The number came from a particular dataset, loaded in a particular way, with a particular random seed, fit with a particular call to lm(), on a particular day, with particular versions of R and its packages. If any of those things is hidden, the reader cannot tell whether your \(2.5\) is a stable feature of the data or an artifact of a path you took and forgot. A modeling result is only as believable as the trail that produced it. Reproducibility is what turns “I got \(2.5\)” into “anyone who runs this gets \(2.5\)” — and the second statement is the one a scientific community can build on.
This is not a programming aside bolted onto a statistics course. It is continuous with everything you have practiced. Diagnostics ask whether the model fits the data; cross-validation asks whether the fit generalizes to new data; reproducibility asks whether the analysis generalizes to a new run by a new person. All three are forms of the same discipline — refusing to trust a result until it has survived a check it could have failed. A residual plot can falsify your linearity assumption. A held-out fold can falsify your prediction. A clean re-render on a colleague’s laptop can falsify your claim that “the code produces the report.” Each is a chance for the world to say no, and a result that has survived several of those chances is worth more than one that has survived none.
There is also a quieter, human reason. The person most likely to need to re-run your analysis is you, six months from now, when a reviewer asks a question or you want to extend the model. Future you is a stranger who has forgotten every undocumented choice present you is making right now. A reproducible report is a letter to that stranger. When it renders cleanly from raw data to finished prose with one command, you have been kind to your future self and honest with your reader at the same time.
The tool we use to make this concrete is Quarto, the literate-programming system ModernDive builds on. A Quarto .qmd file weaves prose, code, and output into one document: the words explain, the code fences carry the analysis, and rendering executes the code and stitches the results into the text. Crucially, the report cannot drift from the analysis, because the report is the analysis. There is no copy-pasted number to go stale — when the data or the model changes, you re-render and every figure, coefficient, and sentence-with-a-number updates together. That single property — no manual transcription between analysis and write-up — removes one of the most common and most embarrassing sources of error in applied work.
The picture below names the four stages that chain runs through, every time: the raw studyhabits.csv file, the single .qmd file that holds prose, code, and a fixed seed together, a fresh-session Quarto render, and the rendered HTML report that carries both the numbers and a record of the environment that produced them.
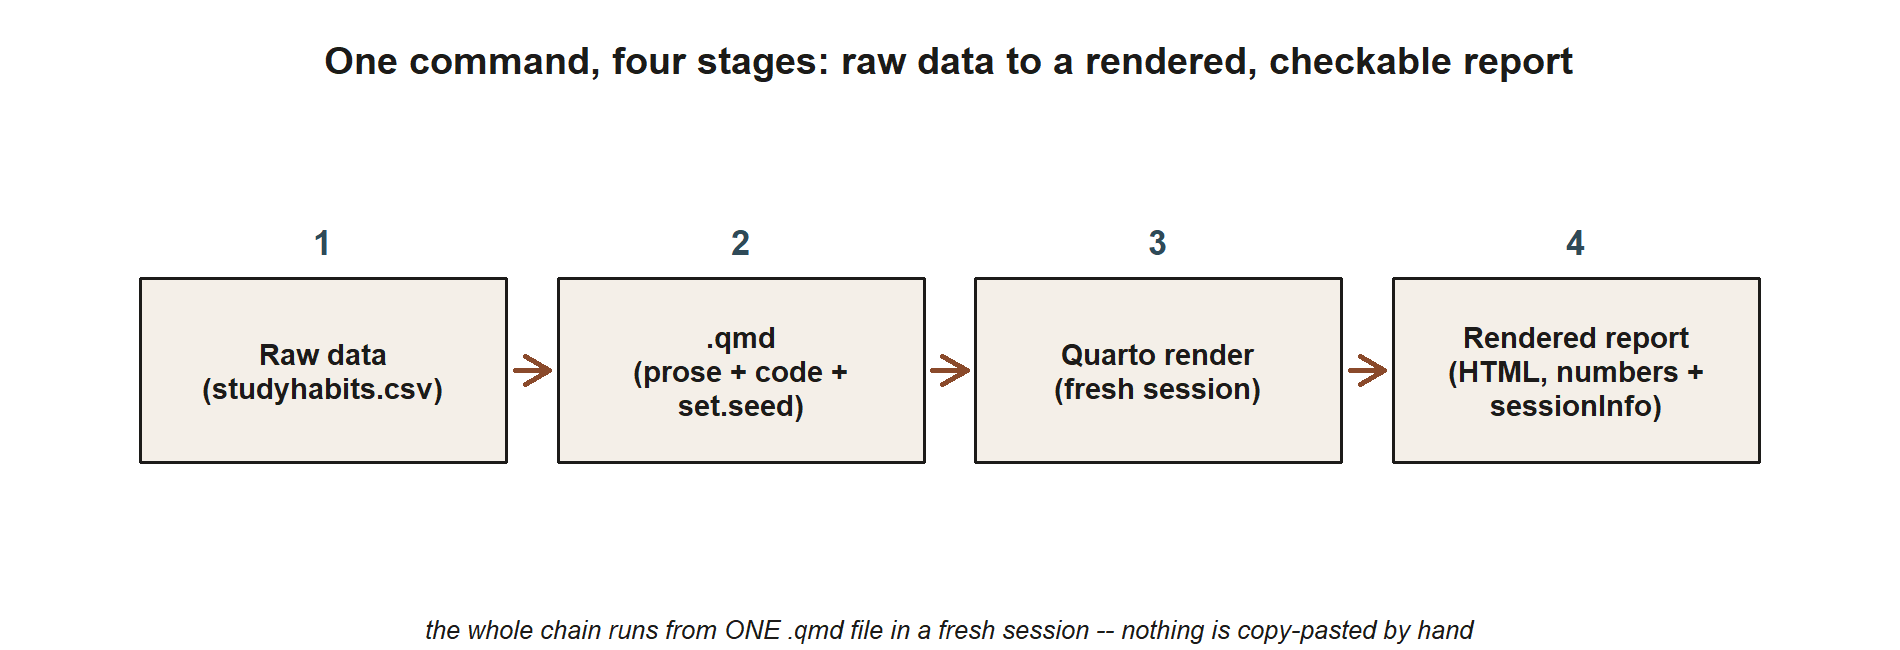
studyhabits.csv data flow into a single .qmd file (prose, code, and set.seed together), which Quarto renders in a fresh session, producing a rendered HTML report that carries both the numbers and a sessionInfo() record. Nothing is copy-pasted between any two stages — the whole chain runs from one file and one render command.
Setup and practice sequence
In this lab you will build one small Quarto report end to end: a .qmd file that loads the synthetic studyhabits data (synthetic; seed set), fits the two-predictor model final ~ study + prior_gpa, interprets the coefficients in prose, and records exactly what was run. Work through the steps in order; each one is a habit you will reuse on the project. Where it says your turn, stop reading and do it.
Create the file and its YAML header. In RStudio/Posit Cloud, make a new Quarto document and save it with a descriptive name such as
studyhabits-final-model.qmd— neveruntitled1.qmd. The file opens with a YAML header between two---fences that tells Quarto what kind of document to build:--- title: "Study habits and final exam scores" author: "Your Name" date: today format: html ---The
date: todayfield is a small reproducibility win — the rendered report stamps itself with the day it was built, so you can always tell which run a given PDF or HTML came from.Add a setup chunk that fixes the seed. The first code chunk loads packages and sets the random seed. Fixing the seed is what makes a stochastic step (a simulation, a train/test split, a bootstrap) reproducible — the same seed yields the same “random” draw every time. We use the course seed:
#| label: setup
#| message: false

library(tidyverse)
set.seed(33003)   # course seed — same draws on every run

studyhabits <- read_csv("studyhabits.csv")   # synthetic; n = 200; seed set
Even though loading a fixed CSV does not itself draw randomness, setting the seed at the top is a habit worth keeping — the moment you add a cross-validation split or a bootstrap CI, the seed is already in place and your report stays reproducible without a scramble. Your turn: create this chunk and confirm the data loads (200 rows, the columns from the codebook).
Add the fitting chunk. Fit the two-predictor model and print its summary. This is the analytical heart of the report:
#| label: fit-model

mod <- lm(final ~ study + prior_gpa, data = studyhabits)
summary(mod)
#> Coefficients:
#>             Estimate
#> (Intercept)    35.0
#> study           1.8
#> prior_gpa       8.0
#> Multiple R-squared: 0.51
The fitted model is \(\hat{y} = 35.0 + 1.8\,x_1 + 8.0\,x_2\), with \(x_1\) =
studyand \(x_2\) =prior_gpa. Read the numbers as claims: thestudyslope of \(1.8\) says that among students with the same incoming GPA, one more weekly study hour is associated with a \(1.8\)-point higher predicted final.Write prose that interprets the coefficients. This is the step that makes it a report and not a code dump, and it is where the modeling course lives. Below the fitting chunk, in plain text, explain what the model says — and connect it to what you learned in Week 6:
The adjusted
studyslope is \(1.8\), noticeably smaller than the crude slope of \(2.5\) from the one-predictor model. Holdingprior_gpaconstant pulls the apparent benefit of studying down, because stronger students both study more and score higher —prior_gpais a confounder. Theprior_gpacoefficient of \(8.0\) says that, holding study hours fixed, a one-point higher incoming GPA is associated with an \(8.0\)-point higher predicted final. The model explains about \(R^2 = 0.51\) of the variation in final scores.Your turn: write two or three sentences of your own interpretation in the report, naming at least one thing the model does not establish (for instance, that this is an observational association, not a proven causal effect of an intervention to study more).
Add a session-info chunk at the end. The last chunk records the computational environment, so a reader knows exactly which versions produced your numbers:
#| label: session-info

sessionInfo()
#> R version 4.4.x ...
#> attached base packages: ...
#> other attached packages: tidyverse_2.x ...
This is the difference between “it works on my machine” and a verifiable record. If your
tidyverseis a different version from a classmate’s and your numbers diverge, the session-info chunk is where you both look first.Render and read the output as a stranger would. Click Render (or run
quarto render studyhabits-final-model.qmd). Quarto executes every chunk top to bottom in a fresh session and produces a single HTML file. Your turn: open that HTML, read it as if you had never seen the code, and ask the credibility question — could someone with only this file and the CSV reproduce my \(1.8\)? If yes, the report is doing its job.
A subtle but important point: render from a clean session, not from the variables already sitting in your console. Code that runs interactively but fails on render almost always depends on something defined out of order — an object you made by hand and never wrote into a chunk. Rendering top-to-bottom in a fresh session is itself a reproducibility test, and it is one many analyses quietly fail the first time.
Reproducible-file convention
Adopt a small, boring, consistent convention and use it for every analysis. The boredom is the point: conventions free you from re-deciding, and they make a folder of analyses legible to anyone who opens it.
- One
.qmdper analysis. Each question gets its own self-contained report that runs from raw data to conclusion. Resist the giant do-everything script; one file, one argument. - A fixed seed (
set.seed(33003)) in the setup chunk. Set it once, near the top, before anything stochastic. The same seed gives the same draws, so your “random” split or bootstrap is reproducible. - A
sessionInfo()chunk at the end. Record R and package versions, so a reader can match your environment and so version-driven discrepancies are diagnosable rather than mysterious. - Descriptive file names.
studyhabits-final-model.qmd, notanalysis2_final_REAL_v3.qmd. A name that says what the file does is a one-line piece of documentation you get for free. - Render before you share. A report that has not been rendered from a clean session is an untested claim. Render it; if it builds, the chain from data to conclusion holds together.
Follow this convention and the whole folder becomes self-documenting: each file announces its purpose in its name, pins its randomness with a seed, and certifies its environment at the bottom. That is what a trustworthy analysis directory looks like.
Debugging
Two snags trip up almost everyone the first time they render a modeling report. Knowing the fix in advance saves an afternoon.
Snag 1 — “Quarto cannot find R” (or the render fails before any code runs). You click Render and get an error about R not being found, or the document never reaches your first chunk. This usually means Quarto and R are not connected: R or the rmarkdown package is not installed where Quarto looks, or you are rendering a .qmd outside RStudio without R on your PATH. The fix: render from inside RStudio/Posit Cloud (which wires R and Quarto together for you), make sure the rmarkdown package is installed (install.packages("rmarkdown")), and confirm at a terminal that quarto check reports a working R installation. Once Quarto can see R, the same .qmd that failed will render unchanged.
Snag 2 — a factor-level mismatch in predict(). You fit final ~ format, then ask the model to predict for a new student and get an error like “factor format has new level distance” or get silent NA predictions. The cause is that the new data contain a level the model never saw during fitting — the model learned coefficients for in_person, hybrid, and online, and has no slot for anything else (including a typo or a stray capitalization). The fix is to make the new data’s factor match the fitted model’s exactly:
new <- data.frame(format = factor("hybrid",
                                  levels = c("in_person", "hybrid", "online")))
predict(mod_format, newdata = new)
#> 75.0
With the levels declared to match the fitted model, the prediction returns the expected hybrid group mean of \(75.0\) rather than an error. The general lesson generalizes past this one bug: when prediction misbehaves on categorical predictors, check that the new data’s factor levels are the same set, spelled the same way as the data the model was fit on. A reproducible report makes this kind of bug easier to catch, because the data-loading and factor-setting steps are written down in the same file as the model.
AI Use Note
AI assistants can speed up the mechanical parts of building a report. They cannot certify that your model is right or your interpretation is honest — that judgment is yours, and it is the part this course grades you on. Use AI for scaffolding; verify every statistical claim against the actual fitted output.
| Tool | Purpose | Verification |
|---|---|---|
| ChatGPT / Claude | Draft a Quarto YAML header or explain a render error in plain language | Render the real .qmd yourself; confirm the document builds from a clean session |
| GitHub Copilot | Autocomplete boilerplate (library() calls, chunk options, a predict() skeleton) |
Read every suggested line; check the model formula matches your stated question |
| AI “explain this output” | Get a first-pass reading of a summary(mod) table |
Re-read the coefficients against bible §3; confirm the \(1.8\) slope and its interpretation are yours, not the model’s guess |
| AI prose polish | Tighten the wording of your interpretation paragraph | Make sure no number or causal claim was introduced that your model does not actually support |
The throughline: AI may draft the prose and the plumbing, but you must re-run the analysis and confirm the numbers. An unverified AI sentence that misstates your slope is exactly the kind of un-rerunnable claim this week warns against.
Reading and source pointer
Read ModernDive Chapter 11 — “Tell Your Story with Data”, which pulls the whole data-science workflow together into a reproducible report, and revisit ModernDive Chapter 1’s Quarto setup if your render environment needs attention. These notes are the course’s own synthesis, grounded in but not copied from the sources.
Public vs. graded
These notes, the examples, and the practice here are public and ungraded — study material only. No graded prompts, answer keys, rubrics, point values, or due dates appear on this site. Graded modeling checkpoints, labs, quizzes, homework/modeling memos, the midterm, the project, and the final live in Blackboard (the LMS), which is authoritative for due dates, submissions, and grades. If this page and Blackboard ever disagree, follow Blackboard.
Portfolio connection
The reproducible report you build this week is the template for your course portfolio and final project. Every analysis you submit should arrive as a rendered Quarto report that runs from raw data to conclusion — fixed seed in the setup chunk, lm()/glm() fit shown, coefficients interpreted in your own prose, and a sessionInfo() record at the end. A portfolio of clean, re-runnable .qmd reports is itself the evidence that your modeling claims are credible: a reader can open any one of them, render it, and watch your numbers appear. Build the habit now on the small studyhabits model, and the project becomes a matter of scaling a workflow you already trust rather than inventing one under deadline.
See also
- Week 6 — Multiple regression & adjustment — the
final ~ study + prior_gpamodel and the \(2.5 \to 1.8\) confounding story this report writes up. - Week 10 — Prediction & validation — where a fixed seed first earns its keep, in the cross-validation split.
- Week 15 — Final review & synthesis — the whole
studyhabitsthread pulled together. - Notation glossary and the modeling reference.