Week 10 — Prediction & validation
Why a better-fitting model can predict worse
The week question
Up to now we have asked our models to explain — to tell us how final relates to study, to prior_gpa, to format, and to say what those relationships mean once we hold other things constant. This week the job changes. We ask the model to predict: given a new student we have never seen, with their own study hours and GPA, what final exam score should we expect? The week question is deliberately uncomfortable:
Why can a model that fits the data we already have better predict worse on students we have not seen yet?
That sentence sounds like a contradiction, and the surprise in it is the whole point of the week. It is genuinely possible — routine, even — to add predictors to a regression, watch \(R^2\) climb and the residuals shrink, and yet end up with a model that is less trustworthy for the one thing prediction is for: a new case. Learning why that happens, and learning the small piece of machinery that protects you from it, is the modeling skill this week installs.
Why this matters
Almost every applied use of a model is, in the end, a prediction about a case the model has not seen. A campus advising office wants to flag students who may struggle before the final, not after. A clinic wants a risk score for the next patient. A lender wants to price a loan for an applicant who is not yet in the books. In every one of these settings, fit to the data you already have is not the prize — it is only a means. The prize is performance on the next case, and the next case is by definition absent from the data you fit on.
This matters because the most natural number to reach for — how well the model fits the training data, usually reported as \(R^2\) — systematically overstates how well the model will predict. The fit number is computed on the very rows the model was tuned to. A model can always be made to fit its own training data better by giving it more freedom: more predictors, more flexibility, more parameters to bend. Some of that extra fit is real signal it has finally captured. Some of it is the model memorizing the noise that happens to be in this sample. Training fit cannot tell those two apart, and that is exactly why it misleads. The discipline this week gives you a way to tell them apart honestly — by holding out data the model never gets to see during fitting, and judging it there.
Learning goals
By the end of this week you should be able to:
- Distinguish a model built to explain from a model built to predict, and say why the two goals can pull a modeling choice in opposite directions.
- Explain why training error is optimistic — why error measured on the data the model was fit to runs systematically lower than error on new data.
- Carry out and read a train/test split and cross-validation, and report an honest out-of-sample error such as a cross-validated RMSE.
- Recognize overfitting: a widening gap between training fit and validated performance, and connect it to the practice of adding predictors to chase fit.
- Judge a predictive model by its validated performance rather than its training \(R^2\), and explain that judgment to someone who only looked at \(R^2\).
Core vocabulary
- Prediction vs. explanation. Explanation asks what a coefficient means (how
finalchanges withstudy, adjusting for confounders). Prediction asks how close \(\hat{y}\) lands to a new \(y\). Different goals, sometimes different best models. - Training error / in-sample error. Error measured on the same rows used to fit the model. Optimistic by construction.
- Test (validation) error / out-of-sample error. Error measured on rows the model did not see while fitting. The honest estimate of predictive performance.
- RMSE (root mean squared error). \(\mathrm{RMSE} = \sqrt{\tfrac{1}{m}\sum_{i=1}^{m}(y_i - \hat y_i)^2}\), the typical size of a prediction miss, in the units of \(y\) (here, exam points).
- Train/test split. Randomly partition the data: fit on the training part, evaluate on the held-out test part.
- Cross-validation (CV). Rotate the held-out part through the data — fit and evaluate \(k\) times on \(k\) folds — and average. A more stable out-of-sample estimate than a single split.
- Overfitting. A model that has fit the noise in its training sample, so its training error drops while its out-of-sample error rises. The signature is a widening train-to-validation gap.
- Optimism gap. The difference between validated error and training error; small is reassuring, large is a warning.
Concept development
Explanation vs. prediction — two different jobs
Every model we have built so far was, quietly, an explanation model. When we read “the study slope is \(2.5\)” we were making a claim about a relationship, and we cared about getting that claim right and honest — hence the attention to confounding, adjustment, and the standard error of the coefficient. The coefficient meant something, and the meaning was the deliverable.
Prediction has a different deliverable. It does not need the coefficients to mean anything cleanly. It needs \(\hat{y}\) to land close to \(y\) for a student who was not in the data. A predictive model can use predictors that are tangled, redundant, or causally meaningless, as long as they carry information that improves the guess — and it will happily trade a clean interpretation for a smaller error. The two goals usually point the same way for a small, well-chosen model, but they can diverge. A predictor might be worth keeping for prediction (it nudges \(\hat{y}\) closer) while being worthless or misleading for explanation (its coefficient is just absorbing noise). Holding the goal explicitly in mind — am I explaining, or predicting? — keeps you from importing the wrong scorecard. This week the scorecard is out-of-sample error, full stop.
Training error is optimistic — the split and cross-validation
Here is the core mechanism, stated plainly. When you fit a regression by least squares, you choose the coefficients that make the residuals on these rows as small as possible. The fitting procedure is, almost by definition, leaning into the particular sample in front of it — including the parts of that sample that are just noise. So the error it reports on its own training rows is the smallest error it could manage there. On a fresh sample, the noise is different, the lucky alignments are gone, and the error is larger. Training error is therefore biased downward as an estimate of future error. It is not lying so much as flattering itself.
The fix is structural, not statistical cleverness: don’t let the model grade its own homework. Split the data. Fit the model on a training portion; then, without refitting, push the test portion through and measure how far \(\hat{y}\) lands from the held-out \(y\). Because those rows played no part in choosing the coefficients, the error there is an honest preview of the next student.
A single split wastes data and is noisy — your estimate depends on which rows happened to land in the test set. \(k\)-fold cross-validation smooths this out. Slice the data into \(k\) equal folds (ten is common). Hold out fold 1, fit on the other nine, score on fold 1; then hold out fold 2, refit, score; and so on, until every row has been a held-out test case exactly once. Average the \(k\) fold scores into one cross-validated RMSE. That CV-RMSE is the number this week trusts. Set the seed first (set.seed(33003)) so the random fold assignment is reproducible — same seed, same folds, same answer.
Overfitting — fitting the noise
Overfitting is what training-error optimism looks like when it gets out of hand. Give a model more freedom — more predictors, higher-order terms, more flexibility — and its training fit will keep improving, because there is always some twist of the coefficients that shaves another residual on these specific rows. But past a point, the extra fit is bought entirely by bending the model around noise that will not repeat. The training \(R^2\) rises; the validated error rises too. The model has memorized this sample instead of learning the pattern that generalizes.
The diagnostic is a comparison, not a single number. Watch the gap between training error and validated error as the model grows. A small gap (validated error only a little above training error) says the model is mostly learning signal. A gap that yawns open — training error sinking while CV-RMSE climbs — is the unmistakable fingerprint of overfitting. This reframes a temptation you will feel constantly: adding a predictor almost always improves training fit, so training fit can never tell you when to stop. Only the validated number can. That is why the parsimony instinct — prefer the simpler model unless a more complex one validates better — is not aesthetic fussiness; it is the operational defense against overfitting.
Worked examples
Worked example — studyhabits: a small model vs. a kitchen-sink model
We return to the recurring studyhabits dataset (synthetic; seed set; \(n = 200\) students in one intro course; set.seed(33003)). We compare two candidates for predicting final. The first is the modest two-predictor model we already trust for explanation, final ~ study + prior_gpa. The second is a twelve-predictor “kitchen-sink” model that throws in every variable and several of their interactions, in the hope that more inputs means better predictions.
First, fit both and read their training numbers — the flattering ones:
set.seed(33003)

# the modest, two-predictor model
m_small <- lm(final ~ study + prior_gpa, data = studyhabits)
#> training R^2 = 0.51, training RMSE = 8.8

# the 12-predictor "kitchen-sink" model (every variable + interactions)
m_big <- lm(final ~ study * prior_gpa * attend * format + works, data = studyhabits)
#> training R^2 = 0.72, training RMSE = 6.9
On training fit alone, the kitchen-sink model looks like the clear winner: \(R^2\) jumps from \(0.51\) to \(0.72\) and the typical training miss shrinks from \(8.8\) to \(6.9\) exam points. If \(R^2\) were the scorecard, you would ship m_big and move on. That is exactly the trap. These numbers were computed on the same \(200\) rows each model was tuned to, so they cannot tell us which model predicts. For that we need out-of-sample error.
Now hold out data the models never see during fitting. We use one explicit train/test split to make the idea concrete, then the cross-validated number for the honest estimate:
set.seed(33003)
n <- nrow(studyhabits)
train_id <- sample(seq_len(n), size = 0.8 * n)        # 80% to train
train <- studyhabits[train_id, ]
test  <- studyhabits[-train_id, ]                     # 20% held out

fit <- lm(final ~ study + prior_gpa, data = train)
pred <- predict(fit, newdata = test)                  # score on UNSEEN rows
rmse <- sqrt(mean((test$final - pred)^2))
#> held-out RMSE for the 2-predictor model ≈ 9.3

# 10-fold cross-validated RMSE for each model (averaged over folds)
#> m_small  (final ~ study + prior_gpa):   CV-RMSE ≈ 9.3
#> m_big    (12-predictor kitchen-sink):   CV-RMSE ≈ 11.0
Putting the training and cross-validated numbers for both models side by side makes the inversion easy to see at a glance:
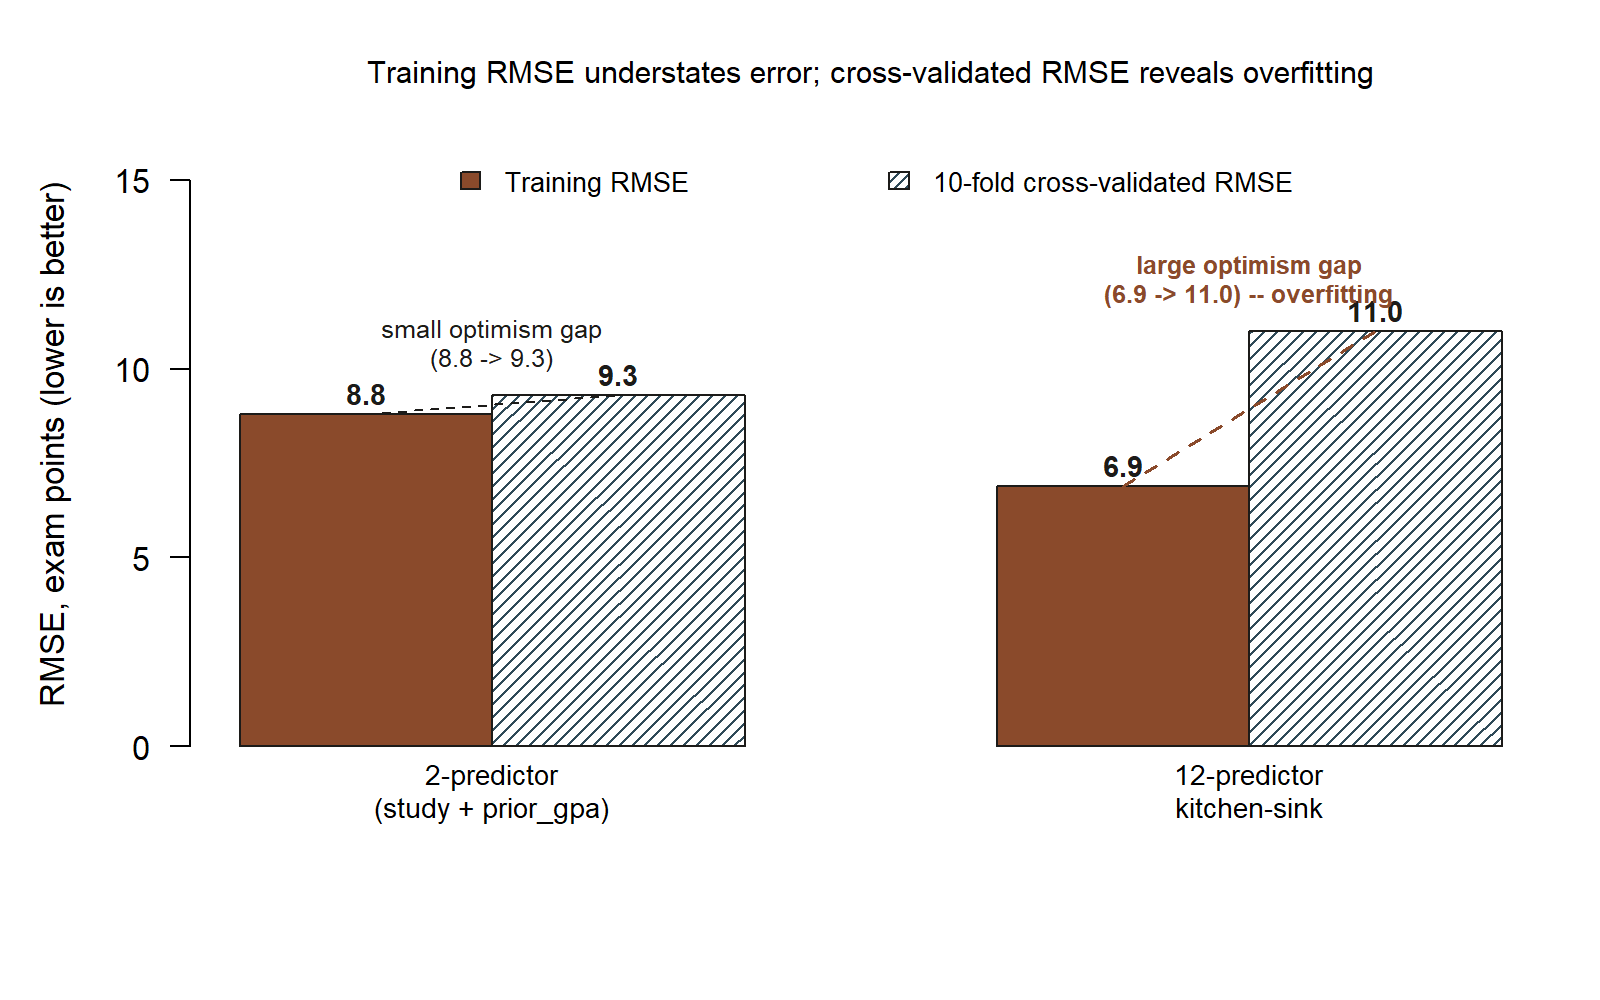
final ~ study + prior_gpa) and the 12-predictor kitchen-sink model. The 2-predictor model’s bars are nearly level (8.8 vs. 9.3 — a small optimism gap); the kitchen-sink model’s training bar is lower (6.9) but its cross-validated bar is the tallest of the four (11.0) — a large optimism gap that flags overfitting. (synthetic; seed set)
Read these against the training numbers and the whole story inverts. The two-predictor model trained at \(\mathrm{RMSE} = 8.8\) and validates at \(\approx 9.3\) — an optimism gap of only about half a point. That small gap is reassuring: almost everything m_small learned on the training rows carries over to new students. The kitchen-sink model trained at a gleaming \(\mathrm{RMSE} = 6.9\) (\(R^2 = 0.72\)) but validates at \(\approx 11.0\). Its gap is enormous — and, decisively, its validated error is worse than the simple model’s. On the data it had already seen, m_big looked nearly two points more accurate; on students it had not seen, it is nearly two points less accurate.
That is the week’s question answered in numbers. The better-fitting model predicts worse because most of its extra training fit was noise — coefficients bent around accidents of these particular \(200\) rows that do not recur. The validated comparison, not the training comparison, is the one that tells the truth, and it sends us back to the modest model. Whenever we report a predictive RMSE in this course, we mean the validated one; the training RMSE is shown only to expose the optimism gap, never as the verdict.
Worked example — transfer: memorizing the practice test
Take the model machinery out of it for a moment. Picture two students preparing for the same final. Dana studies the concepts — works varied problems, learns why each method applies. Riley gets hold of last year’s practice test and memorizes it: every question, every numeric answer, in order.
Quiz each on the practice test and Riley wins in a landslide — a perfect score, because Riley has effectively fit the noise of that one specific test, down to the last digit. Dana scores well but not perfectly. The practice test is the training set, and Riley’s perfect score is training error of zero: dazzling, and almost meaningless. The real final is the test set — new questions drawn from the same material. There, Riley’s memorized answers are useless because the specific items changed, while Dana’s grasp of the underlying pattern transfers. Dana predicts the unseen exam better despite “fitting” the practice test worse.
That is overfitting in one sentence: Riley fit the practice test; Dana learned the material. The kitchen-sink model is Riley. The CV-RMSE is the real final — the only score that was ever going to count. And the moral is the same in both worlds: judge a model by how it does on what it has not seen, because flawless performance on what it has seen can mean it learned the pattern or merely memorized the answers, and only held-out data can tell those apart.
A common mistake
The signature mistake of this week is judging a predictive model by its training \(R^2\) — and then adding predictors to chase that number. It feels like progress: every variable you toss in nudges \(R^2\) up and the training RMSE down, so the model seems to be getting steadily better. It is a one-way ratchet, and that is precisely the problem — training fit can only improve when you add predictors, so it can never warn you that you have gone too far. By the logic of this week, the kitchen-sink model “wins” on training \(R^2\) (\(0.72\) vs. \(0.51\)) while losing badly out of sample (CV-RMSE \(11.0\) vs. \(9.3\)). Someone who only looked at \(R^2\) would ship the worse predictor with full confidence.
The fix is a habit, not a formula: before you trust a predictive model, validate it on data it did not see, and let the validated number — not the training fit — settle the comparison. When you are tempted to add a predictor “because it bumps \(R^2\),” ask the only question that matters for prediction: does it lower the cross-validated error? If not, it is decoration, and decoration on a predictive model is just memorized noise waiting to hurt you on the next student. (Note the contrast with our explanation weeks: there we added prior_gpa because it changed the meaning of the study slope and addressed confounding — a sound reason that has nothing to do with chasing fit. Different goal, different justification.)
Low-stakes self-checks (ungraded)
These are ungraded self-checks — no points, nothing to submit. Use them to test whether the idea has landed.
- In your own words, why is training RMSE almost always smaller than cross-validated RMSE for the same model? Which one would you report to someone deciding whether to use the model on a new student?
- The two-predictor model has training RMSE \(8.8\) and CV-RMSE \(9.3\); the kitchen-sink model has training RMSE \(6.9\) and CV-RMSE \(11.0\). Which model has the larger optimism gap, and what does that gap tell you about overfitting?
- A classmate says, “My new model has a higher \(R^2\), so it’s the better predictor.” Name the one number you would ask to see before you agree, and say why.
- Explain the memorizing-the-practice-test analogy to a friend who has never taken statistics. Which part of the analogy is the training set, which is the test set, and which is overfitting?
- You add a thirteenth predictor and the training \(R^2\) ticks up from \(0.72\) to \(0.73\). What single piece of evidence would convince you the predictor is worth keeping — and what would convince you it is just noise?
Reading and source pointer
For this week’s reading, see ModernDive Chapter 5 (basic regression — fitting and reading a model and its predicted values) together with ModernDive Chapter 6 (multiple regression — adding predictors), where the mechanics of predict() and the idea of using a model on new cases are developed in the tidyverse workflow. The train/test and cross-validation framing builds directly on those chapters: once you can fit a model and generate \(\hat{y}\), holding out rows to score those predictions honestly is the natural next step.
These notes are the course’s own synthesis, grounded in but not copied from the sources.
Public vs. graded
These notes, the examples, and the practice here are public and ungraded — study material only. No graded prompts, answer keys, rubrics, point values, or due dates appear on this site. Graded modeling checkpoints, labs, quizzes, homework/modeling memos, the midterm, the project, and the final live in Blackboard (the LMS), which is authoritative for due dates, submissions, and grades. If this page and Blackboard ever disagree, follow Blackboard.
Looking ahead
Next week we change the response itself: instead of predicting a numeric exam score, we predict a yes/no outcome — whether a student passed — with logistic regression, where the same prediction-versus-fit discipline returns in the language of odds and probabilities.