Week 11 — Logistic regression
Modeling the probability of a binary outcome
The week question
Every response we have modeled so far has been a number on a continuous scale: final, the exam score, running from 0 to 100. Least-squares regression was built for exactly that — a numeric outcome, a straight line, a residual you can measure in points. This week the response changes shape. Instead of how many points a student scored, we ask whether the student passed — a yes/no, a 1 or a 0, with nothing in between. The machinery that served us for final does not transfer cleanly, and the heart of the week is understanding why and what replaces it. The week question is:
How do we model the probability of a binary outcome like passing, and what does the slope of such a model — an odds ratio — actually mean?
The honest answer is that we stop modeling the 0/1 outcome directly and instead model the probability that the outcome is a 1, then run that probability through a transformation that keeps it between 0 and 1 no matter what the predictors do. The price of that transformation is that the slope no longer reads as “points per hour.” It reads as a change in log-odds, and exponentiating it gives an odds ratio. Learning to fit that model, and — far more important — learning to interpret its coefficient honestly, is the modeling skill this week installs.
Why this matters
Binary outcomes are everywhere a decision is, because most decisions are themselves yes/no. Will this student pass or not? Will this loan default or not? Will this patient be readmitted within 30 days, this email be spam, this transaction be fraud, this customer renew? In each case the thing we want to model is not a quantity but an event, and the natural target is its probability. A campus advising office does not want a predicted exam score so much as a predicted chance of failing — a number between 0 and 1 it can act on, flagging the students whose probability has dropped low enough to warrant outreach.
This matters because reaching for ordinary linear regression on a 0/1 outcome is both tempting and wrong, and the way it goes wrong is instructive rather than merely technical. A straight line is unbounded — extend it far enough in either direction and it sails past 1 and below 0, predicting probabilities that cannot exist. That is not a rounding nuisance; it is a sign the model has the wrong shape for the question. Logistic regression fixes the shape. It also, unavoidably, changes how the slope reads — and the single most common error with these models, the one this week works hardest to prevent, is reading that slope as if it were still a probability change instead of a log-odds change. Getting the interpretation right is what separates a number you can communicate from a number you will misreport.
Learning goals
By the end of this week you should be able to:
- Explain why a straight line fails for a 0/1 outcome — concretely, why fitting
lm()to a binary response predicts probabilities outside the legal range \([0, 1]\) and assumes the wrong error structure. - Describe the logistic (S-shaped) curve and the idea of modeling the probability through the log-odds, so that fitted probabilities are bounded between 0 and 1.
- Fit a logistic regression with
glm(..., family = binomial), and read its coefficients on the log-odds scale. - Convert a logistic coefficient into an odds ratio with
exp(), and state in a sentence what that odds ratio means for a one-unit change in the predictor. - Turn a fitted log-odds into a predicted probability, and locate the predictor value where the predicted probability crosses \(0.5\).
- Avoid the signature mistake: never read a logistic coefficient as a change in probability — it is a change in log-odds, and its effect on probability depends on where you are on the curve.
Core vocabulary
- Binary outcome. A response that takes one of two values, coded \(1\) (“success” / event happens) or \(0\). Here,
passed— whetherfinal >= 70. - Probability, \(p\). The chance the outcome is a \(1\), between \(0\) and \(1\). The thing logistic regression actually models, as a function of the predictors: \(p = P(\text{passed} = 1 \mid x)\).
- Odds. A re-expression of a probability: \(\text{odds} = \dfrac{p}{1 - p}\). A probability of \(0.5\) is odds of \(1\) (even); \(p = 0.8\) is odds of \(4\) (“4 to 1 on”). Odds run from \(0\) to \(\infty\).
- Log-odds (logit). The natural log of the odds, \(\operatorname{logit}(p) = \log\!\big(\tfrac{p}{1-p}\big)\). This runs over all real numbers, \(-\infty\) to \(+\infty\), which is exactly why a straight line can live on it safely.
- Logistic regression. A model that makes the log-odds a linear function of the predictors: \(\operatorname{logit}(p) = \beta_0 + \beta_1 x\). Fit with
glm(family = binomial). - Odds ratio (OR). \(e^{\beta_1}\) — the multiplicative factor by which the odds change for a one-unit increase in \(x\). \(\mathrm{OR} > 1\) raises the odds, \(\mathrm{OR} < 1\) lowers them, \(\mathrm{OR} = 1\) means no association.
- Predicted probability. The model’s \(\hat{p}\) for a given \(x\), recovered by inverting the logit: \(\hat p = \dfrac{1}{1 + e^{-(\beta_0 + \beta_1 x)}}\).
- Logistic (sigmoid) curve. The S-shaped graph of \(\hat p\) against \(x\) — flat near \(0\), flat near \(1\), and steepest in the middle.
Concept development
Why a straight line fails for a 0/1 outcome
Start by trying the tool we already have and watching it break, because the failure tells us exactly what the replacement must fix. Suppose we coded passed as \(1\) for pass and \(0\) for fail and simply ran ordinary linear regression, lm(passed ~ study). The fitted line would be \(\hat{y} = b_0 + b_1\,x\), and we would interpret \(\hat{y}\) as the predicted probability of passing — which is a reasonable instinct, since the average of a bunch of 0s and 1s is a proportion. The trouble is the shape of a line. A line has no ceiling and no floor: push study high enough and \(\hat{y}\) climbs past \(1\); push it low enough and \(\hat{y}\) drops below \(0\). A predicted probability of \(1.3\), or of \(-0.2\), is not a small error — it is a statement that cannot be true. The model has the wrong range.
The problems do not stop at the range. A line assumes the response varies around its mean by a constant amount (the constant-variance assumption behind the residual standard error \(s\)). A 0/1 outcome cannot do that — its variability is largest where \(p\) is near \(0.5\) and shrinks to nothing as \(p\) approaches \(0\) or \(1\), because a near-certain outcome barely varies. So the straight-line model is wrong about the spread as well as the range. And a line is additive on the probability scale: it claims each extra study hour adds the same fixed amount of probability. But near the extremes that cannot hold either — a student already at \(0.97\) has almost no room to gain, while a student at \(0.50\) has plenty. The honest conclusion is that probability is not a quantity that behaves linearly, and forcing a line onto it misrepresents the range, the spread, and the way the effect changes across the curve. We need a model whose very shape respects “this is a probability.”
Modeling the probability through the log-odds — the logistic curve
The fix is elegant once you see it: do not model the probability on a line directly — model a transformed version of it that is free to roam over all real numbers, fit the line there, and transform back. The transformation is the logit, the log of the odds:
\[ \operatorname{logit}(p) = \log\!\left(\frac{p}{1 - p}\right). \]
Watch what this does to the boundaries. As \(p \to 0\), the odds \(\tfrac{p}{1-p} \to 0\) and its log \(\to -\infty\). As \(p \to 1\), the odds \(\to \infty\) and its log \(\to +\infty\). At \(p = 0.5\) the odds are exactly \(1\) and the log-odds are exactly \(0\). So the logit stretches the cramped interval \([0, 1]\) out across the entire real line — and a straight line, which also lives on the entire real line, now fits without ever threatening to leave the legal range. The logistic model puts the line on the log-odds scale:
\[ \operatorname{logit}(p) = \beta_0 + \beta_1 x. \]
To get back a probability we invert the logit, which gives the logistic (sigmoid) function:
\[ \hat p = \frac{1}{1 + e^{-(\beta_0 + \beta_1 x)}}. \]
No matter what \(\beta_0\), \(\beta_1\), and \(x\) are, this expression is trapped strictly between \(0\) and \(1\) — the range problem is solved by construction. Plotted against \(x\), \(\hat p\) traces the famous S-curve: it hugs \(0\) for small \(x\), hugs \(1\) for large \(x\), and rises through its steepest stretch in the middle, passing through \(\hat p = 0.5\) at the point where the log-odds equal \(0\), i.e. where \(\beta_0 + \beta_1 x = 0\). (A picture of this curve for our fitted model is planned for the course visuals.) The S-shape is not decoration — it is the answer to every objection from the previous section. The flattening near \(0\) and \(1\) keeps probabilities legal and encodes “diminishing room to move” at the extremes; the steepness in the middle is where a study hour buys the most probability. The model’s geometry finally matches the outcome’s nature.
Odds, the odds ratio, and predicted probabilities
The line lives on the log-odds scale, so its slope \(\beta_1\) is a change in log-odds per one-unit change in \(x\) — not a change in probability, and not a change in odds. Log-odds are hard to feel intuitively, so we move one step toward something interpretable by exponentiating. Because \(\log\) turns multiplication into addition, adding \(\beta_1\) to the log-odds is the same as multiplying the odds by \(e^{\beta_1}\). That multiplier is the odds ratio:
\[ \mathrm{OR} = e^{\beta_1}. \]
Read it as a multiplicative effect on the odds: for every one-unit increase in \(x\), the odds of the event get multiplied by \(\mathrm{OR}\). If \(\mathrm{OR} = 1.42\), each extra unit of \(x\) raises the odds by a factor of \(1.42\) — a \(42\%\) increase in the odds (not the probability). An \(\mathrm{OR}\) above \(1\) means the predictor helps the event; below \(1\) means it hurts; exactly \(1\) means no association. Crucially, the odds ratio is constant across the whole curve — that is the one thing about a logistic model that is simple and constant — whereas the change in probability for a one-unit move is not constant: it is large in the steep middle of the S and small out at the flat tails. This is the single fact that the whole week turns on, and the next two sections will hold you to it.
To recover an actual probability at a given \(x\), plug the fitted log-odds into the logistic function. And to find where the model tips from “more likely to fail” to “more likely to pass,” set \(\hat p = 0.5\), which happens exactly where the log-odds are \(0\): solve \(\beta_0 + \beta_1 x = 0\) to get the crossover \(x = -\beta_0 / \beta_1\). That crossover point is often the most communicable single number a logistic model produces — the threshold of the predictor at which the event becomes more likely than not.
Worked examples
Worked example — studyhabits: modeling the probability of passing
We return to the recurring studyhabits dataset (synthetic; seed set; \(n = 200\) students in one intro course; set.seed(33003)). The response this week is the logical variable passed, which is TRUE when a student’s final reaches \(70\) and FALSE otherwise. We model the probability of passing from weekly study hours, study, with a logistic regression.
set.seed(33003)

# logistic regression: model the probability that passed == TRUE
fit <- glm(passed ~ study, family = binomial, data = studyhabits)
coef(fit)
#> (Intercept)       study
#>       -2.00        0.35     # these are on the LOG-ODDS scale

# turn the coefficients into odds ratios
exp(coef(fit))
#> (Intercept)       study
#>        0.14        1.42     # OR = 1.42 per extra study hour
Picture the fitted model before working through the numbers by hand — it is the S-curve below.
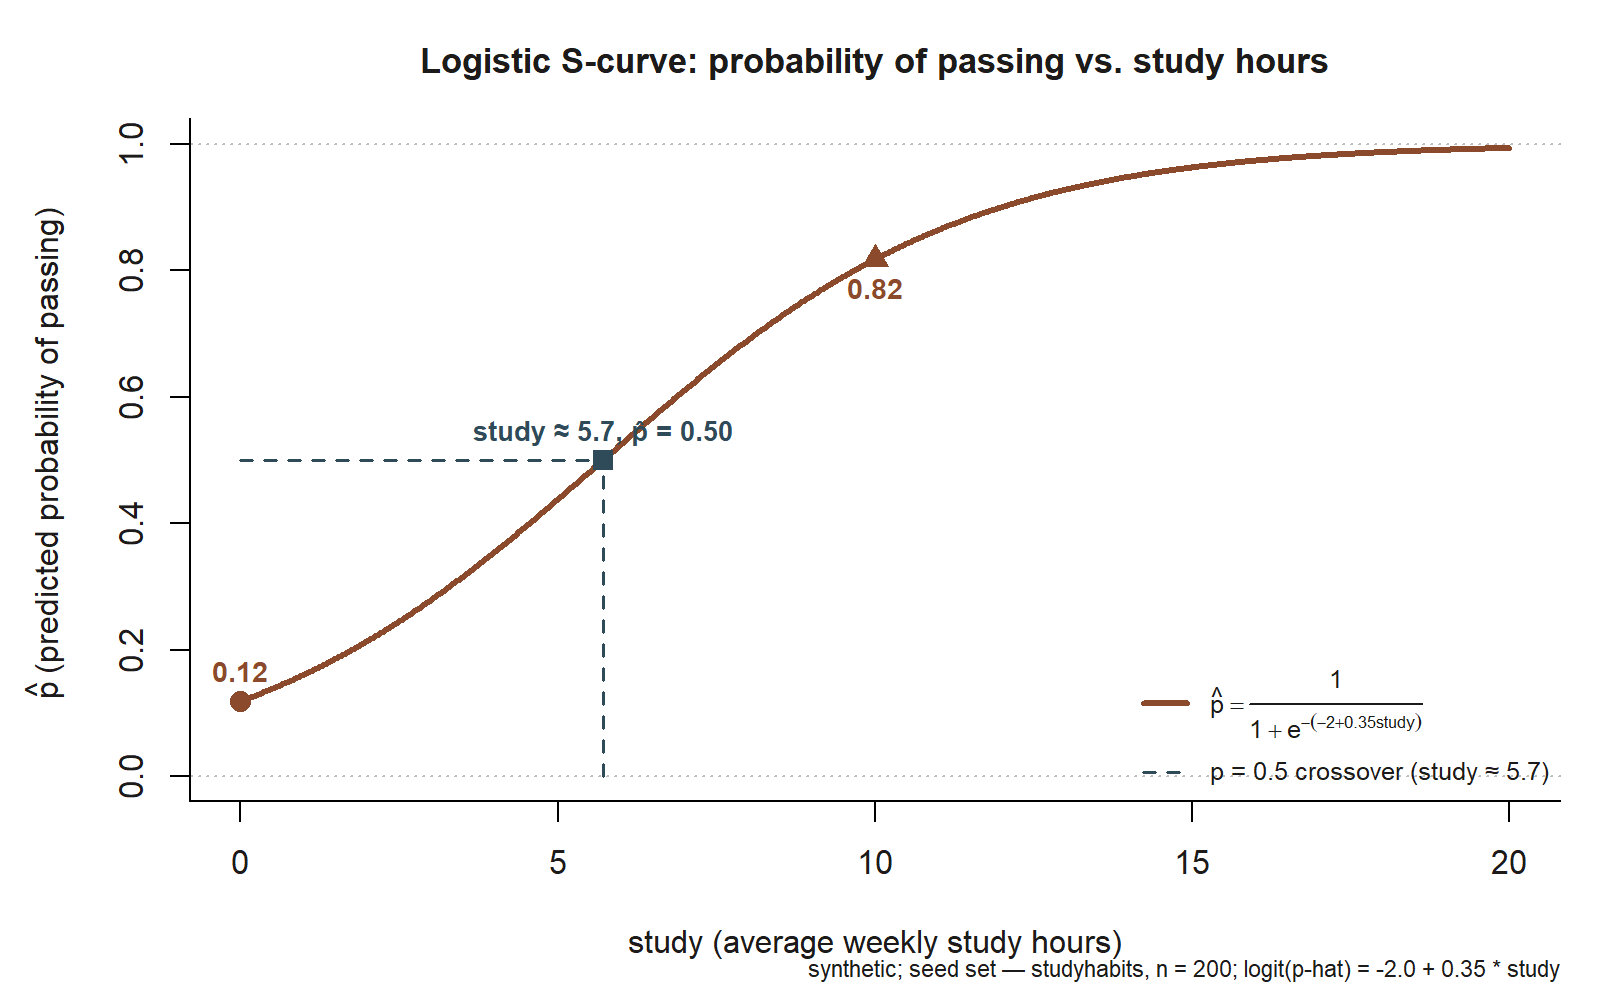
studyhabits; synthetic, seed set). The curve starts near \(\hat p \approx 0.12\) at study \(=0\) (circle marker), crosses \(\hat p = 0.5\) near study \(\approx 5.7\) (square marker, dashed guide lines), and reaches \(\hat p \approx 0.82\) at study \(=10\) (triangle marker). Dotted horizontal guides at \(p=0\) and \(p=1\) show the curve approaching but never touching either boundary.
The fitted model, on the log-odds scale, is
\[ \operatorname{logit}(\hat p) = -2.0 + 0.35\,\text{study}. \]
Read the slope first, and read it correctly. The coefficient on study is \(0.35\) log-odds per weekly study hour — not a probability and not a percentage. Exponentiating gives the interpretable quantity: \(e^{0.35} \approx 1.42\), the odds ratio. So each additional weekly study hour is associated with the odds of passing being multiplied by about \(1.42\) — roughly a \(42\%\) increase in the odds of passing per hour, holding nothing else in this one-predictor model. Notice what we did not say: we did not say “passing goes up \(42\%\)” or “\(0.35\) more probability of passing.” Those would be category errors; the \(42\%\) lives on the odds scale and the \(0.35\) on the log-odds scale.
Now turn the model into probabilities, which is what an advising office actually wants. At study \(= 0\), the log-odds are \(-2.0 + 0.35(0) = -2.0\), so
\[ \hat p = \frac{1}{1 + e^{2.0}} \approx 0.12. \]
A student who studies essentially nothing has about a \(12\%\) predicted probability of passing — low, as you would expect, and (note) an extrapolation to the edge of the data, so treat it cautiously. At study \(= 10\), the log-odds are \(-2.0 + 0.35(10) = 1.5\), so
\[ \hat p = \frac{1}{1 + e^{-1.5}} \approx 0.82. \]
A student studying ten hours a week has about an \(82\%\) predicted probability of passing. The contrast between \(0.12\) and \(0.82\) across the realistic span of study is the whole substance of the model — and it lands inside \([0, 1]\) at both ends, which a straight line would not have guaranteed.
Finally, the crossover. The predicted probability hits \(0.5\) where the log-odds are \(0\):
\[ -2.0 + 0.35\,\text{study} = 0 \quad\Longrightarrow\quad \text{study} = \frac{2.0}{0.35} \approx 5.7. \]
So the model says passing becomes more likely than not at about \(5.7\) weekly study hours — a single, concrete, communicable threshold. Below roughly \(5.7\) hours a student is predicted more likely to fail than pass; above it, more likely to pass than fail. That number, \(5.7\), is the kind of output you can hand to a non-statistician and have it mean something — far more so than “the log-odds slope is \(0.35\).” The model criticism move to keep in view: \(\hat p = 0.12\) at study \(= 0\) sits at the low edge of the data and is the least trustworthy point on the curve, so report it as a model extrapolation, not a measured fact.
Worked example — transfer: predicting loan default from income
Move the same machinery to a new context to see that it travels. A small lender wants to model the probability that a borrower defaults on a loan (the binary event, coded \(1\) for default) from the borrower’s annual income, measured in tens of thousands of dollars. The setup is identical — a yes/no outcome, a single numeric predictor — so logistic regression is again the right shape, and a straight line would again be wrong: a linear model could predict a \(-15\%\) or \(112\%\) chance of default, neither of which exists.
# same machinery, new context: probability of default from income
fit_loan <- glm(default ~ income, family = binomial, data = loans)
exp(coef(fit_loan))
#> (Intercept)      income
#>        ....        0.70     # OR = 0.70 per extra $10k of income (illustrative)
Suppose the fitted odds ratio for income comes out to about \(0.70\). Because it is below \(1\), more income is associated with lower odds of default: each extra \(\$10{,}000\) of annual income multiplies the odds of defaulting by about \(0.70\), a roughly \(30\%\) reduction in the odds per \(\$10{,}000\). The interpretive discipline is exactly the same as in studyhabits, and so are the traps: the \(0.70\) is an effect on odds, not a flat “\(30\%\) lower probability.” Whether a \(\$10{,}000\) raise moves a particular borrower’s probability of default a lot or a little depends on where that borrower sits on the S-curve — a borrower already near-certain to repay has little probability left to lose, while a borrower in the steep middle of the curve sees the biggest probability swing from the same raise. The constant thing is the odds ratio; the probability change is local. That is the portable lesson: same model, same exp(coef()) move, same warning never to read the coefficient as a probability.
A common mistake
The signature mistake of this week is reading a logistic coefficient as a change in probability — saying, of our model, “each study hour raises the probability of passing by \(0.35\),” or “by \(35\%\).” Both are wrong, and they are wrong in a way that quietly corrupts every downstream claim. The \(0.35\) is a change in log-odds. Exponentiated, \(e^{0.35} \approx 1.42\) is a change in odds — a \(42\%\) increase in the odds, which is not a \(42\%\) increase in the probability. The change in probability from one more study hour is not a single number at all: it depends on where you are on the curve. Near the steep middle (around study \(\approx 5.7\), where \(\hat p \approx 0.5\)) an extra hour moves the probability a lot; out in the flat tails (a student already at \(\hat p \approx 0.95\)) the same hour barely moves it. A coefficient that “means” a fixed probability change everywhere is precisely the linear-model thinking that logistic regression was built to escape.
A close cousin of this mistake is the one from the first concept section: using a straight line for a binary outcome in the first place — running lm(passed ~ study), reading \(\hat{y}\) as a probability, and shipping a model that can predict \(1.3\) or \(-0.2\). The fix for both is the same discipline. State the scale you are on before you state the number: the raw coefficient is log-odds, its exponential is an odds ratio (a multiplicative effect on odds), and a probability is something you compute for a specific \(x\) by running the log-odds through the logistic function. Keep those three scales separate and labeled, and the interpretation stays honest; blur them and the report becomes false in a way that sounds perfectly fluent.
Low-stakes self-checks (ungraded)
These are ungraded self-checks — no points, nothing to submit. Use them to test whether the idea has landed.
- In one or two sentences, explain why ordinary linear regression is the wrong model for a \(0/1\) outcome like
passed. Name at least two distinct things a straight line gets wrong. - Our model is \(\operatorname{logit}(\hat p) = -2.0 + 0.35\,\text{study}\). A classmate writes, “so each study hour adds \(0.35\) to the probability of passing.” Correct them: what scale is \(0.35\) on, and what is the right one-sentence interpretation?
- Compute the odds ratio for
studyfrom the slope \(0.35\), and state in plain words what it means for the odds of passing per extra weekly hour. - Using \(\operatorname{logit}(\hat p) = -2.0 + 0.35\,\text{study}\), find the predicted probability of passing at
study\(= 10\). (You should land near \(0.82\).) Then explain why the same one-hour increase changes the probability more atstudy\(= 5\) than atstudy\(= 14\). - Show that the predicted probability crosses \(0.5\) near
study\(\approx 5.7\), and say in one sentence what that crossover means for a student deciding how much to study.
Reading and source pointer
For this week’s reading, see Beyond Multiple Linear Regression (Roback & Legler), Chapter 6 — Logistic Regression, which develops the binary-response model, the logit link, odds and odds ratios, and the glm(family = binomial) workflow in depth; pair it with ModernDive Chapter 5 — Basic Regression for the underlying regression mechanics (fitting a model, reading coefficients, generating predicted values) that logistic regression generalizes. Read ModernDive Chapter 5 first to keep the regression scaffolding fresh, then Beyond MLR Chapter 6 for the move from a numeric response and a straight line to a binary response and an S-curve on the log-odds scale.
These notes are the course’s own synthesis, grounded in but not copied from the sources.
Public vs. graded
These notes, the examples, and the practice here are public and ungraded — study material only. No graded prompts, answer keys, rubrics, point values, or due dates appear on this site. Graded modeling checkpoints, labs, quizzes, homework/modeling memos, the midterm, the project, and the final live in Blackboard (the LMS), which is authoritative for due dates, submissions, and grades. If this page and Blackboard ever disagree, follow Blackboard.
Looking ahead
Next week we step back from any single model and ask how to choose among competing models — comparing candidate regressions with adjusted \(R^2\) and AIC, weighing fit against parsimony, and learning why the model that explains the most is rarely the one with the most predictors.