Week 13 — ANOVA, regression & broader modeling ideas
Why a one-way ANOVA is a regression with a categorical predictor
The week question
Why is a one-way ANOVA just a regression with a categorical predictor? You have spent the term fitting lm() models and reading coefficients, and somewhere along the way — in a prior course, in a textbook chapter, in a lab report — you have probably met “ANOVA” as if it were a separate machine: a different button, a different table, an \(F\)-test instead of \(t\)-tests, a ritual reserved for comparing several group means. This week dismantles that wall. The claim is precise and, once you see it, hard to unsee: the one-way analysis of variance of final across the three section formats is the very same model as the regression final ~ format you already fit in Week 8. Same fitted group means, same residuals, same total variation split into the same two pieces, and — the punchline — the same overall \(F\)-statistic to four decimal places. ANOVA is not a rival to regression. It is regression wearing a different vocabulary, asking its question — “do the group means differ by more than noise?” — through the same fitted model. The week’s job is to make that identity concrete, so that when you meet ANOVA in the wild you reach for what you already understand instead of memorizing a parallel procedure.
Why this matters
The practical payoff is consolidation. Statistics, as it is often taught, fragments into a bestiary of named tests — the two-sample \(t\)-test, one-way ANOVA, simple regression, multiple regression, the chi-square here and the correlation test there — each with its own assumptions to recite and its own output to decode. That fragmentation is exhausting and, worse, it hides the structure. When you learn that ANOVA is a regression and that a two-sample \(t\)-test is a regression with a single indicator, the bestiary collapses toward a single animal. You stop asking “which test do I run?” and start asking the better question: “what model describes how these variables relate, and what comparison falls out of it?” That shift — from a menu of tests to a family of models — is the central intellectual move of a modeling course, and this is the week it pays off most visibly.
There is a second, larger payoff that points past the linear world entirely. If a categorical predictor, a numeric predictor, and a two-group comparison all live inside one linear-model framework, a natural question is how far the framework stretches. The answer, which we treat at the concept level this week, is that linear regression, ANOVA, and the logistic regression of Week 11 are all special cases of a single generalized family — the generalized linear model. The same skeleton (a linear predictor built from your variables, a way of connecting that predictor to the response, a principled fit) describes a continuous exam score and a binary pass/fail outcome alike. You will not derive that machinery here, but seeing its outline reframes the whole term: the models you have fit are not a scattered collection but points on one map. Knowing the map is what lets a modeler move confidently into territory — counts, proportions, rates — the course did not have time to visit.
Learning goals
By the end of this week you should be able to:
- State the question a one-way ANOVA asks about a set of group means, and write it as a comparison of a “groups differ” model against a “common mean” model.
- Explain why fitting
aov(final ~ format)andlm(final ~ format)produce the same fitted means, the same residuals, and the same overall \(F\)-statistic — because they are the same model. - Decompose the total variation of a response into a model (between-group) part and an error (within-group) part, \(\mathrm{SST} = \mathrm{SS}_{\text{model}} + \mathrm{SS}_{\text{error}}\), and read what each piece measures.
- Recognize a two-sample \(t\)-test as a regression with one indicator, and connect its squared \(t\) to the regression \(F\).
- Describe, at the concept level, how linear regression, ANOVA, and logistic regression sit inside one generalized-linear-model family, and say what the unifying view buys a modeler.
Core vocabulary
- One-way ANOVA. A procedure that asks whether the means of a single quantitative response differ across the levels of one categorical factor, by comparing between-group to within-group variation.
- Factor. The categorical variable whose levels define the groups — here,
formatwith levelsin_person,hybrid,online. - Grand mean. The mean of the response over all observations, ignoring group — the prediction of the “no group effect” model.
- Sum of squares (SS). A total of squared deviations. \(\mathrm{SST}\) is total variation about the grand mean; \(\mathrm{SS}_{\text{model}}\) (between-group) is variation the group means explain; \(\mathrm{SS}_{\text{error}}\) (within-group) is leftover variation around the group means.
- \(F\)-statistic. A ratio of explained variation per model degree of freedom to leftover variation per error degree of freedom; large \(F\) signals group means farther apart than noise alone would produce.
- Generalized linear model (GLM). A family that unifies regression, ANOVA, and logistic regression by pairing a linear predictor with a link to the response’s natural scale.
Concept development
One-way ANOVA as a question about group means
Strip ANOVA back to its question and it is humble: do these group means differ by more than sampling noise? You have a quantitative response — final exam score — and a single categorical factor that sorts each student into one of three groups: in_person, hybrid, online. ANOVA asks whether the three group means are far enough apart that a single common mean would be a worse description of the data than three separate means. Framed that way, ANOVA is a contest between two models. The null model says group does not matter: every student is predicted to score the grand mean \(\bar y\), and all the spread is noise. The alternative model says group does matter: each student is predicted to score their own group’s mean, and the spread between those group means is signal. ANOVA measures how much better the second model describes the data than the first, relative to the noise that remains.
The name “analysis of variance” is a clue to the mechanics: it answers a question about means by analyzing variation. If the group means are nearly identical, replacing one common mean with three group means barely reduces the leftover spread — the between-group variation is small next to the within-group variation, and the data look consistent with “no group effect.” If the group means are far apart, swapping to group means slashes the leftover spread — between-group variation dwarfs within-group variation, and a common mean looks untenable. The \(F\)-statistic is exactly that comparison written as a ratio. None of this required a new philosophy; it is the same “does adding this predictor explain variation we could not explain before?” logic you used when prior_gpa improved on study alone in Week 6. The predictor here just happens to be categorical.
ANOVA is regression with a categorical predictor
Here is the identity at the heart of the week. When you fit lm(final ~ format), R encodes format with indicator variables — exactly the dummy coding of Week 8 — and fits
\[ \hat y = b_0 + b_{\text{hyb}}\, x_{\text{hyb}} + b_{\text{onl}}\, x_{\text{onl}} , \]
where \(x_{\text{hyb}}\) and \(x_{\text{onl}}\) are the 0/1 indicators for the hybrid and online levels and in_person is the baseline. Set both indicators to zero and the fitted value is \(b_0\), the in-person mean; turn one on and you get that group’s mean. So the regression’s fitted values are precisely the three group means — which are also exactly the predictions ANOVA’s alternative model makes. The two procedures fit the same predictions to the same data. They cannot disagree about residuals, and they cannot disagree about how the variation splits.
That last point is the bridge. ANOVA’s central bookkeeping is the sum-of-squares decomposition, and it is identical to the one regression reports. The total spread of the response about the grand mean, summed and squared, partitions cleanly into a part the model explains and a part it does not:
\[ \mathrm{SST} = \mathrm{SS}_{\text{model}} + \mathrm{SS}_{\text{error}} . \]
Written out over the \(n\) observations, with \(\hat y_i\) the fitted (group) mean for observation \(i\),
\[ \underbrace{\sum_{i=1}^{n} (y_i - \bar y)^2}_{\mathrm{SST}} = \underbrace{\sum_{i=1}^{n} (\hat y_i - \bar y)^2}_{\mathrm{SS}_{\text{model}}} + \underbrace{\sum_{i=1}^{n} (y_i - \hat y_i)^2}_{\mathrm{SS}_{\text{error}}} . \]
In ANOVA’s vocabulary \(\mathrm{SS}_{\text{model}}\) is the between-group sum of squares and \(\mathrm{SS}_{\text{error}}\) is the within-group sum of squares, but the arithmetic is the regression arithmetic. The overall \(F\)-test of the regression — the one in the last line of summary(lm(...)) that asks “is this model, as a whole, better than an intercept alone?” — divides explained variation per model degree of freedom by leftover variation per error degree of freedom:
\[ F = \frac{\mathrm{SS}_{\text{model}} / \mathrm{df}_{\text{model}}} {\mathrm{SS}_{\text{error}} / \mathrm{df}_{\text{error}}} . \]
That is character-for-character the one-way ANOVA \(F\). Same fitted means, same sums of squares, same degrees of freedom, same ratio. aov() and lm() are two front ends to one engine; aov() formats the output as an ANOVA table, lm() formats it as a coefficient table, and underneath they have fit the same categorical regression. The worked example shows the two outputs side by side so you can watch the \(F\) match.
The broader family — regression, ANOVA, and logistic as one idea
If a numeric predictor (Week 3), a categorical predictor / ANOVA (this week), and a two-group comparison (below) are all the same linear model, the natural question is how much further the framework reaches. The unifying answer is the generalized linear model, and you have already met two of its members without the label. Every model in the family is built from the same three parts. First, a linear predictor: the familiar weighted sum \(\eta = \beta_0 + \beta_1 x_1 + \beta_2 x_2 + \cdots\) assembled from your predictors, numeric or indicator. Second, a link function that connects that linear predictor to the response’s natural scale. Third, a distribution for the response around its mean that suits the data’s type.
Ordinary linear regression — and therefore ANOVA — is the special case where the link is the identity (the linear predictor is the predicted mean, \(\hat y = \eta\)) and the response scatters Normally about it. Logistic regression from Week 11 is the case where the response is binary, the link is the logit \(\operatorname{logit}(p) = \log\!\big(\tfrac{p}{1-p}\big)\), and the linear predictor models log-odds rather than a mean directly:
\[ \operatorname{logit}(\hat p) = \beta_0 + \beta_1 x . \]
Same skeleton — a linear predictor from your variables — with a different link and a different response distribution chosen to fit a probability instead of an exam score. The family extends past these two: count responses get a log link and a Poisson distribution, and so on. You will not fit those this week. The point is the map, not the territory: the models of this course are not a scattered list but neighboring points in one structured family, and knowing the family is what lets a modeler step confidently toward outcomes — proportions, counts, rates — the term did not have room to cover. That unifying view is precisely the subject of the Beyond Multiple Linear Regression chapter named in this week’s reading.
Worked examples
Worked example — final ~ format as ANOVA and regression (studyhabits)
We return to the recurring studyhabits dataset (synthetic; seed set, set.seed(33003); \(n = 200\) students standing in for a campus learning-analytics study — not real student data). The slice is the final exam score final and the section format format, with in_person as the baseline. The three group means are \(78.0\) (in-person), \(75.0\) (hybrid), and \(71.0\) (online), and the grand mean over all \(200\) students is \(\bar y \approx 74.7\). We fit the same data two ways — once as a one-way ANOVA with aov(), once as a regression with lm() — and check that the overall \(F\) agrees.
set.seed(33003)
studyhabits$format <- relevel(factor(studyhabits$format), ref = "in_person")

# 1) One-way ANOVA: do the three format means differ?
fit_aov <- aov(final ~ format, data = studyhabits)
summary(fit_aov)

#>              Df Sum Sq Mean Sq F value  Pr(>F)
#> format        2    SS_model  ...   F=12.0   ...   # between-group
#> Residuals   197    SS_error  ...                  # within-group
#> # SST = SS_model + SS_error  (the total splits in two)

# 2) The SAME model as a regression
fit_lm  <- lm(final ~ format, data = studyhabits)
summary(fit_lm)

#> (Intercept)   78.0    # in_person fitted mean (baseline)
#> formathybrid  -3.0    # hybrid - in_person  -> hybrid mean 75.0
#> formatonline  -7.0    # online - in_person  -> online mean 71.0
#> ...
#> F-statistic: 12.0 on 2 and 197 DF   # SAME overall F as the ANOVA above
The figure below shows the split directly, at the level of individual students rather than just table entries: each point is one synthetic student, each format’s fitted mean is a diamond, and the dashed line marks the grand mean across all 200 students.
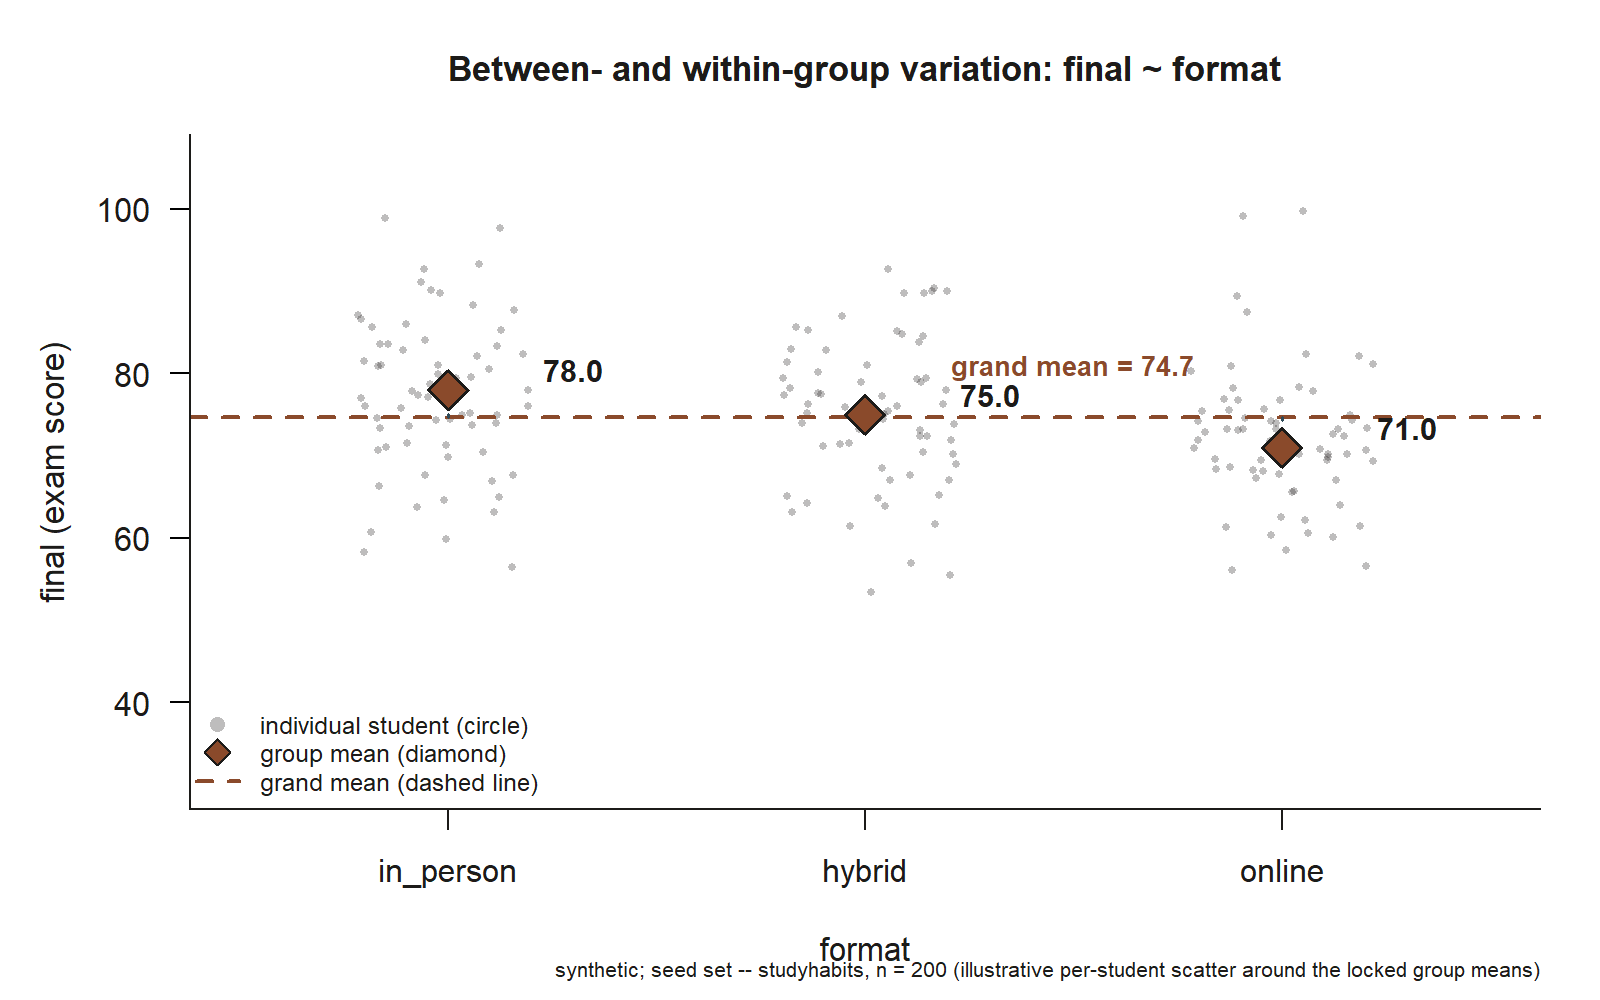
studyhabits student’s final score, jittered within its format column (in_person, hybrid, online). Each format’s fitted mean — \(78.0\), \(75.0\), and \(71.0\) — is marked with a diamond, and the dashed line marks the grand mean, \(74.7\), across all \(200\) students. The dotted segment from the dashed line up or down to each diamond is the between-group piece of the split (\(\mathrm{SS}_{\text{model}}\)); the vertical scatter of the circles around their own diamond is the within-group piece (\(\mathrm{SS}_{\text{error}}\)) (synthetic; seed set; illustrative per-student scatter around the locked group means).
Read the two outputs as one model. The regression’s coefficients rebuild the group means exactly: the intercept \(78.0\) is the in-person mean, \(78.0 + (-3.0) = 75.0\) is the hybrid mean, and \(78.0 + (-7.0) = 71.0\) is the online mean — the same \(78 / 75 / 71\) the ANOVA fits as its three group predictions. Because both procedures predict each student’s group mean, their residuals are identical, and so the variation splits the same way: \(\mathrm{SST} = \mathrm{SS}_{\text{model}} + \mathrm{SS}_{\text{error}}\), with \(\mathrm{SS}_{\text{model}}\) capturing how far the three group means sit from the grand mean \(74.7\) and \(\mathrm{SS}_{\text{error}}\) capturing the spread of students around their own group’s mean. The decisive check is the bottom line: the ANOVA’s \(F = 12.0\) on \(2\) and \(197\) degrees of freedom is, to the decimal, the overall \(F\) printed in the regression summary. That is not a coincidence to be impressed by — it is the identity of the week. One model, two reports.
Interpreting the \(F\) in modeling terms: an \(F\) of \(12.0\) on \(2\) and \(197\) degrees of freedom says the between-group variation per degree of freedom is twelve times the within-group variation per degree of freedom, which is far more separation than three means drawn from a common population would typically show. So the format means differ by more than noise: the model that gives each format its own mean genuinely beats the common-mean model. The model-criticism caveat from Week 8 still binds, though, and ANOVA does not soften it. Students were not randomly assigned to formats, so the \(7\)-point in-person-to-online gap is an association among observed sections, not the causal effect of format. A significant \(F\) tells you the means differ; it does not tell you why, and it cannot rule out that study hours, work hours, or prior GPA differ across the formats and drive part of the gap. Whether you call the analysis “ANOVA” or “regression” changes nothing about that limit.
Worked example — a two-sample \(t\)-test as a regression with one indicator (transfer)
Move the idea to the simplest possible group comparison: two groups. A coffee roaster (synthetic; seed set) runs an A/B test of two checkout page layouts — call them A and B — and records each session’s order value in dollars. The classic tool is a two-sample \(t\)-test of “is the mean order value the same under A and B?” The claim of this transfer is that the \(t\)-test is a regression with a single 0/1 indicator. Code group membership as one indicator — \(x = 0\) for layout A (the baseline), \(x = 1\) for layout B — and fit order value on it.
set.seed(33003)
checkout$layout <- relevel(factor(checkout$layout), ref = "A")

fit_t <- lm(order_value ~ layout, data = checkout)
summary(fit_t)

#> (Intercept)   40.0   # mean order value under layout A (baseline)
#> layoutB        5.0   # B - A : layout B averages $5 more
#> ...
#> # equivalently: t.test(order_value ~ layout, var.equal = TRUE)
#> # gives the SAME mean difference and the same p-value
The bar chart below makes the same reading concrete: layout B’s fitted mean sits $5.0 above layout A’s baseline — the same \(5.0\) difference the regression’s layoutB coefficient reports.
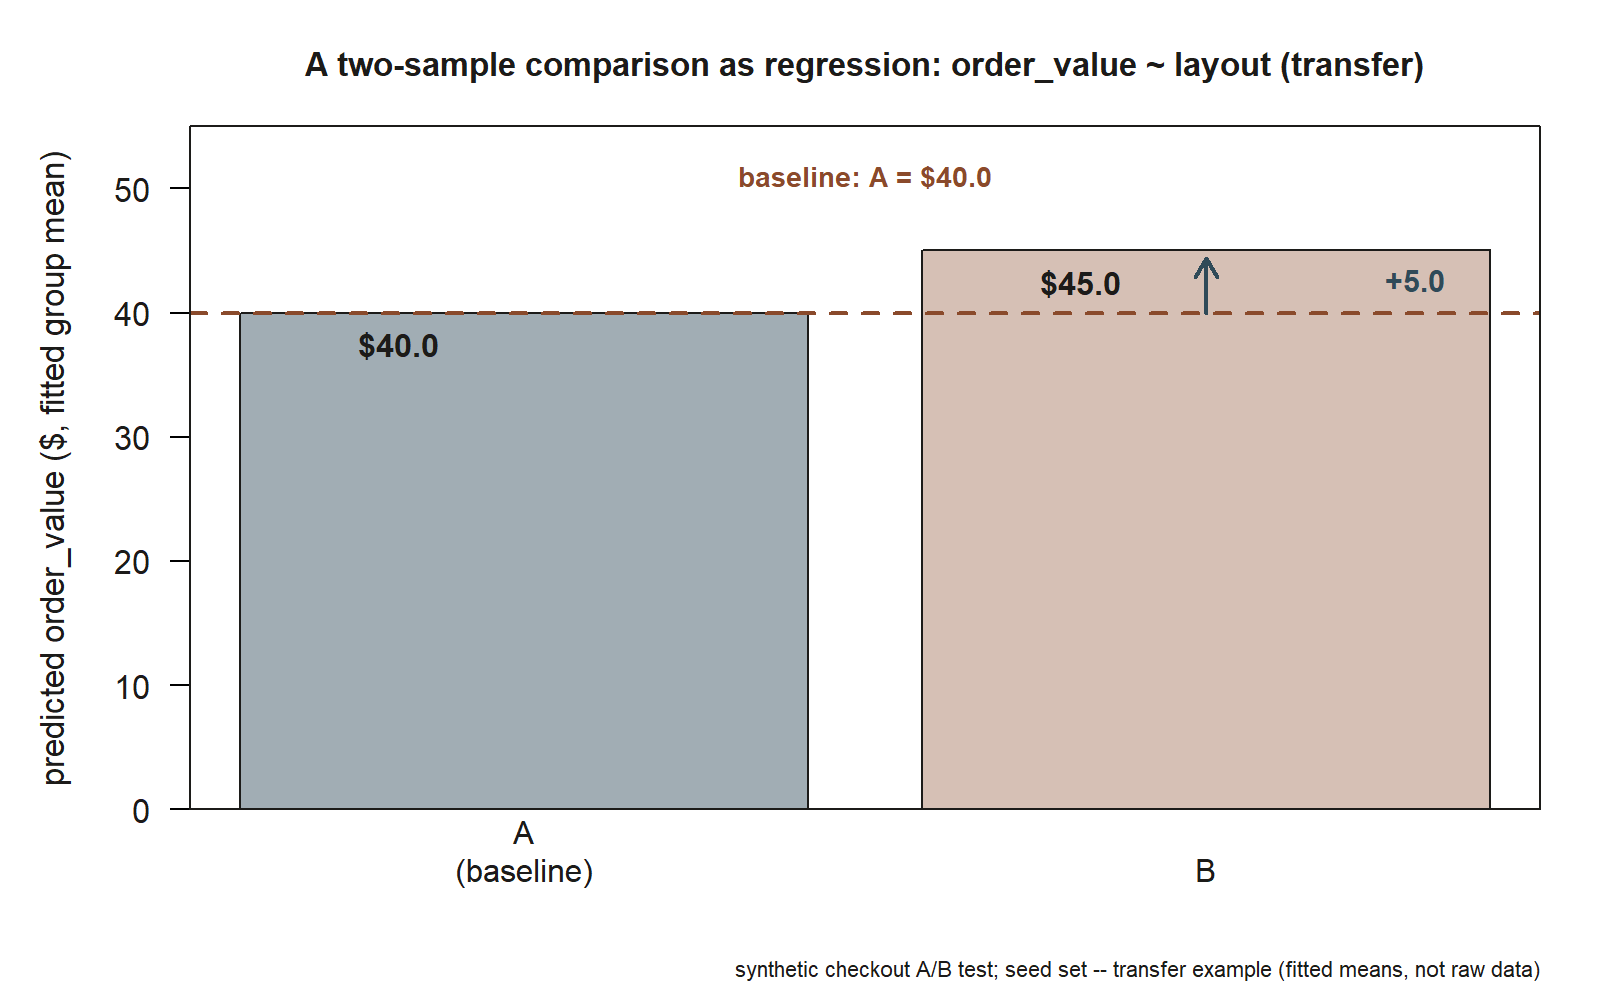
order_value for layout A (baseline, $40.0) and layout B ($45.0), with the dashed line marking the layout-A baseline and the arrow marking the \(+5.0\) difference layoutB reports in the regression table above — the same difference a two-sample \(t\)-test would report as the gap between the two group means (synthetic checkout A/B test; seed set; transfer example).
Read it from the anchor, just as in Week 8. The intercept \(40.0\) is the mean order value under layout A: about $40 per session. The single coefficient layoutB 5.0 is a difference, not a mean — layout B averages $5 more — so B’s fitted mean is \(40.0 + 5.0 = 45.0\), about $45. That coefficient, \(5.0\), is exactly the difference in group means a two-sample \(t\)-test reports, and its \(t\)-statistic in the regression table is exactly the (equal-variance) two-sample \(t\)-statistic. The connection runs one layer deeper and ties back to the first example: with two groups there is one model degree of freedom, and the regression’s overall \(F\) equals the square of that \(t\) — \(F = t^2\). The \(t\)-test, the two-group regression, and a one-way ANOVA on two groups are three names for one fitted model.
Notice what transferred. Nothing about the one-indicator-is-a-two-group-comparison logic changed when we swapped exam scores for order values, students for sessions, or formats for page layouts. The same model-criticism caveat travels too, though here it is gentler: because the roaster randomized sessions to layouts A and B, the $5 difference can be read more causally than the format gap could — randomization is the move that earns the causal language a bare observational comparison cannot. The tool is the same regression either way; what changes the strength of the conclusion is the design that produced the data, not the name of the test.
A common mistake
The mistake this week is built to prevent is treating ANOVA and regression as different tools — filing them in separate drawers, learning two output formats as two subjects, and choosing between them as if they answered different questions. A student decides “I have groups, so I need ANOVA” and reaches for aov() as though lm() were the wrong machine, or runs both and is puzzled — or worse, reassured — when the \(F\) matches, as if a coincidence had been confirmed rather than an identity. The match is not a coincidence and not a check that something went right; it is guaranteed, because aov(final ~ format) and lm(final ~ format) fit the same model to the same data. Believing they are different tools means memorizing two procedures, two tables, and two assumption lists where there is one of each, and it hides the structure that makes the rest of statistics navigable.
The cure is to default to the model, not the test. When you face a quantitative response and a categorical factor, fit lm(response ~ factor) and read the coefficient table as group means and differences; if a classical ANOVA table is what a reader expects, anova(fit_lm) or aov() will print the same fit in that format. Whenever an \(F\) from an ANOVA matches an \(F\) from a regression on the same variables, do not call it luck — say why: they are one model. And when a two-sample \(t\)-test appears, recognize it as the one-indicator regression it is, and remember \(F = t^2\) ties it to everything else. Holding “it is all one linear model” in front of you is what turns a bestiary of tests into a single, learnable idea.
Low-stakes self-checks (ungraded)
These are ungraded self-checks — no points, no submission. Use them to test whether the “one model, several names” reading has stuck.
- In one sentence, state the two models a one-way ANOVA pits against each other, and say what each one predicts for an individual student.
aov(final ~ format)andlm(final ~ format)are fit to the samestudyhabitsdata. Will their overall \(F\)-statistics agree exactly, approximately, or not at all? Explain why in one sentence.- The decomposition is \(\mathrm{SST} = \mathrm{SS}_{\text{model}} + \mathrm{SS}_{\text{error}}\). Using group means \(78 / 75 / 71\) and grand mean \(74.7\), say in words which piece — between-group or within-group — those numbers feed, and which piece the spread of students around \(71.0\) feeds.
- A classmate runs an ANOVA, gets \(F = 12.0\), then runs the matching regression and is surprised to find the same \(F\). Diagnose the misunderstanding in one sentence.
- A two-sample \(t\)-test on two groups gives \(t = 3.0\). What overall \(F\) would the matching one-indicator regression report, and what is the relationship you used?
- Name the three building blocks shared by every generalized linear model, and say which two of those blocks differ between ordinary linear regression and the logistic regression of Week 11.
Reading and source pointer
For this week, read ModernDive Chapter 6 on multiple regression with categorical predictors — the chapter that shows indicator coding producing group means and differences inside the same lm() you have used all term, which is the regression side of the ANOVA-is-regression identity. Then read Beyond Multiple Linear Regression (Roback & Legler), Chapter 5 — Generalized Linear Models: A Unifying Theory, for the concept-level map that places linear regression, ANOVA, and logistic regression as members of one family built from a linear predictor, a link, and a response distribution. Chapter 6 of ModernDive secures the “ANOVA is regression” half; Chapter 5 of Beyond MLR opens the “and both sit inside a larger family” half that this week previews. These notes are the course’s own synthesis, grounded in but not copied from the sources.
Public vs. graded
These notes, the examples, and the practice here are public and ungraded — study material only. No graded prompts, answer keys, rubrics, point values, or due dates appear on this site. Graded modeling checkpoints, labs, quizzes, homework/modeling memos, the midterm, the project, and the final live in Blackboard (the LMS), which is authoritative for due dates, submissions, and grades. If this page and Blackboard ever disagree, follow Blackboard.
Looking ahead
Next week we turn from fitting models to communicating them: how to turn a fitted model into a reproducible, trustworthy report in a single Quarto document, so that anyone — including you, months later — can re-run the analysis and trace every number back to the code that produced it.
See also
- Notation glossary — the fixed symbols used across the course.
- Modeling reference — the running model catalogue.
- Week 8 — Categorical predictors & group comparisons — the indicator coding this week reveals to be ANOVA.
- Week 11 — Logistic regression — the other member of the GLM family this week names.
- Week 12 — Model comparison & selection — comparing nested models, the same “does this term explain more variation?” logic the ANOVA \(F\) asks.