Lab 11 — Logistic regression in R
Fitting glm() for a binary outcome and reading odds ratios
Purpose. This lab is the hands-on companion to Week 11 — Logistic regression. There you met the idea that when the response is a yes/no outcome, a straight line is the wrong tool, and that
glm()with the binomial family fits a model on the log-odds scale instead. Here you carry out that fit yourself: you estimatepassed ~ study, read the slope as an odds ratio, and turn the model back into predicted probabilities you can actually report. The goal is fluency with the workflow — fit, read the coefficients, exponentiate, predict — so that the interpretation, not the keystrokes, stays in the foreground.
The idea
Up to now every response in this course has been the numeric final exam score, and a straight line \(\hat{y} = b_0 + b_1 x\) was a reasonable description: predicted scores can sit anywhere on the score scale, and the line just slides up or down. A binary outcome breaks that picture. The response passed is TRUE or FALSE — the student either cleared the course or did not — and what we want to model is the probability of passing, \(p\), as study hours change. A probability is trapped between 0 and 1, but a straight line is not: extend study far enough and a linear fit would cheerfully predict a “probability” of \(1.4\) or \(-0.3\), which is nonsense. We need a model that bends.
Logistic regression solves this by modeling the log-odds (the logit) as a linear function of the predictor, rather than the probability itself:
\[ \operatorname{logit}(p) = \log\!\left(\frac{p}{1-p}\right) = \beta_0 + \beta_1 x . \]
The odds \(\frac{p}{1-p}\) run from 0 to \(\infty\), and the log of the odds runs from \(-\infty\) to \(+\infty\), so a straight line on that scale is free to take any value while the implied probability stays politely inside \([0,1]\). When we undo the logit to get back a probability, the curve is the familiar S-shape (the logistic curve): nearly flat near 0 and 1, steepest in the middle. That bend is the whole point — it is how the model keeps every predicted probability legal.
The price we pay is interpretation. The slope \(\beta_1\) is no longer “points per study hour.” It is a change in log-odds per study hour, which is hard to feel. So the standard move — the one this lab drills — is to exponentiate the slope, turning it into an odds ratio: the multiplicative factor by which the odds of passing change for each additional weekly study hour. Odds ratios are still not the most intuitive quantity in the world, which is why we finish by converting the fitted model into predicted probabilities at a few specific study levels, because a probability is what a student or an advisor actually wants to hear.
Goal
By the end of this lab you should be able to:
- Fit a logistic regression of
passedonstudywithglm(family = binomial). - Read the two coefficients off the fitted model and write the logit equation.
- Exponentiate the slope with
exp(coef(...))and state the odds ratio per study hour in plain words. - Produce predicted probabilities at chosen study levels and confirm they fall in \([0, 1]\) and rise along the S-curve.
The data here are synthetic; seed set (set.seed(33003)) — the studyhabits teaching dataset of \(n = 200\) students in one intro course. It stands in for a campus learning-analytics study and is not real student data, so every number is a teaching illustration, not an empirical finding about anyone.
Setup
We work with the same studyhabits data from the rest of the course. The response for a logistic model is the logical variable passed (defined as final >= 70), and the single predictor here is study, average weekly study hours. Load the data and remind yourself of the two columns you will use. In this diagnostic the code is shown, not executed — read it as the workflow you would run in RStudio or Posit Cloud, and treat the commented numbers as the output you would see.
# Lab 11 setup — logistic regression of passing on study hours
# Data: synthetic studyhabits teaching dataset (n = 200); synthetic, seed set.
set.seed(33003)                 # randomness is seeded so the example is reproducible

# studyhabits is the course's synthetic teaching data frame.
# Relevant columns for this lab:
#   passed : logical, TRUE if final >= 70 (the binary response)
#   study  : numeric, average weekly study hours (the predictor)

str(studyhabits[, c("study", "passed")])
# 'data.frame': 200 obs. of 2 variables:
#  $ study : num  3.1 9.4 0.5 12.0 6.7 ...
#  $ passed: logi  FALSE TRUE FALSE TRUE TRUE ...

# Quick base rate: roughly how many students passed?
mean(studyhabits$passed)
# [1] 0.50   # about half the synthetic class passed — a balanced outcome to model
The base rate above — about half the synthetic class passing — is the no-predictor baseline. A useful logistic model should let study pull predicted probabilities meaningfully above and below that 50% anchor, and that is exactly what we will check. Note that glm() treats the logical passed as a 0/1 response automatically, with TRUE as the “success” (a passing student) it is trying to predict.
Steps
Step 1 — Fit the logistic model with glm(family = binomial)
The fitting call mirrors the lm() calls you already know, with two changes: you use glm() instead of lm(), and you tell it the response is binomial. The formula passed ~ study reads exactly as before — “model passed as a function of study.”
# Fit the logistic regression: passed ~ study
set.seed(33003)
fit <- glm(passed ~ study, data = studyhabits, family = binomial)

summary(fit)
# Coefficients:
#             Estimate Std. Error z value Pr(>|z|)
# (Intercept) -2.0000     0.30      -6.67   <2e-16 ***
# study        0.3500     0.05       7.00   <2e-16 ***
# (Null deviance and residual deviance lines omitted for brevity)
Reading the Estimate column gives the fitted intercept \(b_0 = -2.0\) and the fitted slope \(b_1 = 0.35\), so the model on the log-odds scale is
\[ \operatorname{logit}(\hat{p}) = -2.0 + 0.35\,x , \]
where \(x\) is study. Interpreted plainly: for each additional weekly study hour, the predicted log-odds of passing rise by \(0.35\). The small standard error and large \(z\) value for study say that, in this synthetic dataset, the study-hours effect is clearly distinguishable from zero — studying is associated with a higher chance of passing, not a flat or random relationship. The intercept of \(-2.0\) is the log-odds of passing at study = 0, which we will convert to a probability in Step 3; remember that 0 study hours is at the edge of the data, so reading too much into it is mild extrapolation.
Step 2 — Exponentiate the slope to get the odds ratio
Log-odds are hard to feel, so we exponentiate the coefficients. Applying exp() to the slope converts the “change in log-odds per study hour” into an odds ratio — a multiplicative factor on the odds of passing.
# Convert coefficients from the log-odds scale to the odds / odds-ratio scale
exp(coef(fit))
# (Intercept)       study
#   0.1353        1.4191      # exp(-2.0) = 0.135 ; exp(0.35) = 1.419

# So the odds ratio per extra study hour is about:
exp(coef(fit)["study"])
#  study
# 1.4191
The odds ratio for study is \(e^{0.35} \approx 1.42\). Interpreted plainly: each additional weekly study hour multiplies a student’s odds of passing by about \(1.42\) — a 42% increase in the odds per hour, holding nothing else in this single-predictor model. Two extra hours multiply the odds by \(1.42^2
\approx 2.0\), roughly doubling them. The exponentiated intercept, \(e^{-2.0} \approx 0.135\), is the odds of passing at zero study hours: odds of about \(0.135\) to 1, or roughly 1 chance of passing for every 7 of not passing — again an extrapolated, edge-of-data quantity. Notice the key conceptual point: a constant odds ratio of \(1.42\) per hour does not mean a constant change in probability per hour. That is the next step, and it is where the S-curve shows up.
Step 3 — Turn the model into predicted probabilities
Odds ratios are still abstract; advisors and students want probabilities. Use predict() with type = "response" to get predicted probabilities \(\hat{p}\) at specific study levels. We choose three study values that span the data: 0 hours (the bottom edge), about 5.7 hours (where the model crosses 50%), and 10 hours (a heavy studier).
# Predicted probability of passing at chosen study levels
new <- data.frame(study = c(0, 5.7, 10))
predict(fit, newdata = new, type = "response")
#        1         2         3
#   0.1192    0.5000    0.8176     # p-hat at study = 0, 5.7, 10

# Same numbers by hand, to see where they come from:
# logit at study = 0  : -2.0 + 0.35*0   = -2.00  -> p = 1/(1+exp(2.00))  = 0.12
# logit at study = 5.7: -2.0 + 0.35*5.7 =  0.00  -> p = 1/(1+exp(0.00))  = 0.50
# logit at study = 10 : -2.0 + 0.35*10  =  1.50  -> p = 1/(1+exp(-1.50)) = 0.82
The predicted probabilities are \(\hat{p} \approx 0.12\) at 0 hours, \(\hat{p} \approx 0.50\) at about 5.7 hours, and \(\hat{p} \approx 0.82\) at 10 hours. Interpreted plainly: a student who barely studies has roughly a 12% predicted chance of passing in this synthetic class; a student studying about 5.7 hours a week is at a coin-flip, 50%; and a student putting in 10 hours has about an 82% predicted chance. The \(\hat{p} = 0.50\) point at \(x \approx 5.7\) is the model’s decision threshold in a natural sense — the study level where passing becomes more likely than not. Each of these is a model-based prediction, not a guarantee for any individual.
Step 4 — Trace the S-curve across the full study range (optional check)
To see the bend rather than just three points, predict across a fine grid of study values. This makes the S-shape — and the fact that probabilities never escape \([0, 1]\) — visible.
# Predict across the whole study range to expose the S-curve
grid <- data.frame(study = seq(0, 20, by = 0.5))
grid$phat <- predict(fit, newdata = grid, type = "response")

range(grid$phat)
# [1] 0.1192 0.9923    # every predicted probability stays inside [0, 1]

# A quick look at the curve (shown, not executed in this diagnostic):
plot(grid$study, grid$phat, type = "l",
     xlab = "weekly study hours", ylab = "predicted P(pass)",
     main = "Logistic fit: passed ~ study (synthetic; seed set)")
abline(h = 0.5, lty = 2)   # the 50% line; the curve crosses it near study = 5.7
Running that call produces the picture below — the same curve the three anchor points from Step 3 were only samples of.
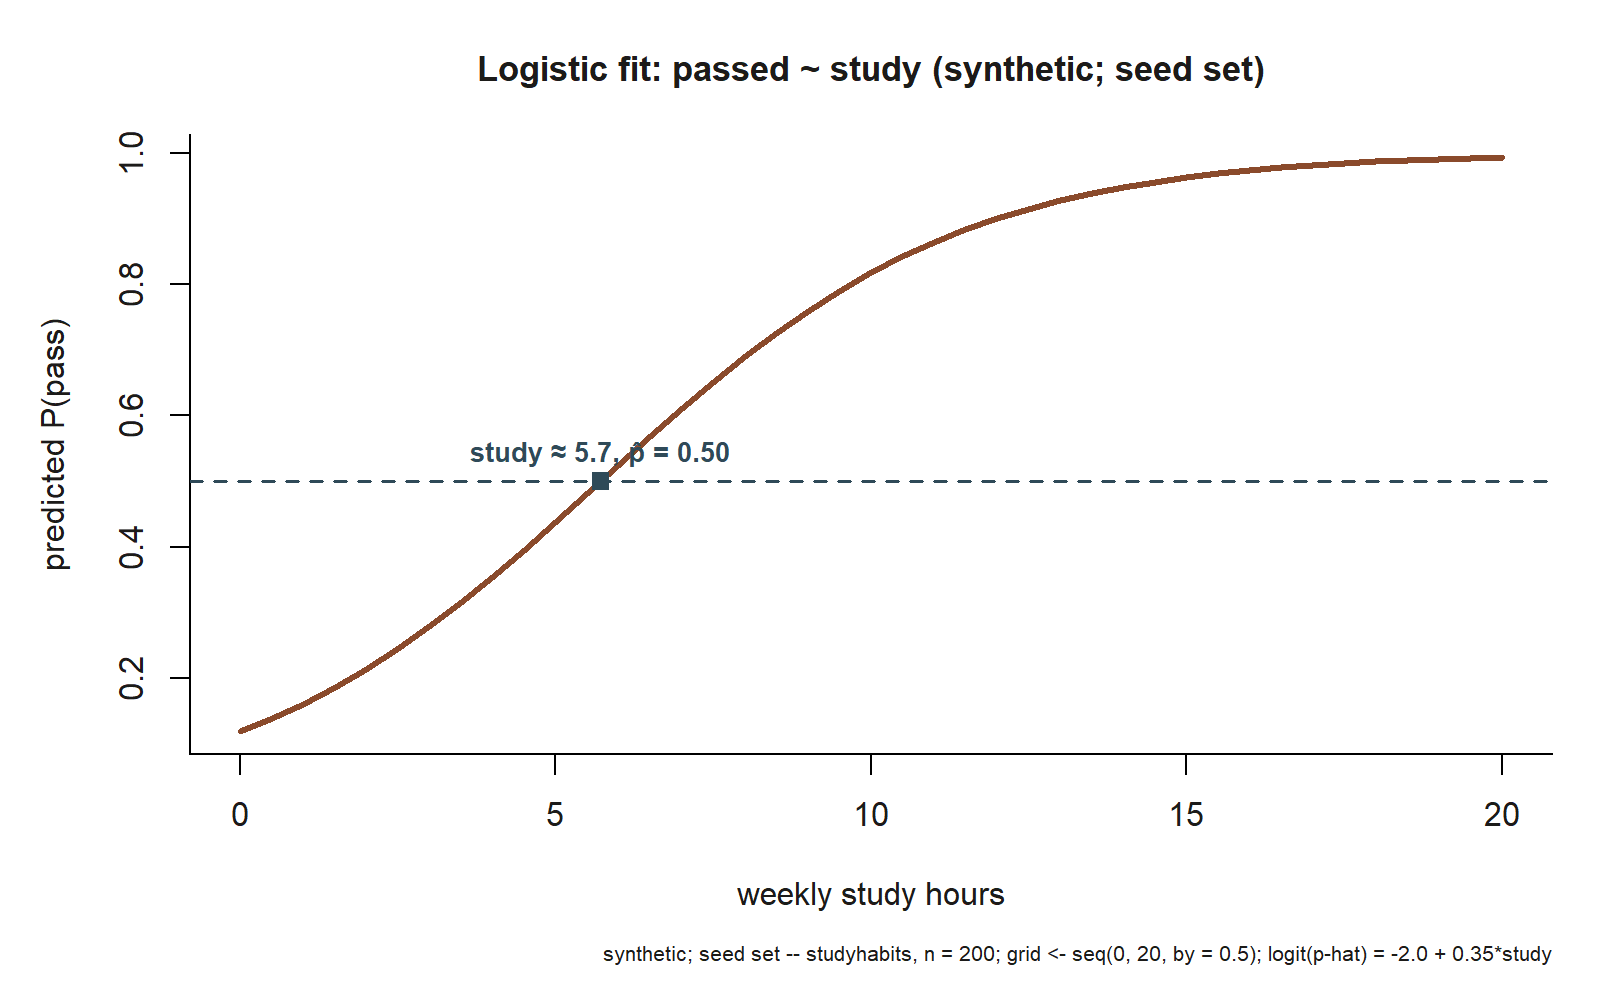
study \(\approx 5.7\). This is the literal output of the Step 4 plot() call: predicted \(\hat p\) against study, traced across the lab’s own grid (study from \(0\) to \(20\) by \(0.5\)) from the fitted model \(\operatorname{logit}(\hat p) = -2.0 + 0.35\,\text{study}\). The dashed line marks \(\hat p = 0.5\); the marked point sits where the curve crosses it, at study \(\approx 5.7\), matching the algebra worked out in Step 3 (synthetic; seed set).
Interpreted plainly: across the entire range of study hours the predicted probability climbs smoothly from about 0.12 up toward 1 but never reaches or exceeds it — the curve flattens as it approaches the ceiling. That flattening is the logistic model protecting the \([0,1]\) boundary, the exact behavior a straight line could not provide. The steepest part of the curve is in the middle, near the 50% crossing, which is why a one-hour change in study buys the largest probability gain for a middling student and a much smaller gain for a student who is already nearly certain to pass — even though the odds ratio of \(1.42\) per hour is the same everywhere.
Verify
Before you trust the fit, run these self-checks (ungraded — they are sanity checks on the modeling, not a graded deliverable):
- Probabilities are legal. Every value from
predict(..., type = "response")lies in \([0, 1]\). In the grid check above,range(grid$phat)returned about \((0.12,\ 0.99)\) — no negative probabilities and nothing above 1. If you ever see a predicted probability outside \([0,1]\), you have almost certainly usedlm()or forgottentype = "response", notglm(family = binomial). - The curve rises smoothly (the S-curve). Sorted by
study, the predicted probabilities are monotonically increasing because the slope \(b_1 = 0.35\) is positive. They rise fastest in the middle (near \(\hat{p} = 0.5\)) and flatten toward the top — the hallmark S-shape. - The three anchor points line up. \(\hat{p}(0) \approx 0.12\), \(\hat{p}(5.7) \approx 0.50\), and \(\hat{p}(10) \approx 0.82\). The 50% crossing at \(x \approx 5.7\) is where \(\operatorname{logit} = 0\), i.e. \(-2.0 + 0.35x = 0 \Rightarrow x = 2.0 / 0.35 \approx 5.7\) — a quick way to locate the threshold by hand.
- Odds ratio matches the slope.
exp(coef(fit))["study"]returns about \(1.42\), and \(e^{0.35}\) computed directly also gives \(1.42\). If these disagree, you exponentiated the wrong thing (the intercept instead of the slope, or the probability instead of the coefficient).
If all four checks pass, you have a coherent logistic fit: a positive log-odds slope, an odds ratio above 1, predicted probabilities inside the legal range, and a smoothly rising S-curve that crosses 50% where the algebra says it should.
AI use note
You may use an AI assistant to support your understanding of this lab — for example, to explain why type = "response" is needed or to remind you what an odds ratio means — but you must verify everything it produces against the model output and your own reasoning. The interpretation is yours to defend. Treat AI as a study aid, never as the author of your conclusions.
| Tool | Purpose | Verification |
|---|---|---|
| AI chat assistant | Explain the difference between the log-odds, odds, and probability scales | Confirm against the fitted summary(fit) and exp(coef(fit)) output above; re-derive one number by hand |
| AI chat assistant | Suggest the predict(..., type = "response") syntax for probabilities |
Run it on the three anchor study values and check \(\hat{p}\) matches \(\approx 0.12,\ 0.50,\ 0.82\) |
| AI coding helper | Draft the grid/plot code for the S-curve | Read every line; confirm range(grid$phat) stays in \([0,1]\) and the curve is monotone before trusting the picture |
| AI chat assistant | Phrase the odds-ratio interpretation in plain language | Make sure the sentence says “multiplies the odds,” not “the probability,” per study hour |
See also
- Week 11 — Logistic regression — the concept note this lab accompanies, with the full development of the logit, odds, and the S-curve.
- Week 10 — Prediction and validation — predicting from a fitted model and judging it out of sample; the same
predict()workflow, a numeric response. - Lab 10 — Cross-validation and overfitting — the prior lab; the validation mindset carries over to classification models.
- Notation glossary — the fixed symbols, including \(\operatorname{logit}(p)\) and OR (odds ratio).
The graded deliverable, its rubric, and due date live in Blackboard (the LMS) — this page is study and practice only.