Week 9 — Interactions & effect modification
When an association differs across groups
The week question
Does studying help working students as much as it helps everyone else? Up to now, whenever we have fit final ~ study, we have implicitly assumed there is one study slope — a single number that describes how much an extra weekly study hour buys, on average, for every student in the room. That assumption is convenient, and sometimes it is fine. But it is a modeling choice, not a law of nature, and this week we question it directly. It is entirely possible that an extra study hour pays off handsomely for a student with open evenings and pays off much less for a student who clocks fifteen-plus hours at a job and studies in the cracks of an already full week. If that is true, then a single slope is not telling the whole story — it is averaging together two different stories and reporting the blend.
The tool for letting an association differ across groups is the interaction term. The week question — does studying help working students as much as everyone else? — is exactly the kind of question an interaction model is built to answer, because it asks whether the study–final relationship is the same for workers and non-workers, or whether work status changes the effect of studying.
Why this matters
Most of the interesting questions in applied work are interaction questions, even when nobody uses the word. “Does the tutoring program help struggling students more than strong ones?” “Is the new fertilizer worth it in dry years but not wet ones?” “Does the drug lower blood pressure more in older patients?” Each one asks whether an effect depends on something else — and an effect that depends on a third variable is an interaction. If you only ever fit additive models, you are quietly assuming the answer to every such question is no, the effect is the same for everyone, and you will report a single averaged slope that may fit no one well.
Getting this right matters for decisions, not just for fit. If studying helps non-workers a lot and workers only a little, then blanket advice — “everyone should study more” — is good advice for some students and weak advice for others, and a program that only adds study hours might widen rather than narrow a gap. A model that hides the interaction hides the very distinction a decision-maker needs. This is also where the course’s central theme — a model as a careful, criticizable claim — gets sharper: we are no longer just asking how strong is the association, we are asking does the association itself change across groups, and we need notation and output that can express the difference.
Learning goals
By the end of this week you should be able to:
- Explain in plain language what an interaction (effect modification) is, and contrast it with the additive models from earlier weeks where every group shared one slope.
- Write and fit an interaction model in R with the
study * worksshorthand, and recognize the four terms it produces: intercept, main effect ofstudy, main effect ofworks, and thestudy:worksproduct term. - Recover the within-group slopes from the coefficients — read the non-worker slope and the worker slope out of the fitted model rather than stopping at the raw coefficients.
- Interpret the product-term coefficient as the difference between slopes, with the correct sign and in a sentence tied to the modeling question.
- Distinguish effect modification (a slope that differs across groups) from confounding (a slope that shifts when you adjust) — two different ideas that students routinely conflate.
- Name the most common interpretation error and say why reading the product term alone is misleading.
Core vocabulary
- Interaction term. A predictor formed by multiplying two predictors together (here
study × works). Its coefficient lets the slope of one variable depend on the value of the other. - Effect modification. The substantive name for the same idea: a third variable (
works) modifies the effect of a predictor (study) on the response. The modifier is the variable that changes the slope. - Within-group slope. The slope of
finalonstudycomputed inside one group — non-workers have their own slope, workers have theirs. These are the numbers you actually interpret. - Main effect. A coefficient on a single predictor by itself. In an interaction model, a “main effect” is conditional — it describes one variable when the interacting variable is at its baseline or zero — so it must be read carefully, not as an overall effect.
- Product-term coefficient. The coefficient on the
study:worksterm. It is a difference of slopes (worker slope minus non-worker slope), not a slope itself. - Additive model. A model with no interaction, where group differences shift the line up or down (a change in intercept) but every group keeps the same slope (parallel lines). Week 8’s
final ~ formatwas additive in this sense. - Confounding. A different phenomenon (week 6–7): a predictor’s slope changes when you adjust for a third variable that is associated with both predictor and response. Confounding is about bias in one slope; effect modification is about two genuinely different slopes.
Concept development
When one slope is not enough — the interaction term
Start from the additive multiple-regression model you already know. If we put study and works in together without an interaction, we get
\[ \hat{y} = b_0 + b_1\,\text{study} + b_2\,\text{works}, \]
where works is coded \(1\) for a working student and \(0\) otherwise. This model gives workers and non-workers different intercepts — the line shifts down by \(b_2\) for workers — but it forces them to share the same slope \(b_1\). Geometrically, that is two parallel lines: same tilt, different height. The additive model can say “workers score lower on average” but it cannot say “studying helps workers less,” because saying that requires the lines to have different tilts.
To let the tilt differ, we add the product of the two predictors:
\[ \hat{y} = b_0 + b_1\,\text{study} + b_2\,\text{works} + b_3\,(\text{study} \times \text{works}). \]
Now look at what the model becomes inside each group. For a non-worker, works \(= 0\), so the last two terms vanish and the line is \(\hat{y} = b_0 + b_1\,\text{study}\) — slope \(b_1\). For a worker, works \(= 1\), so the line is \(\hat{y} = (b_0 + b_2) + (b_1 + b_3)\,\text{study}\) — slope \(b_1 + b_3\). The single extra coefficient \(b_3\) is the hinge that lets the two slopes separate: it is the amount the slope changes when you switch from non-worker to worker. If \(b_3 = 0\), the slopes are equal and we are back to the additive parallel-lines model; if \(b_3 \neq 0\), the lines fan out or converge. That is the whole idea of an interaction in one equation — one product term turns parallel lines into two lines with their own tilts.
Reading within-group slopes
The coefficients of an interaction model are not the numbers you ultimately want to report. The numbers you report are the within-group slopes, and you build them from the coefficients. This is the single most important skill of the week, so go slowly.
Write down the slope for each group explicitly. The non-worker slope is just \(b_1\), because for non-workers the product term is multiplied by zero. The worker slope is \(b_1 + b_3\), because for workers the product term switches on and adds \(b_3\) to the tilt. So the recipe is:
\[ \text{slope}_{\text{non-worker}} = b_1, \qquad \text{slope}_{\text{worker}} = b_1 + b_3. \]
The product-term coefficient \(b_3\) is then exactly the difference between these two slopes: \(\text{slope}_{\text{worker}} - \text{slope}_{\text{non-worker}} = b_3\). That is why \(b_3\) is best read as a comparison, not as an effect on its own — it answers “by how much does the study slope change for workers?” rather than “what does studying do?” When you communicate results, translate every coefficient into a within-group slope and say it as a sentence: for non-workers, each extra study hour is associated with \(b_1\) more points; for workers, with \(b_1 + b_3\) more points. If you can write those two sentences, you have read the interaction correctly.
Effect modification vs confounding — two different ideas
These two ideas live next door to each other and students mix them up constantly, so it is worth drawing the line sharply. Both involve a third variable and both can change what a slope looks like — but they are different questions with different model moves.
Confounding (weeks 6–7) is about bias. The crude study slope was \(2.5\); once we adjusted for prior_gpa it dropped to \(1.8\), because stronger students both study more and score higher, so part of the crude slope was really prior_gpa wearing a study costume. Confounding asks: is my one slope distorted because I left a common cause out? The fix is adjustment — add the confounder as a main effect — and the payoff is a single, less-biased slope. There is still one study slope; we just trust the adjusted one more.
Effect modification (this week) is about heterogeneity, not bias. We are not claiming the study slope is distorted; we are claiming there genuinely are two different slopes, one per group, and a single number cannot represent them faithfully. The model move is an interaction term, and the payoff is two slopes plus the difference between them. A confounder you would usually want to adjust away; an effect modifier you want to keep and describe, because the fact that the effect differs across groups is the finding, not a nuisance. A quick test: if your sentence is “the slope is wrong until I account for \(Z\),” you are talking about confounding; if your sentence is “the slope differs depending on \(Z\),” you are talking about effect modification.
Worked examples
Worked example — does studying pay off equally for working students? (studyhabits)
We return to the recurring studyhabits dataset — synthetic; seed set (set.seed(33003)), \(n = 200\) students in one intro course, standing in for a campus learning-analytics study, not real student data. The response is final (exam score, 0–100), the predictor of interest is study (weekly hours), and the candidate modifier is works (TRUE if the student works a job at least 15 hours a week). We fit the interaction model with the * shorthand, which expands to both main effects plus the product term.
set.seed(33003)
# studyhabits: synthetic; seed set; n = 200 students in one intro course
fit_int <- lm(final ~ study * works, data = studyhabits)
coef(fit_int)
#> (Intercept)            study        worksTRUE  study:worksTRUE
#>        52.0              2.8             -4.0             -1.2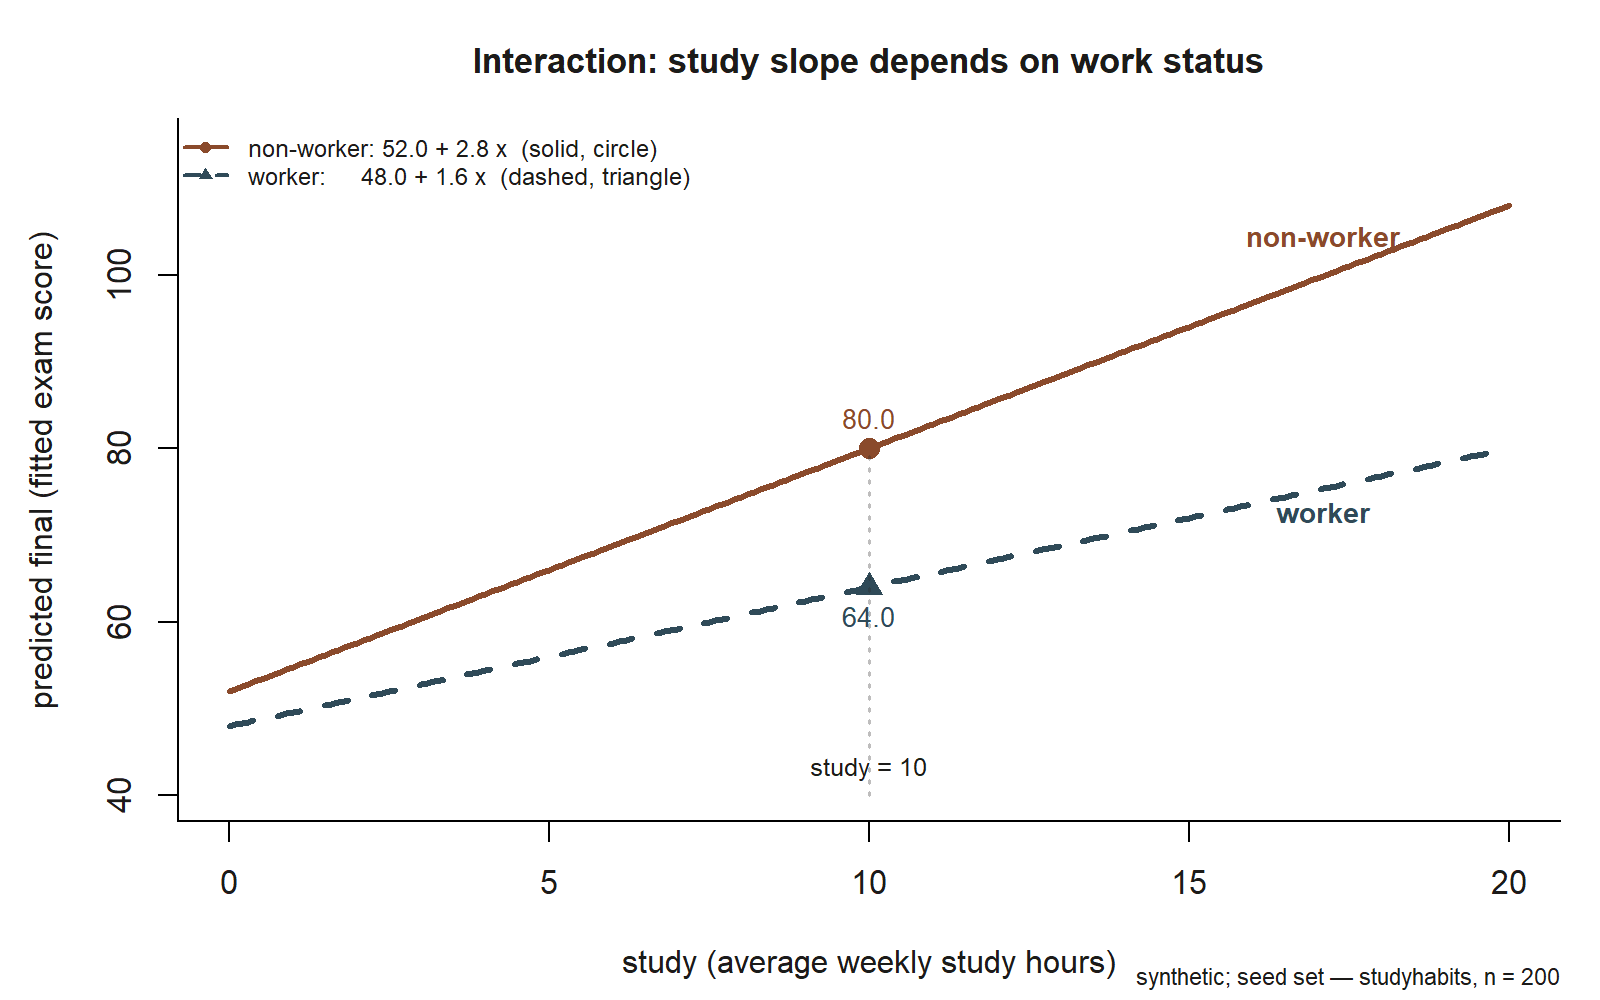
final against study for non-workers (solid line, circle marker: intercept 52.0, slope 2.8) and workers (dashed line, triangle marker: intercept 48.0, slope 1.6). At study \(=10\) the model predicts \(80.0\) for a non-worker and \(64.0\) for a worker — the marked gap of \(16\) points, far larger than the \(-4.0\) intercept difference, because the lines diverge as study hours grow (synthetic; seed set; studyhabits).
Read the four coefficients into the equation:
\[ \hat{y} = 52.0 + 2.8\,\text{study} - 4.0\,\text{works} - 1.2\,(\text{study} \times \text{works}). \]
Now do the only thing that matters — recover the within-group slopes. For non-workers (works \(= 0\)), the slope is \(b_1 = 2.8\): each extra weekly study hour is associated with about \(2.8\) more final-exam points, on average. For workers (works \(= 1\)), the slope is \(b_1 + b_3 = 2.8 + (-1.2) = 1.6\): each extra weekly study hour is associated with only about \(1.6\) more points. The product-term coefficient \(-1.2\) is the difference between those slopes — studying buys a working student about \(1.2\) fewer points per hour than it buys a non-worker.
That is the answer to the week question, stated as a model criticism would want it stated: studying helps working students, but less — the study–final association is modified by work status. The single additive slope we might have reported (\(2.5\) back in week 3) was averaging these two together and so overstated the payoff for workers and understated it for non-workers.
A word on the works main effect, \(-4.0\). It is not “workers score 4 points lower.” It is the gap between workers and non-workers at study \(= 0\), where the two lines start. Because study \(= 0\) is an extrapolation (no one studies zero hours), the \(-4.0\) is mostly a mathematical anchor, not a substantive comparison — flag it as such rather than interpreting it as the typical worker–non-worker difference. To compare the groups at a realistic study level, plug a real value in. At study \(= 10\):
# fitted finals at study = 10, by work status
predict(fit_int,
        newdata = data.frame(study = 10, works = c(FALSE, TRUE)))
#> non-worker: 52.0 + 2.8*10            = 80.0
#> worker:     52.0 + 2.8*10 - 4.0 - 1.2*10 = 64.0
At a typical ten-hour week, the model predicts about \(80\) for a non-worker and about \(64\) for a worker — a gap of \(16\) points that is far larger than the \(-4.0\) intercept difference, precisely because the slopes diverge. The right way to communicate an interaction is to show the contrast at meaningful values of the predictor, not to read the raw coefficients aloud. (As always, before trusting any of this we would check a residual plot for each group and watch for unusual points — the interaction changes the fitted lines, so it changes the residuals too.)
Worked example — a drug whose effect differs by age (transfer)
Now move the idea to a new context so you see it travel. Imagine a small synthetic trial (synthetic; seed set) of a blood-pressure drug. The response \(y\) is the drop in systolic blood pressure (mm Hg) after eight weeks; the predictor dose is the daily dose in milligrams; and the candidate modifier is older (TRUE for patients over 65). The clinical question is an interaction question in disguise: does the drug work as well in older patients as in younger ones?
set.seed(33003)
# synthetic BP trial; seed set
fit_drug <- lm(bp_drop ~ dose * older, data = trial)
coef(fit_drug)
#> (Intercept)      dose     olderTRUE  dose:olderTRUE
#>         2.0      0.50          1.0           0.30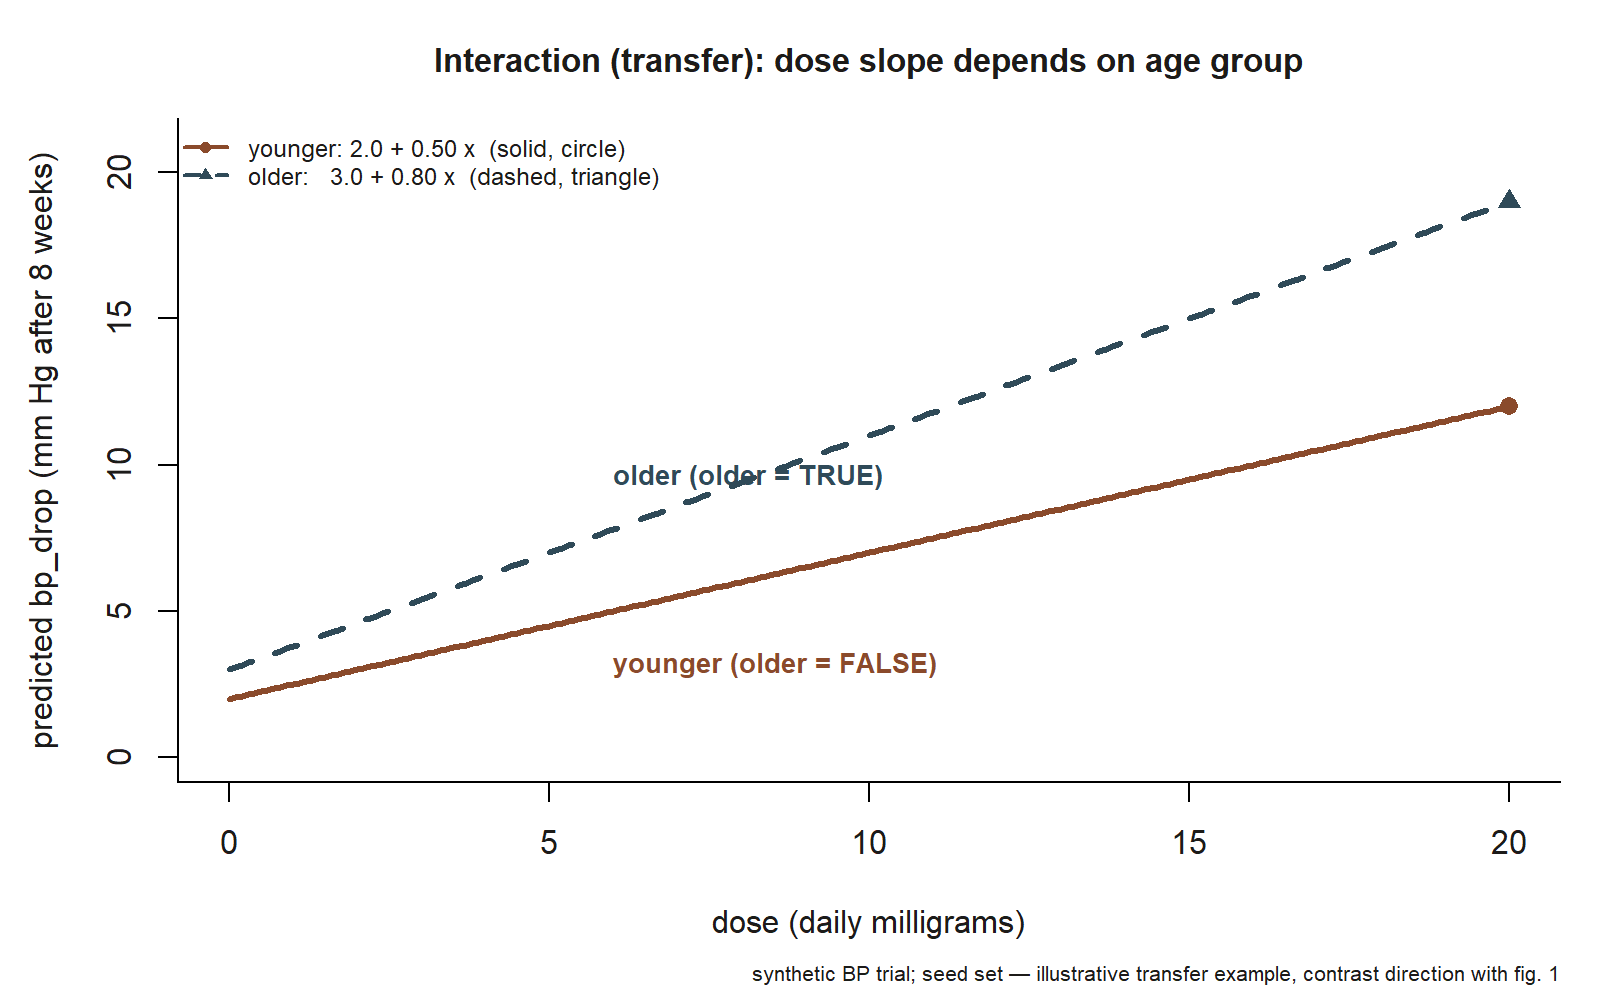
bp_drop against dose for younger patients (solid line, circle marker: intercept 2.0, slope 0.50) and older patients (dashed line, triangle marker: intercept 3.0, slope 0.80). Unlike the studyhabits example, where the non-worker line was steeper, the older-patient line is the steeper one — the same four-coefficient template, opposite sign on the product term (illustrative synthetic BP trial; seed set).
The within-group dose slopes are what we report. For younger patients (older \(= 0\)) the slope is \(0.50\): each extra milligram is associated with about a half-point larger BP drop. For older patients (older \(= 1\)) the slope is \(0.50 + 0.30 = 0.80\): each extra milligram is associated with about a \(0.80\)-point larger drop. Here the product-term coefficient is positive (\(+0.30\)), so the effect modification runs the other direction from the study example — the drug’s dose–response is steeper in older patients, not flatter. The mechanics are identical; only the sign and the story change. This is the payoff of learning to read within-group slopes: the same four-coefficient template tells you “studying helps workers less” in one context and “the drug helps older patients more” in another, and in both cases the honest report is two slopes and the difference between them, never a single averaged effect.
A common mistake
The most common error this week is interpreting the product-term coefficient by itself and never recovering the within-group slopes. A student sees study:worksTRUE = -1.2 and writes “the interaction is \(-1.2\), so studying hurts working students” — which is wrong twice over. First, \(-1.2\) is not a slope at all; it is the difference between two slopes, so it cannot tell you whether studying helps workers — it only tells you it helps them less than it helps non-workers. The worker slope is still \(+1.6\): studying helps, just less. Second, the worker slope is not on the page until you compute \(b_1 + b_3 = 2.8 - 1.2 =
1.6\); if you stop at the raw coefficient you have skipped the only number worth reporting. The fix is mechanical and reliable: always translate the coefficients into within-group slopes and state each one in a sentence before you draw a conclusion.
A close cousin of this mistake is confusing interaction with confounding. When the study slope looked different from week 3, students sometimes say “work status confounds the study effect.” But nothing here is being adjusted away — we are not claiming a single true slope is biased. We are claiming there are two different slopes, and that difference is the finding. Confounding would have us report one corrected slope; effect modification has us report two slopes on purpose. Misnaming the phenomenon leads to the wrong model move — adjusting (and collapsing to one slope) when you should be interacting (and keeping two), or the reverse.
A third, quieter slip is over-interpreting a main effect in an interaction model. The works coefficient \(-4.0\) describes the groups only at study \(= 0\); quoting it as “the effect of working” ignores that the gap between groups grows with study hours. In an interaction model, main effects are conditional — read them at a meaningful value of the other predictor, not in isolation.
Low-stakes self-checks (ungraded)
These are ungraded self-checks — no points, no submission, no answer key. Use them to test whether you can read an interaction, not just fit one.
- In
final ~ study * works, which single coefficient would have to be zero for workers and non-workers to share one study slope? What would the model look like geometrically if it were zero? - Using the locked coefficients (\(b_0 = 52.0\), \(b_1 = 2.8\), \(b_2 = -4.0\), \(b_3 = -1.2\)), write the worker slope and the non-worker slope, then say each one in a full sentence tied to study hours and exam points.
- Predict
finalatstudy\(= 5\) for a worker and a non-worker. Is the gap between them larger or smaller than it was atstudy\(= 10\)? Explain why in terms of the slopes. - A classmate says “the interaction coefficient is \(-1.2\), so studying is bad for working students.” Write one sentence that corrects them using the within-group slope.
- Decide for each phrasing whether it describes confounding or effect modification: (a) “the study slope drops once we hold
prior_gpaconstant”; (b) “the study slope is steeper for non-workers than for workers.” Say which model move each one calls for.
Reading and source pointer
Read ModernDive Chapter 6 (Multiple Regression), focusing on the sections that introduce interaction models — where two regression lines are allowed different slopes rather than forced parallel. ModernDive’s treatment of the modeling workflow (visualize the groups, fit, then interpret coefficients in context) is the posture to imitate here: plot final against study colored by works before you trust any coefficient, because the picture of two fanning lines is what the product term is encoding. These notes are the course’s own synthesis, grounded in but not copied from the sources.
Public vs. graded
These notes, the examples, and the practice here are public and ungraded — study material only. No graded prompts, answer keys, rubrics, point values, or due dates appear on this site. Graded modeling checkpoints, labs, quizzes, homework/modeling memos, the midterm, the project, and the final live in Blackboard (the LMS), which is authoritative for due dates, submissions, and grades. If this page and Blackboard ever disagree, follow Blackboard. There are no graded items on this page.
Looking ahead
Next week we turn from explanation to prediction and validation: once a model can be made arbitrarily flexible — adding interactions, polynomials, and many predictors — we need a way to tell genuine signal from fitting the noise, so we compare training fit against cross-validated error and meet overfitting head-on.
See also
- Week 6 — Multiple regression & adjustment — where the additive parallel-lines model and confounding first appear.
- Week 8 — Categorical predictors & group comparisons — indicator coding and group differences as intercept shifts, the additive cousin of this week.
- Week 10 — Prediction & validation — judging flexible models (interactions included) by out-of-sample error.
- Notation glossary and modeling reference — keep these open while you read.