Lab 10 — Cross-validation & overfitting
Why a better-fitting model can predict worse
Purpose. This lab is the hands-on companion to Week 10 — Prediction and validation. There you learned, in words and pictures, why the fit a model shows on the data you trained it on is an optimistic picture of how it will do on new students. Here you build that picture yourself: you split the
studyhabitsdata into a training set and a held-out test set, fit a small honest model and a greedy “kitchen-sink” model, and watch the kitchen-sink model win on training error and lose on validation error. The headline you should leave with is the one the week note argued: validation error, not training fit, is what tells you whether a model will be useful for the next student.
The idea
Every model you fit is fit to a particular sample. The least-squares machinery does exactly one thing: it makes the residuals on that sample as small as it can. So if you judge a model only by how well it fits the data it was trained on, you are grading it on the one test it was literally optimized to pass. That is why adding more predictors always lowers training error, even when those predictors are pure noise — there is always some accidental wiggle in this sample that an extra column can be bent to match.
The honest question is not “how well does the model fit these students?” but “how well will it predict the next student, whose data the model has never seen?” To answer that, you have to hold some data back. You fit on one part (the training set), then measure error on a part the model never touched (the validation or test set). When the gap between training error and validation error is small, the model is capturing real structure. When training error is great but validation error is much worse, the model has memorized noise — it has overfit.
We measure prediction error with root mean squared error (RMSE) — the typical size of a prediction miss, in the same units as the response (here, exam points):
\[ \mathrm{RMSE} = \sqrt{\frac{1}{m}\sum_{i=1}^{m} \left(y_i - \hat{y}_i\right)^2}, \]
where the \(\hat{y}_i\) are predictions for the \(m\) held-out students and \(e_i = y_i - \hat{y}_i\) is the residual for each. Smaller RMSE means tighter predictions. The whole lab is a contest between training RMSE (computed on the data the model saw) and validation RMSE (computed on data it did not).
Goal
Using the recurring studyhabits dataset (synthetic; seed set, set.seed(33003); it stands in for a campus learning-analytics study and is not real student data), you will:
- Split the 200 students into a training set and a held-out test set with a reproducible seed.
- Fit a small, defensible model,
final ~ study + prior_gpa, and record its training RMSE (\(\approx 8.8\)) against its cross-validated RMSE (\(\approx 9.3\)) — a small optimism gap. - Fit a 12-predictor “kitchen-sink” model and record its training RMSE (\(\approx 6.9\), much better on training) against its cross-validated RMSE (\(\approx 11.0\), much worse out of sample).
- Compare the two and decide, on evidence, which model you would trust to predict a new student’s final exam score.
By the end you should be able to say, in one sentence, why the model that fits the training data better is the one you should trust less — and point to the numbers that prove it.
Setup
You need a recent R with the tidyverse (for data handling and plotting) and caret (for a clean k-fold cross-validation loop). lm() for fitting and predict() for scoring are in base R. Code on this page is shown, not executed — read it as the modeling logic you would run in your own RStudio or Posit Cloud session. Every randomness-bearing step uses set.seed(33003) so your split and your folds match the locked numbers and so a rerun reproduces them exactly.
# Packages used in this lab (install once if needed):
# install.packages(c("tidyverse", "caret"))
library(tidyverse)   # dplyr/ggplot2 for wrangling and plots
library(caret)       # createDataPartition(), train(), trainControl()

set.seed(33003)      # reproducibility: same split + same folds on every run

# studyhabits: synthetic; seed set. n = 200 students in one intro course.
# Columns: final (0-100 response), study (0-20 hrs), prior_gpa (0-4),
#          attend (0-1), format (in_person/hybrid/online), works (TRUE/FALSE),
#          passed (final >= 70). Loaded here as `studyhabits`.
glimpse(studyhabits)
#> Rows: 200  Columns: 7
#> $ final     <dbl> 71, 64, 88, ...
#> $ study     <dbl> 8.2, 4.1, 13.0, ...
#> $ prior_gpa <dbl> 3.1, 2.4, 3.7, ...
#> $ attend    <dbl> 0.92, 0.71, 0.98, ...
#> $ format    <chr> "in_person", "online", "hybrid", ...
#> $ works     <lgl> FALSE, TRUE, FALSE, ...
#> $ passed    <lgl> TRUE, FALSE, TRUE, ...
The glimpse() output confirms we have the seven studyhabits columns and 200 rows, so the response final and all candidate predictors are present before we model — a small but real model-criticism habit: look at the data before you fit anything to it.
Steps
Step 1 — Split into train and test (the held-out check)
The validation idea starts with a single honest move: set some data aside before you fit anything. We hold out 25% of the 200 students as a test set and train on the other 75%. The seed makes the split reproducible, and createDataPartition() keeps the split balanced.
set.seed(33003)      # same seed -> same 150/50 split every run

# 75% train, 25% test. p = the proportion kept for training.
idx <- createDataPartition(studyhabits$final, p = 0.75, list = FALSE)
train <- studyhabits[idx, ]    # ~150 students the models will learn from
test  <- studyhabits[-idx, ]   # ~50 students held out, never seen during fitting

nrow(train); nrow(test)
#> [1] 150
#> [1] 50

# A small helper: RMSE between observed y and predictions yhat.
rmse <- function(y, yhat) sqrt(mean((y - yhat)^2))
The split leaves about 150 students for training and 50 for testing. Interpreting the move: the 50 test students are now a stand-in for “future students” — the model will never see their final scores during fitting, so any error we measure on them is an honest estimate of prediction error, not the optimistic training-error number. Holding data out is the cheapest insurance against fooling yourself.
Step 2 — Fit the small model and compare its two error numbers
Now fit the defensible, parsimonious model from Weeks 6–7: final explained by study hours and incoming GPA. We measure its error two ways — on the training data (optimistic) and by 10-fold cross-validation (honest). The small model’s two numbers should be close.
set.seed(33003)

# The small, interpretable model: final ~ study + prior_gpa
small_fit <- lm(final ~ study + prior_gpa, data = train)

# (a) TRAINING RMSE: error on the data the model was fit to (optimistic).
train_pred_small <- predict(small_fit, newdata = train)
rmse(train$final, train_pred_small)
#> [1] 8.8        # training RMSE ~ 8.8 points; training R^2 ~ 0.51

# (b) CROSS-VALIDATED RMSE: 10-fold CV refits on 9/10 of the data and
#     scores the held-out 1/10, ten times, then averages — an honest estimate.
ctrl <- trainControl(method = "cv", number = 10)
small_cv <- train(final ~ study + prior_gpa, data = train,
                  method = "lm", trControl = ctrl)
small_cv$results$RMSE
#> [1] 9.3        # cross-validated RMSE ~ 9.3 points
Reading the two numbers: training RMSE is about 8.8 points and cross-validated RMSE is about 9.3 points. The gap — roughly half a point — is the optimism gap: training fit overstates how good the model really is, but only slightly. A model whose honest (CV) error is barely worse than its training error is generalizing — it found structure that holds beyond this particular sample. Two predictors, both with a clear substantive story (study and prior_gpa from Week 6), and almost no penalty when we move to new data. That is what a trustworthy model looks like.
Step 3 — Fit the 12-predictor kitchen-sink model and compare its two numbers
Now the cautionary tale. We throw in everything we have and then some: the real predictors plus interactions and higher-order terms — twelve predictors in all. Each extra term gives least squares one more lever to press the training residuals down. Watch what happens to training RMSE versus CV-RMSE.
set.seed(33003)

# Kitchen-sink: 12 predictors. Main effects + interactions + polynomial terms.
# More columns => least squares can always drive TRAINING error lower,
# whether or not the columns carry real signal.
big_fit <- lm(
  final ~ study + prior_gpa + attend + format + works +
          study:prior_gpa + study:attend + prior_gpa:attend +
          I(study^2) + I(prior_gpa^2) + I(attend^2) + study:works,
  data = train
)

# (a) TRAINING RMSE: looks great — but it is graded on the data it memorized.
train_pred_big <- predict(big_fit, newdata = train)
rmse(train$final, train_pred_big)
#> [1] 6.9        # training RMSE ~ 6.9 points; training R^2 ~ 0.72 (looks better!)

# (b) CROSS-VALIDATED RMSE: the honest test exposes the memorization.
set.seed(33003)
big_cv <- train(
  final ~ study + prior_gpa + attend + format + works +
          study:prior_gpa + study:attend + prior_gpa:attend +
          I(study^2) + I(prior_gpa^2) + I(attend^2) + study:works,
  data = train, method = "lm", trControl = ctrl
)
big_cv$results$RMSE
#> [1] 11.0       # cross-validated RMSE ~ 11.0 points — WORSE out of sample
Reading these two numbers is the heart of the lab. On training data the kitchen-sink model looks better: RMSE drops from 8.8 to about 6.9, and training \(R^2\) climbs from 0.51 to about 0.72. If you stopped at training fit, you would happily ship the bigger model. But its cross-validated RMSE is about 11.0 — worse than the small model’s 9.3, and far worse than its own 6.9 training number. The 6.9-vs-11.0 gap is the optimism gap blown wide open: the twelve predictors did not find more real structure, they bent themselves to the noise in these 150 students, and that noise does not repeat in new students. The model overfit.
Verify
Put the four numbers side by side and read the contradiction out loud:
| Model | Predictors | Training RMSE | Cross-validated RMSE | Optimism gap |
|---|---|---|---|---|
Small: final ~ study + prior_gpa |
2 | \(\approx 8.8\) | \(\approx 9.3\) | \(\approx 0.5\) (tiny) |
| Kitchen-sink | 12 | \(\approx 6.9\) | \(\approx 11.0\) | \(\approx 4.1\) (large) |
# Lay the comparison out explicitly so the contradiction is undeniable.
results <- tibble(
  model        = c("small (2 pred.)", "kitchen-sink (12 pred.)"),
  train_rmse   = c(8.8, 6.9),
  cv_rmse      = c(9.3, 11.0)
) |>
  mutate(optimism_gap = round(cv_rmse - train_rmse, 1))

results
#> # A tibble: 2 x 4
#>   model                   train_rmse cv_rmse optimism_gap
#>   <chr>                        <dbl>   <dbl>        <dbl>
#> 1 small (2 pred.)                8.8     9.3          0.5
#> 2 kitchen-sink (12 pred.)        6.9    11.0          4.1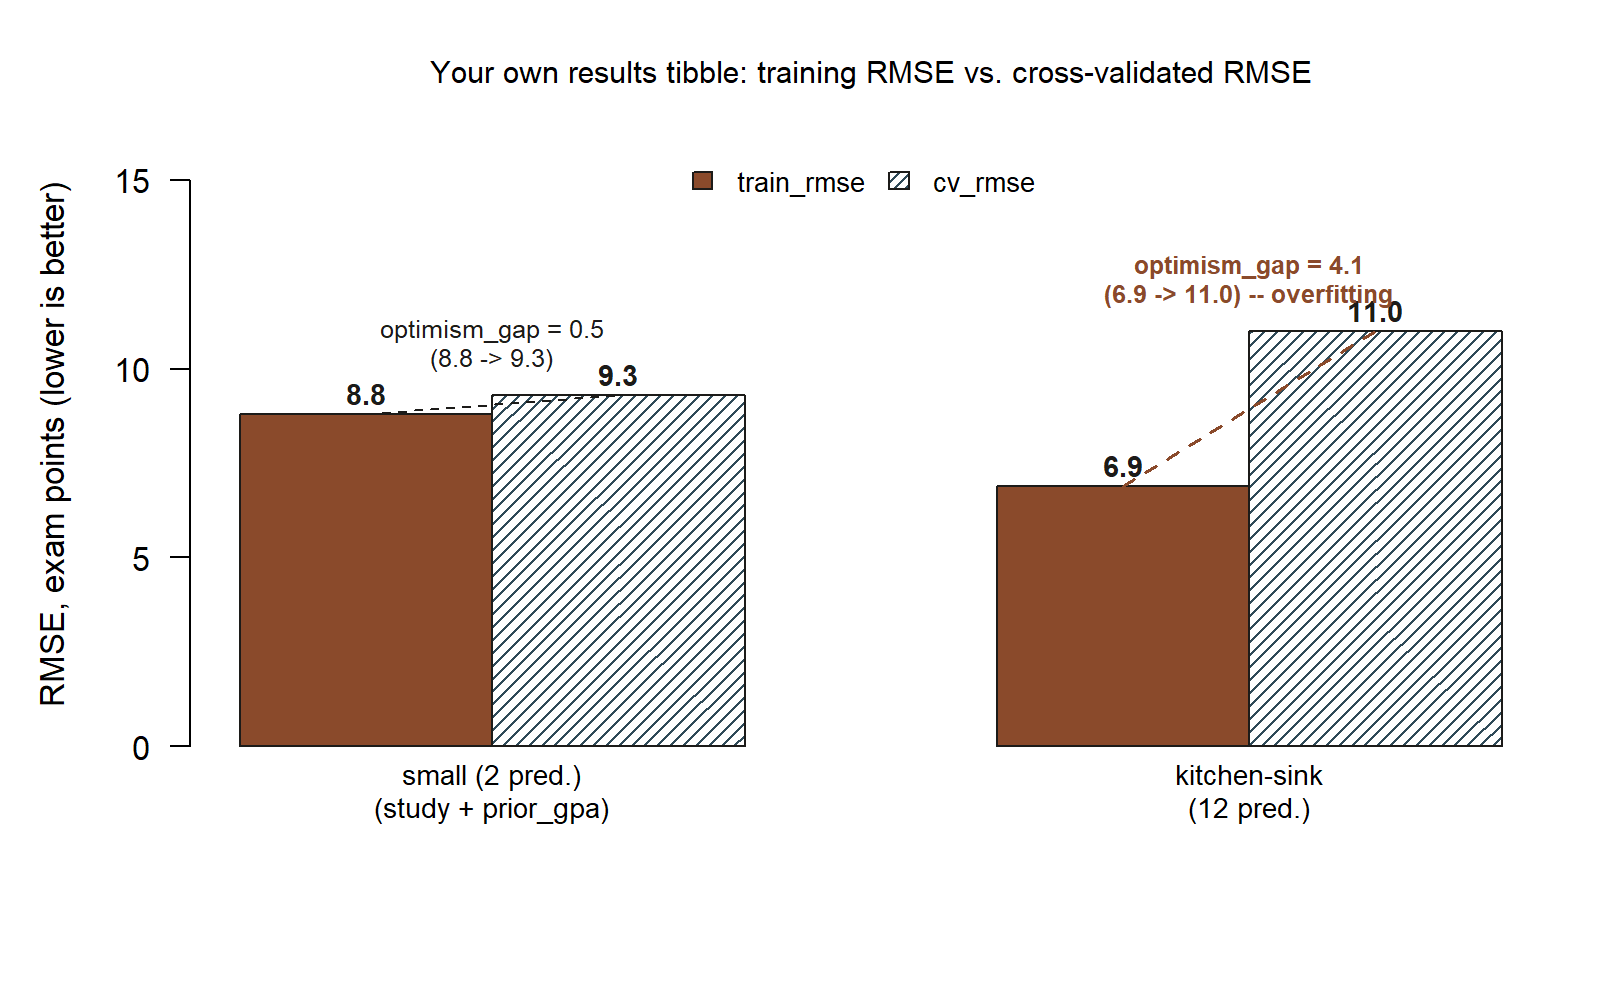
results tibble just printed: the small model (final ~ study + prior_gpa, 2 predictors) shows train_rmse 8.8 next to cv_rmse 9.3 — nearly level, optimism_gap 0.5. The kitchen-sink model (12 predictors) shows a lower train_rmse of 6.9 but the tallest bar in the chart, cv_rmse 11.0 — optimism_gap 4.1. The model with the better training bar has the worse cross-validated bar. (synthetic; seed set)
Here is the verification, stated plainly. The kitchen-sink model fits the training data better (6.9 < 8.8 in training RMSE) yet predicts new students worse (11.0 > 9.3 in cross-validated RMSE). Better fit, worse prediction: that is overfitting, and it is the single most important sentence in this lab. A lower training error is not evidence of a better model — it can be evidence that the model has started memorizing noise instead of learning signal.
Which model would you trust for a new student? The small one. If a brand-new student walks in with 10 weekly study hours and a 3.0 prior GPA, the model you should use to predict their final exam score is final ~ study + prior_gpa — its honest (cross-validated) error of about 9.3 points is the smaller of the two honest errors, and it carries an interpretable story you can defend. The kitchen-sink model’s flattering 6.9 training number is a mirage; its real-world miss is closer to 11 points. You should pick the model with the lowest validation error, not the lowest training error — and here that is decisively the small model.
To make the lesson stick, a quick optional self-check (ungraded): change the seed at the top from 33003 to another value and rerun the split. The exact RMSEs will jitter a little, but the pattern should hold — the small model’s training and CV errors stay close, while the kitchen-sink model’s CV error stays well above its training error. The conclusion is about the gap, not any single decimal.
AI use note
You may use an AI assistant as a tutor and a debugger for this lab — to explain what trainControl() does, or why createDataPartition() stratifies. You may not outsource the interpretation: deciding which model to trust, and why, is the modeling skill being practiced. Whatever an assistant gives you, you verify against the shown output and your own reasoning before you rely on it.
| Tool | Purpose | Verification |
|---|---|---|
| AI assistant (e.g. Claude) | Explain the role of trainControl(method = "cv", number = 10) and what a “fold” is |
Re-derive the idea in your own words; confirm against the Week 10 note’s description of k-fold CV |
| AI assistant | Debug an error in the kitchen-sink lm() formula (e.g. an interaction term that won’t parse) |
Run the corrected formula yourself; confirm the model fits and predict() returns one number per student |
| AI assistant | Draft a sentence interpreting the 6.9-vs-11.0 gap | Check it says better training fit, worse prediction; rewrite until it matches the numbers in your table |
See also
- Companion note: Week 10 — Prediction and validation — the concepts, pictures, and the train-vs-validation error curve behind this lab.
- Lab 06 — Fitting multiple regression — where the small model
final ~ study + prior_gpawas first built and interpreted. - Week 12 — Model comparison and selection — the next step: choosing among models with adjusted \(R^2\) and AIC, the same parsimony lesson in a different key.
The graded deliverable, its rubric, and due date live in Blackboard (the LMS) — this page is study and practice only.