Lab 2 — Visualizing relationships
Looking at the data before modeling
Purpose. Before you fit a single line, you look. This lab walks you through loading the recurring
studyhabitsdata and seeing howfinalrelates tostudyand to courseformat— reading form, direction, strength, and unusual points straight off a picture — so that when later weeks fit a model, the model confirms (or challenges) something you already understood by eye. It is the hands-on companion to Week 2 — Visualization and the modeling workflow.
The idea
A model is a structured claim about how variables relate. The fastest way to embarrass a model is to fit it to data you never looked at. A scatterplot answers, in one glance, the questions a regression line will later try to make precise: Is the cloud of points trending up or down? Does it follow a straight band or bend? Is the band tight or loose? Are there a few points sitting far from everyone else? Those four readings — form, direction, strength, outliers — are not decoration. They decide whether a straight-line model is even the right tool, and they set your expectations for the numbers the line will eventually report.
In this lab you do the seeing first. You will produce two kinds of picture: a scatterplot for two numeric variables (final vs. study), and a grouped boxplot for a numeric response across a categorical predictor (final by format). The scatterplot foreshadows the simple linear regression of Weeks 3–5; the boxplot foreshadows the categorical-predictor model of Week 8. You are not fitting anything yet — that is exactly the point. The discipline of graph before you model keeps the modeling honest: the picture is a prediction you make about what the model should say, and a model that contradicts a clean picture is a model you should distrust before you trust.
Everything here uses the course’s recurring teaching dataset, studyhabits. The data are synthetic; seed set (set.seed(33003)) — they stand in for a campus learning-analytics study of n = 200 students in one intro course, and they are not real student records. Because they are synthetic, the relationships you will see were built in on purpose, which makes this an ideal place to practice reading a picture: you can check your eye against what later weeks fit.
Goal
By the end of this lab you should be able to:
- Load the
studyhabitsdata into R andglimpse()its structure (rows, columns, variable types). - Build a scatterplot of the response
finalagainst the numeric predictorstudy, and read its form, direction, and strength in plain words. - Add a summary layer (a smooth trend) to a scatterplot to make the trend easier to see without committing to a fitted model yet.
- Build a grouped boxplot of
finalacross the categoricalformat, and compare group centers and spreads by eye. - State, in a sentence each, what these pictures lead you to expect a model to report — so that when Weeks 3–8 fit those models, you can check the model against your reading.
This is a modeling lab, not a plotting-syntax drill. The plots are in service of a statistical judgment: is a straight-line summary plausible here, and roughly how strong is it?
Setup
You need R with the tidyverse (for ggplot2 plotting and dplyr summaries). In this course the R you see on the site is shown as static, syntax-highlighted code — it is teaching code, not executed here — but it is real, runnable code you can paste into RStudio or Posit Cloud. Run the setup chunk once per session. We set a seed at the top of every script so that anything random (here, the synthetic data construction and any jitter) is reproducible: re-running gives the identical picture.
# Lab 2 setup — visualizing relationships
# Data are SYNTHETIC; seed set. Not real student data.
library(tidyverse)   # ggplot2 + dplyr + friends
set.seed(33003)      # reproducibility: same seed -> same synthetic data and same plots

# Load the recurring teaching dataset (synthetic; n = 200 students, one intro course).
# In the live course this reads the provided file; here we show the load idiom.
studyhabits <- read_csv("data/studyhabits.csv")
If read_csv() is new to you, it is the tidyverse reader for comma-separated files and returns a tibble (a tidy data frame). The one thing to confirm before any plotting: the data came in with the right shape and the right types. A numeric column read as text will quietly break every plot and model downstream, so we check types first and trust nothing until we have looked.
Steps
Step 1 — Load the data and glimpse its structure
The first move in any modeling workflow is to meet the data: how many rows, how many columns, what is each column’s type, and do the values look sane. glimpse() prints one line per variable — its name, its type, and the first few values — which is the fastest sanity check for a small teaching dataset.
# Step 1: meet the data before plotting anything
glimpse(studyhabits)
#> Rows: 200
#> Columns: 7
#> $ final     <dbl> 70, 83, 64, 77, ...   # final exam score, 0-100 (the response)
#> $ study     <dbl> 7.2, 12.1, 3.8, ...   # average weekly study hours (main predictor)
#> $ prior_gpa <dbl> 2.8, 3.5, 2.1, ...    # incoming GPA, 0-4
#> $ attend    <dbl> 0.91, 0.97, 0.74, ... # proportion of classes attended, 0-1
#> $ format    <chr> "in_person", "online", "hybrid", ...   # section format
#> $ works     <lgl> FALSE, FALSE, TRUE, ...  # works a job >= 15 hr/week
#> $ passed    <lgl> TRUE, TRUE, FALSE, ...   # passed the course (final >= 70)

# A quick five-number-style look at the two variables we'll plot first
summary(studyhabits$final)
summary(studyhabits$study)
Read the glimpse output as a sentence: we have 200 students and 7 variables; final and study are numeric (<dbl>), format is categorical text (<chr>), and works/passed are logical (<lgl>). That matches the data dictionary, so we can proceed. If final had come in as <chr> we would stop and fix the read before plotting, because ggplot would otherwise treat a numeric score as 100-odd unordered categories. The interpretation move here is small but real: confirming types is the first act of model criticism — you are checking that the data can support the kind of model you intend.
Step 2 — Scatter final vs. study, then add a summary trend
Now the central picture. Put the response on the y-axis (final) and the predictor on the x-axis (study) — that orientation matters because in Weeks 3–5 the regression line predicts final from study, and a scatterplot drawn the same way makes the eventual line easy to overlay. First draw the raw points; then add a smooth summary so the trend is unmistakable.
# Step 2a: the raw scatter — response (final) on y, predictor (study) on x
ggplot(studyhabits, aes(x = study, y = final)) +
  geom_point(alpha = 0.6) +                       # alpha to reveal overplotting
  labs(
    x = "Average weekly study hours (study)",
    y = "Final exam score (final)",
    title = "Final vs. study (synthetic; seed set, n = 200)"
  )

# Step 2b: add a summary layer — a smoother — to SEE the trend without fitting a reported model.
# loess is a flexible, local smoother: it shows the shape of the relationship, not a committed line.
ggplot(studyhabits, aes(x = study, y = final)) +
  geom_point(alpha = 0.6) +
  geom_smooth(method = "loess", se = TRUE) +      # se = TRUE shades pointwise uncertainty
  labs(
    x = "Average weekly study hours (study)",
    y = "Final exam score (final)",
    title = "Final vs. study with a loess summary (synthetic; seed set)"
  )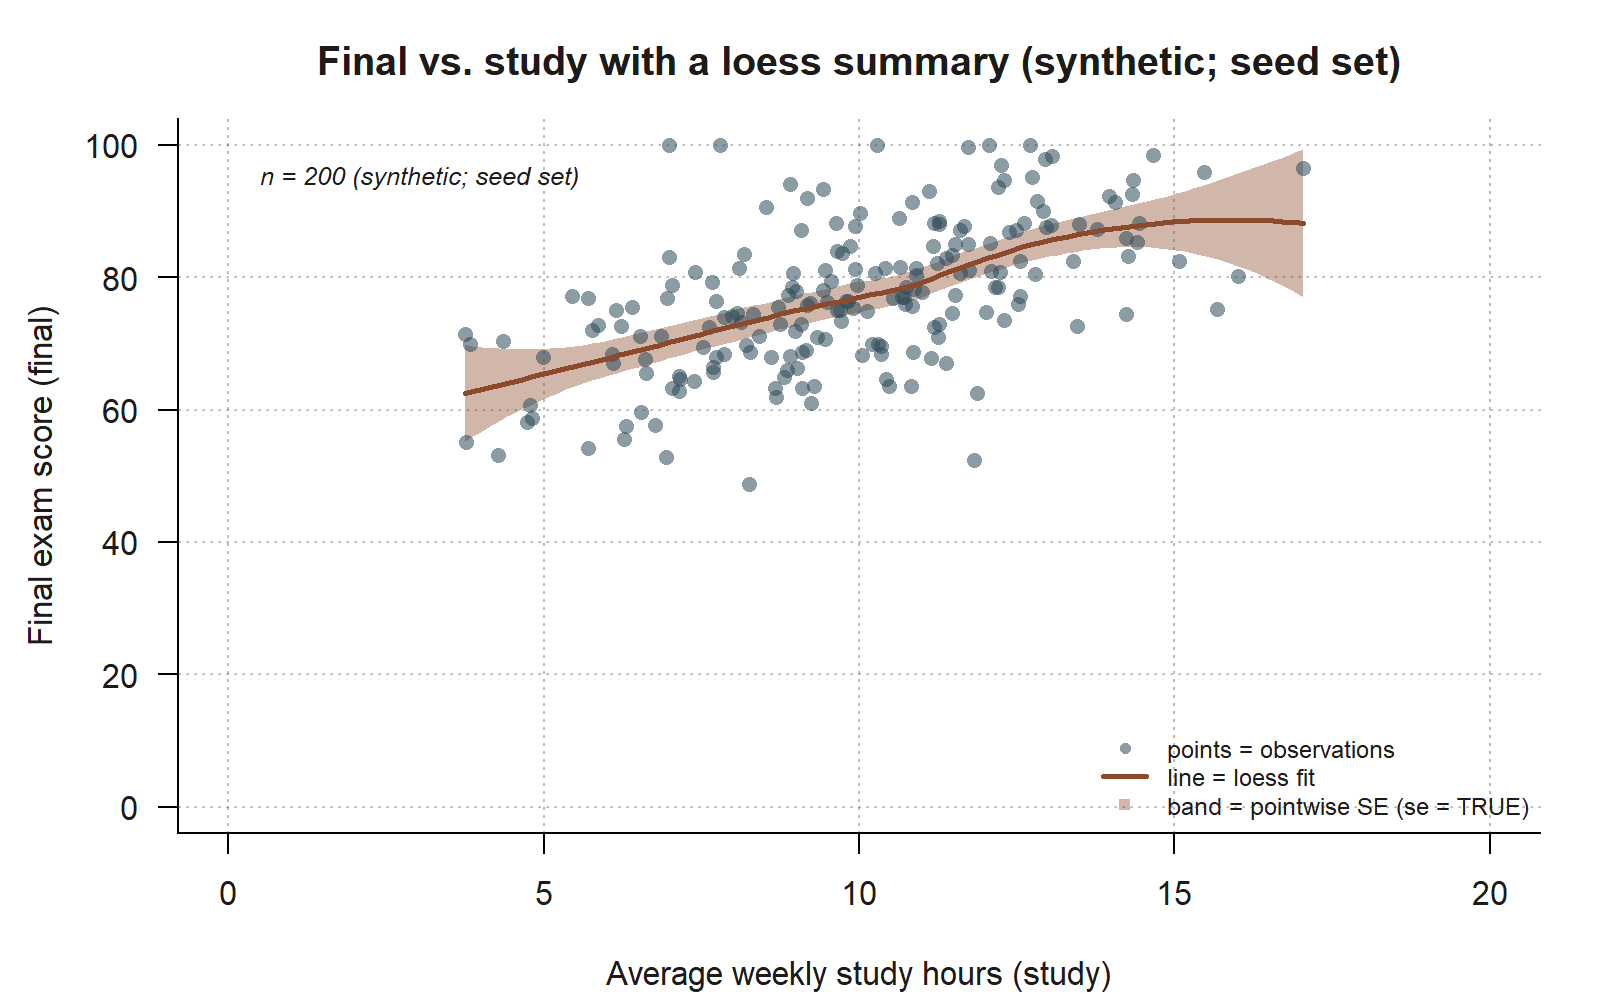
final-vs-study cloud with a loess summary and its pointwise SE band. Each of the 200 synthetic studyhabits points is plotted as in Step 2a; the added rust curve is a loess smoother (the shown Step 2b code, geom_smooth(method = "loess", se = TRUE)) tracing the local trend without committing to a straight-line model, and the shaded band around it is the pointwise standard-error band that se = TRUE draws. The curve runs roughly straight and upward across almost the whole range, with a slight widening of the band at the low- and high-study ends where fewer students sit — a visual match for the moderate, roughly linear association (\(r \approx 0.58\); synthetic; seed set) you are about to name in words below.
Now read the picture in the four-part vocabulary, and write each reading as a sentence:
- Form: the smoother runs roughly straight across the bulk of the data — there is no obvious bend — so a straight-line (linear) summary looks plausible, which is exactly what Weeks 3–5 will fit.
- Direction: the cloud trends upward from lower-left to upper-right — more study hours go with higher final scores, a positive association.
- Strength: the points form a clear band but a fairly wide one — the trend is real but moderate, not tight. Translating “moderate positive and roughly linear” into a number, you should expect a correlation somewhere around \(r \approx 0.58\) when Week 4 computes it — strong enough to see, loose enough that study alone will not pin down a student’s score.
- Outliers / unusual points: scan for points far above or below the band, or far to the right on the x-axis (high-leverage). Flag any you see; they are candidates for the residual diagnostics of Week 5, where an unusual point gets formally checked rather than eyeballed.
A note on the smoother: we used loess on purpose. A loess curve describes the local shape without asserting “this is the model.” If you had instead added geom_smooth(method = "lm") you would already be drawing the Week-3 regression line — useful later, but premature now. The reason to look at a flexible smoother first is precisely model criticism: if the loess curve had bent sharply, a straight line would be the wrong model and you would want to know before you fit it, not after.
Step 3 — Grouped boxplot of final by format
The third picture switches predictor type. format is categorical (in_person, hybrid, online), so a scatterplot is the wrong tool; the right comparison-of-groups picture is a boxplot per group. Each box shows a group’s median and middle-half spread, so you can compare centers and spreads across formats side by side — which foreshadows the categorical-predictor model final ~ format in Week 8.
# Step 3: compare the response across a categorical predictor with grouped boxplots
ggplot(studyhabits, aes(x = format, y = final)) +
  geom_boxplot(outlier.alpha = 0.5) +
  # overlay the group MEANS (red diamonds) — the boxplot shows medians, but the Week-8
  # model compares group MEANS, so we mark them to match what the model will report
  stat_summary(fun = mean, geom = "point",
               shape = 18, size = 3, color = "red") +
  labs(
    x = "Course section format",
    y = "Final exam score (final)",
    title = "Final by format (synthetic; seed set)"
  )

# A matching numeric summary, so the eye and the table agree
studyhabits %>%
  group_by(format) %>%
  summarise(
    n        = n(),
    mean_final = mean(final),
    sd_final   = sd(final)
  )
#> # A tibble: 3 x 4
#>   format        n mean_final sd_final
#>   <chr>     <int>      <dbl>    <dbl>
#> 1 in_person   ...       78.0      ...
#> 2 hybrid      ...       75.0      ...
#> 3 online      ...       71.0      ...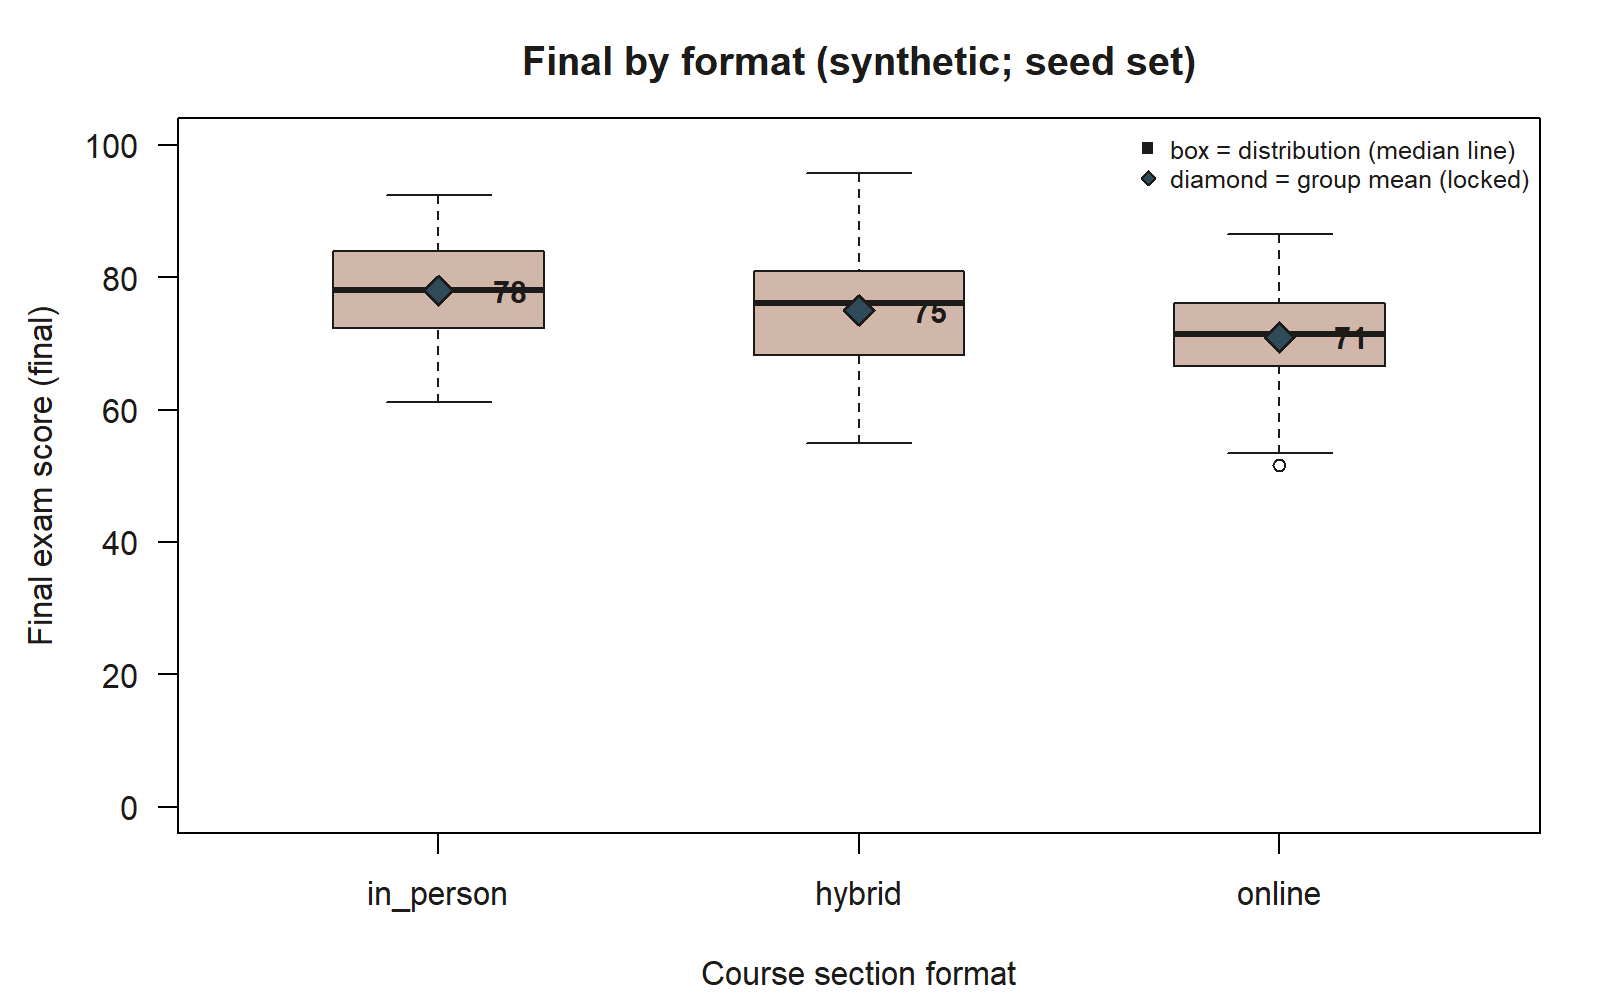
final by format, with group means marked as diamonds. Each box shows one format’s distribution of final exam scores as drawn by the shown geom_boxplot() code; the filled blue diamonds are the stat_summary(fun = mean, ...) layer, marking the group means at 78 (in_person), 75 (hybrid), and 71 (online) — synthetic; seed set — printed beside each marker so the mean is legible independent of the box’s own median line. The three boxes step downward left to right, and one low outlier point sits below the online whisker.
Read this picture as a sentence too: the in_person group sits highest, the hybrid group a few points lower, and the online group lowest, with group mean finals of about 78, 75, and 71 respectively. Notice the ordering and the gaps — in_person to hybrid is a small drop (about 3 points), in_person to online a larger one (about 7 points). Those exact gaps are what the Week-8 model final ~ format will report as coefficients: with in_person as the baseline, the hybrid coefficient is the 78-to-75 difference and the online coefficient is the 78-to-71 difference. Seeing them as separations between boxes now means the model’s coefficients later will read as named distances you already noticed, not as mysterious output.
One honest caution to write down: this boxplot compares raw group means. It does not adjust for the fact that students did not choose their format at random — online students might, for example, study fewer hours or work more. So the picture shows an association, not a clean causal effect of format. That distinction (crude vs. adjusted comparison) is the engine of Weeks 6–7; for now, the job is only to see the group differences clearly and state them as associations.
Verify
You have not fit a model, but you have made several testable predictions. Verification here means checking that your reading of the pictures lines up with what later weeks fit — and noting any place it does not.
- The scatter foreshadows Week 4. You read
finalvs.studyas positive, moderate, roughly linear. When Week 4 computes the correlation it should land near \(r \approx 0.58\) (\(R^2 \approx 0.34\)). If your loess curve looked straight and rising, that number should feel right rather than surprising. A clean check: a moderate \(r\) near 0.58 means study explains about a third of the variation in final scores and leaves about two-thirds unexplained — consistent with the wide band you saw. - The boxplot foreshadows Week 8. You read group means of about 78 / 75 / 71 for
in_person/hybrid/online. The Week-8 modelfinal ~ formatusesin_personas baseline and should report ahybridcoefficient near \(-3\) and anonlinecoefficient near \(-7\) — exactly the 78-to-75 and 78-to-71 gaps you measured by eye. If those signs and sizes match, your picture and the model agree. - Sanity, not precision. Your eyeballed strength and gaps will not be exact, and they should not be — the verification is directional: right sign, right rough size, right form. A picture that said “downward” or “sharply curved” while the model says “positive and linear” would be the alarm worth chasing, and chasing it is model criticism.
If all three readings hold, you have done the lab’s real work: you understood the relationship before the model, so the model becomes confirmation you can trust rather than output you must take on faith.
AI use note
You may use an AI assistant as a tutor for the mechanics of this lab — plotting syntax, an error message, a tidyverse idiom — but the statistical reading of every picture must be your own, and you must verify whatever the assistant produces. Treat AI output as a draft to check, never as an answer to copy.
| Tool | Purpose | Verification |
|---|---|---|
| Chatbot assistant (e.g., an LLM) | Explain a ggplot2 or dplyr error, or suggest the layer name for adding a smoother/means |
Run the corrected code yourself; confirm the plot renders and the layer does what you intended; compare against the shown idiom in this lab |
| AI code helper / IDE autocomplete | Draft boilerplate (axis labels, group_by + summarise scaffold) |
Read every generated line; confirm variable names match the data dictionary and that final is on y, study on x |
| AI “interpret my plot” prompt | Get a second opinion on form/direction/strength | Do not outsource the reading — write your own four-part reading first, then check the AI’s against yours and against the later-week numbers (\(r \approx 0.58\); means 78/75/71) |
The rule of thumb: AI can help you make the picture faster, but the judgment about what the picture means for the model is the skill this course is teaching, so keep it in your own hands and verify against the locked course numbers.
See also
- Companion note: Week 2 — Visualization and the modeling workflow — the concepts behind form/direction/strength and graph before you model.
- Looking ahead: Week 3 — Simple linear regression fits the line you foreshadowed here (\(\hat{y} = 52.0 + 2.5\,x\)); Week 4 — Interpreting regression output reports the \(r \approx 0.58\) you read by eye; Week 8 — Categorical predictors and group comparisons turns the boxplot gaps into model coefficients.
- Reference: Notation glossary for \(y\), \(x\), \(r\), \(R^2\), and \(\hat{y}\).
The graded deliverable, its rubric, and due date live in Blackboard (the LMS) — this page is study and practice only.