Week 3 — Simple linear regression
Fitting a line, and what “best” means
The week question
What line best summarizes how final changes with study, and what exactly do we mean by “best”?
Last week you learned to look before you model — to draw the scatterplot of final against study and read its shape, direction, and spread by eye. A cloud of points hints at a relationship, but a hint is not yet a claim. This week we make the claim precise. We summarize the whole cloud with a single straight line, we write that line as an equation you can read and defend, and we settle on one specific rule for choosing it among the infinitely many lines we could have drawn. That rule — least squares — is the quiet engine under almost everything that follows in this course, so it is worth slowing down for.
A short calendar note: Labor Day falls on Monday, September 7, so there is no Monday class this week and we meet only Wednesday and Friday. The topic does not shrink to match the calendar. We still cover simple linear regression in full — the line, the fitting criterion, and the residuals — just over two meetings instead of three. Read this note before Wednesday and again after Friday; the compressed week rewards preparation.
Why this matters
Simple linear regression is the first model in this course that is genuinely a model — a compact, structured statement about how one variable moves with another, fit to data by an explicit rule and open to criticism. Almost every later technique is this idea wearing more clothes. Multiple regression adds predictors to the same line-fitting logic. Logistic regression bends the line to respect a yes/no outcome. Model comparison asks whether a richer line was worth its added parts. If the simple line is solid in your hands — if you can fit it, write it, read its two numbers, and say what “best” buys you — the rest of the course has somewhere firm to stand.
It also matters because the line is a summary, and every summary discards something. The line replaces two hundred students with two numbers. That trade is the point: a good summary is honest about the trend while admitting it is not the whole story. The gap between what the line predicts and what actually happened — the residual — is not an embarrassment to hide. It is information, and learning to take it seriously now is what separates fitting a model from understanding one.
Learning goals
By the end of this week you should be able to:
- Write the fitted regression line in the form \(\hat{y} = b_0 + b_1 x\) and name each piece in plain words.
- State the least-squares criterion — minimize the sum of squared residuals — and say why squaring, rather than just adding up errors, is what makes the criterion work.
- Fit
final ~ studywithlm()and read the intercept and slope from the output. - Interpret the slope as a change (a per-unit rate), not as a score, and interpret the intercept while flagging when it is extrapolation.
- Compute a fitted value \(\hat{y}\) for a given
studyvalue and the residual \(e = y - \hat{y}\) for a specific student, and say what each one means. - Carry the same logic to a new context, recognizing that the line and “best” mean the same thing there.
Core vocabulary
- Fitted (regression) line — the line \(\hat{y} = b_0 + b_1 x\) that the fitting rule selects to summarize how the response moves with the predictor.
- Intercept \(b_0\) — the predicted response when the predictor equals zero; the height where the line meets the \(y\)-axis.
- Slope \(b_1\) — the predicted change in the response for a one-unit increase in the predictor; the steepness and direction of the line.
- Fitted value \(\hat{y}\) — the line’s prediction of the response at a given predictor value.
- Residual \(e = y - \hat{y}\) — the vertical gap between an observed point and the line; what the line missed for that observation.
- Least squares — the rule that chooses \(b_0\) and \(b_1\) to make the sum of squared residuals as small as possible.
- \(\beta_0, \beta_1\) vs. \(b_0, b_1\) — the Greek letters are the true (unknown) parameters of the population relationship; the Roman letters are the estimates we compute from our sample.
Concept development
1. The line: \(\hat{y} = b_0 + b_1 x\)
A simple linear regression model proposes that, on average, the response rises or falls steadily with the predictor. We write the fitted version as
\[\hat{y} = b_0 + b_1 x.\]
Read this as a recipe: take a predictor value \(x\), multiply it by the slope \(b_1\), add the intercept \(b_0\), and the result \(\hat{y}\) is the line’s best guess for the response at that \(x\). The hat on \(\hat{y}\) is doing real work — it marks a predicted value produced by the model, distinct from an actual observed \(y\) sitting in the data. Two observed students with the same study value have the same \(\hat{y}\) but almost certainly different \(y\)’s; the line gives one prediction, reality supplies the scatter around it.
It helps to separate two layers. There is a population-level idea, written with Greek parameters as \(y = \beta_0 + \beta_1 x + \varepsilon\), where \(\beta_0\) and \(\beta_1\) are the true intercept and slope we would love to know and \(\varepsilon\) is the irreducible scatter. We never see those true values. What we do is fit a line to our sample and obtain estimates \(b_0\) and \(b_1\) (equivalently \(\hat\beta_0\) and \(\hat\beta_1\)). The Roman-letter line is our best reconstruction of the Greek-letter truth from finite, noisy data. Keeping the two layers distinct is what makes later talk of uncertainty — standard errors, confidence intervals — make sense.
2. Least squares: minimize the sum of squared residuals
Infinitely many lines pass through a cloud of points. To pick one, we need a rule that scores how badly a candidate line misses, and then we choose the line with the smallest score. For each observation, the miss is the residual \(e_i = y_i - \hat{y}_i\) — vertical distance from the point to the line, positive when the point sits above and negative when below. A natural first instinct is to add up the residuals, but that fails immediately: positives and negatives cancel, so a wildly wrong line can score zero. The fix is to square each residual before summing, which makes every miss count as positive and penalizes large misses much more than small ones. The least-squares line is the one that minimizes
\[\text{SSR} = \sum_{i=1}^{n} (y_i - \hat{y}_i)^2 = \sum_{i=1}^{n} e_i^2.\]
Why squaring rather than, say, absolute value? Three reasons worth holding onto. Squaring makes the criterion smooth, so calculus delivers a clean closed-form solution for \(b_0\) and \(b_1\) — no searching. It penalizes a residual of 10 four times as much as a residual of 5, so the line works hard to avoid big misses. And it connects directly to the variance-and-correlation machinery you already met, which is why the slope turns out to be tied to the correlation \(r\) between the variables. The phrase “line of best fit” is shorthand for exactly this: best in the least-squares sense. Change the criterion and you would, in general, get a different line — so whenever you say a line is “best,” you are implicitly naming the rule.
3. Fitted values and residuals: \(e = y - \hat{y}\)
Once the line is fixed, it splits every observed response into two parts: the part the line explains and the part it misses. The explained part is the fitted value \(\hat{y} = b_0 + b_1 x\); the missed part is the residual \(e = y - \hat{y}\). Rearranged, this says \(y = \hat{y} + e\) — every observation is its prediction plus its residual, exactly. A positive residual means the student did better than the line predicted from their study hours; a negative residual means worse. Residuals near zero mean the line nailed that student.
The residuals are not leftover trash. They are the raw material for judging whether the line is any good. A least-squares fit guarantees the residuals sum to zero and have no leftover linear trend with \(x\) — that is what “best fit” forces — but it guarantees nothing about whether a straight line was the right shape, whether the scatter is even across the range, or whether one strange student is dragging the line around. Those questions are answered by looking at the residuals, which is the whole business of Week 5. For now, hold the idea that the line and its residuals are a matched pair: the line is the summary, the residuals are the honest record of what the summary left out.
Worked examples
Worked example — fitting final ~ study on studyhabits
We use the recurring studyhabits dataset: \(n = 200\) students in one intro course (synthetic; seed set, set.seed(33003) — it stands in for a campus learning-analytics study, not real student records). The response is final (exam score, 0–100) and the predictor is study (average weekly study hours). We fit the simple linear regression with lm():
set.seed(33003)
fit <- lm(final ~ study, data = studyhabits)
summary(fit)
#> Coefficients:
#>             Estimate Std. Error t value Pr(>|t|)
#> (Intercept)    52.00       ...     ...      ...
#> study           2.50      0.25   10.00   <2e-16
#>
#> Residual standard error: 9.0 on 198 degrees of freedom
#> Multiple R-squared: 0.34
The fitted line is
\[\hat{y} = 52.0 + 2.5\,x, \qquad x = \texttt{study}.\]
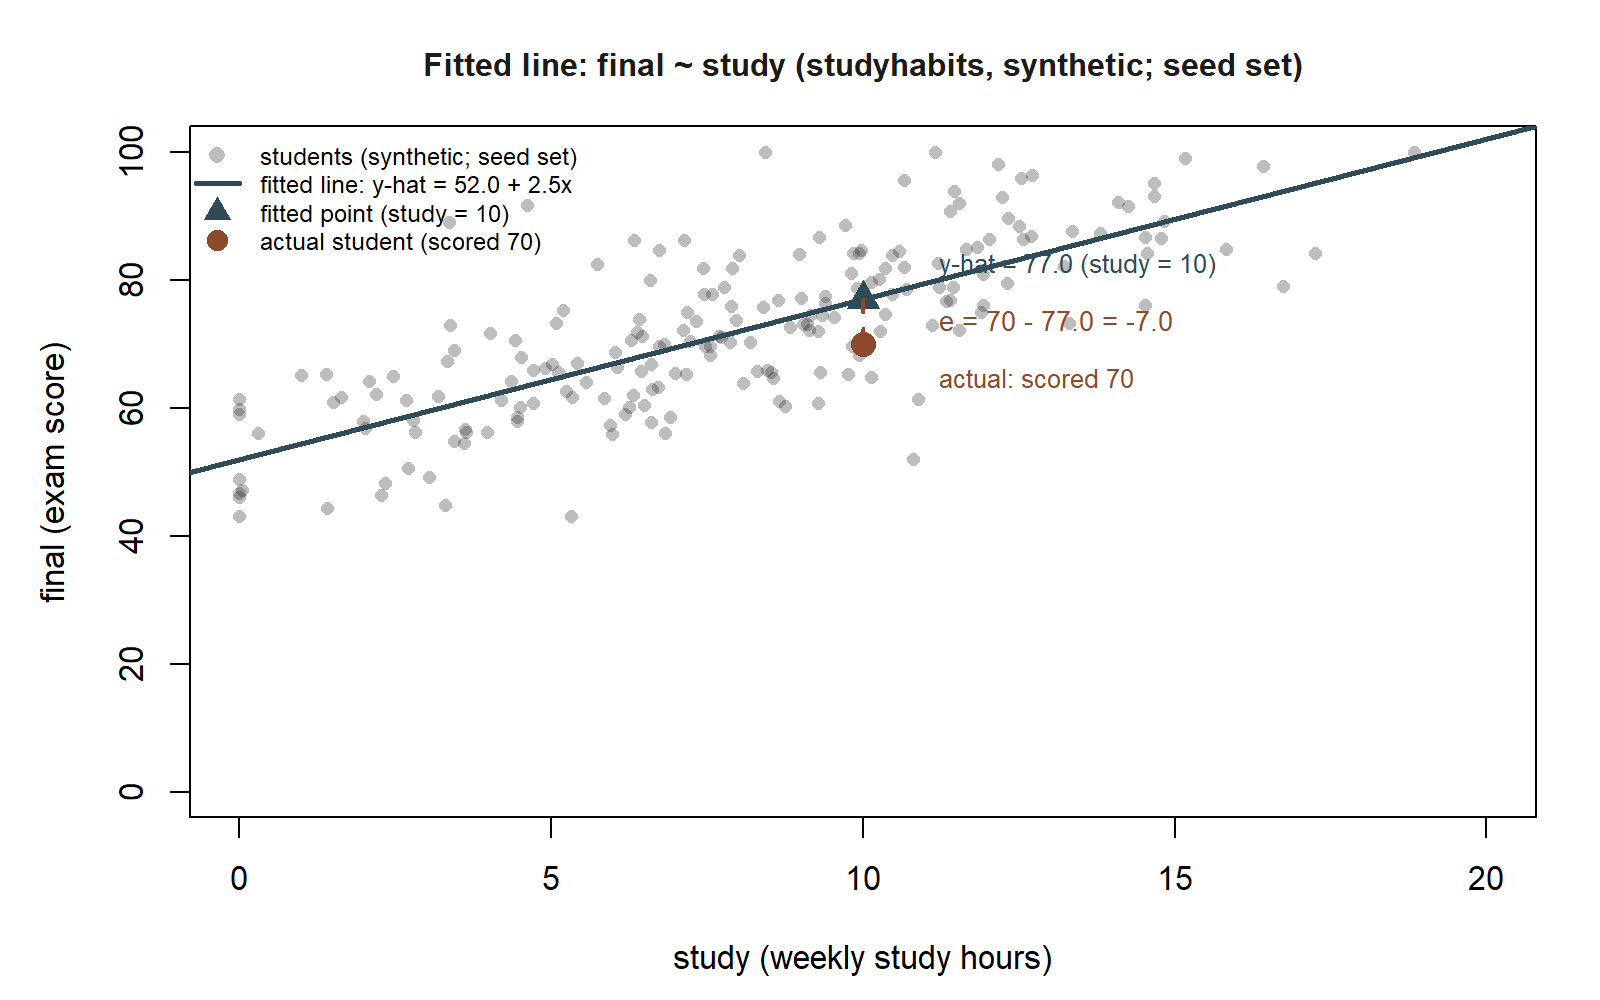
final ~ study, with one student’s residual made visible. The gray cloud is the recurring studyhabits data (synthetic; seed set, set.seed(33003)); the line is \(\hat{y} = 52.0 + 2.5x\). The triangle marks the fitted value at study = 10 (\(\hat{y} = 77.0\)); the circle marks a student who actually studied 10 hours and scored 70. The dashed vertical segment between them is that student’s residual, \(e = 70 - 77.0 = -7.0\).
Read the two numbers carefully, because reading them well is most of the skill.
The slope \(b_1 = 2.5\). Each additional weekly study hour is associated with a \(2.5\)-point higher predicted final exam score, on average. The slope is a rate of change, not a score: it does not say a student who studies earns 2.5 points; it says that comparing students who differ by one study hour, the line predicts a 2.5-point difference in final. The sign is positive, matching the upward scatter we saw last week, and the word “associated” is deliberate — this is observational synthetic data, so we describe a pattern, not a guaranteed effect of making a student study more.
The intercept \(b_0 = 52.0\). This is the line’s prediction at study = 0 — a student who studies zero hours per week is predicted to score 52.0. Flag this as extrapolation: study hours of essentially zero sit at or beyond the edge of where our data live, so the intercept is the line’s arithmetic, not a trusted claim about real non-studiers. The intercept anchors the line’s height; treat it as a literal prediction only when \(x = 0\) is genuinely inside the data, which here it is not.
Now use the line. A student who studies 10 hours per week has predicted final
\[\hat{y} = 52.0 + 2.5(10) = 77.0.\]
So the line expects roughly 77 points for a 10-hour-per-week student — a value comfortably inside the data range, so this prediction we can take at face value. Suppose one such student actually scored 70. Their residual is
\[e = y - \hat{y} = 70 - 77.0 = -7.0,\]
a negative residual: this student scored 7 points below what the line predicted from their study hours. The line summarizes the crowd; this individual fell short of its expectation, and that 7-point gap is exactly the kind of leftover we will scrutinize when we turn to diagnostics. The fit also reports a residual standard error of \(s = 9.0\) and \(R^2 = 0.34\) — a typical miss of about 9 points and roughly a third of the variation in final accounted for by study. We only name these here; reading them carefully is Week 4’s job.
Worked example — a transfer line: rent ~ size
To see that the line and the meaning of “best” travel, picture a fresh, unrelated context: monthly apartment rent (dollars) regressed on size (square feet) for a synthetic set of listings. Fitting lm(rent ~ size, data = listings) would produce its own least-squares line, say \(\hat{y} = 400 + 1.5\,x\).
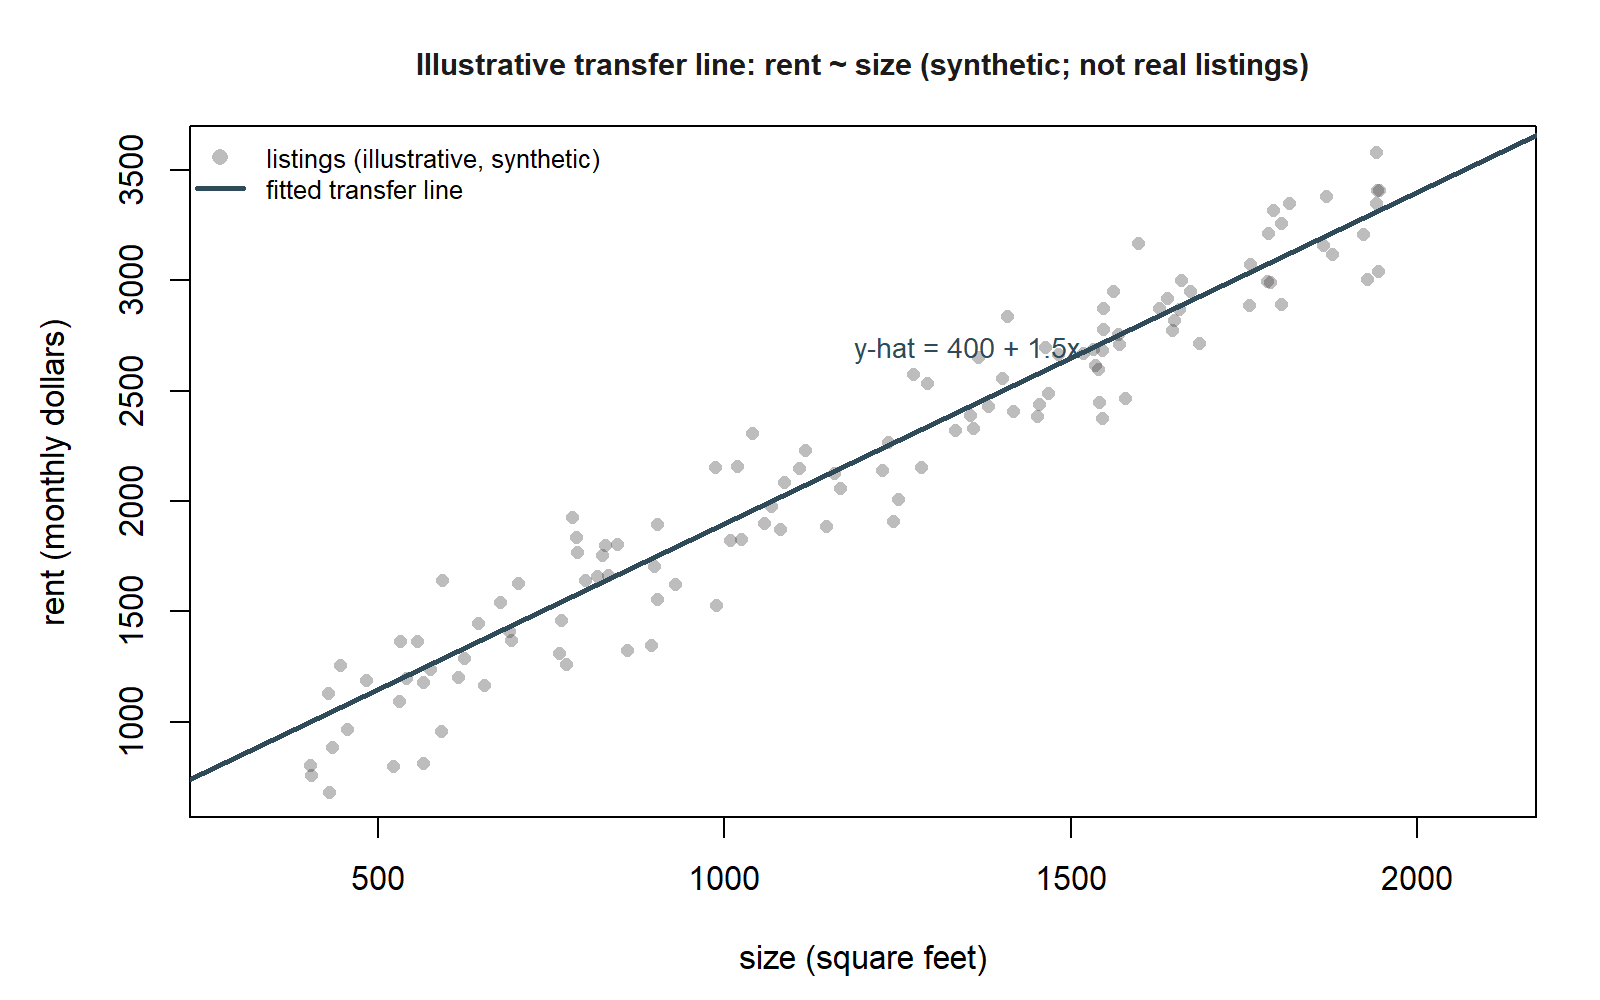
rent regressed on size. This is a purely illustrative pattern for a synthetic set of listings — no real listings data — showing the same kind of upward cloud with the fitted line \(\hat{y} = 400 + 1.5x\) drawn through it, matching the slope and intercept named in the prose above.
Here the slope of \(1.5\) means each additional square foot is associated with about \(\$1.50\) more in predicted monthly rent, on average — again a change per unit, not a price tag stamped on a single apartment. The intercept of \(\$400\) is the predicted rent at size = 0 square feet, which is physically meaningless and pure extrapolation, so we do not interpret it literally. The fitting rule is identical: choose the line that minimizes the sum of squared vertical residuals between each listing’s actual rent and the line’s prediction. Different variables, different units, same line and same definition of “best” — that portability is the whole reason the simple line is worth mastering.
A common mistake
Two related slips trip up almost everyone this week.
Reading the slope as a score instead of a change. Seeing \(b_1 = 2.5\), students sometimes say “studying is worth 2.5 points” as though the number attaches to a single person. It does not. The slope is a comparison: line up students who differ by one weekly study hour and the predictions differ by 2.5 points. It is a rate, a per-unit difference, with the words “per extra study hour, on average” baked in. Drop those words and you have quietly turned a relationship between variables into a personal reward, which the model never claimed.
Interpreting the intercept literally when \(x = 0\) is outside the data. The intercept \(b_0 = 52.0\) is the prediction at zero study hours, but our students cluster well above zero, so zero is extrapolation — the line’s behavior out where we have no evidence. Announcing “a student who never studies will score 52” treats a mathematical anchor as a verified fact about a region the data never visited. Always check whether \(x = 0\) is genuinely inside the observed range before you read the intercept as a real prediction; when it is not, report the number, label it extrapolation, and move on.
Low-stakes self-checks (ungraded)
These are ungraded self-checks — no points, no submission. Use them to test your grip on the ideas.
- In your own words, what does “least squares” minimize, and why do we square the residuals instead of just summing them?
- Using \(\hat{y} = 52.0 + 2.5\,x\), predict
finalfor a student who studies 6 hours per week. Is that \(x\) inside the data range, and does that change how much you trust the prediction? - A student studies 8 hours and scores 80. Compute their fitted value and their residual, and say in one sentence whether they over- or under-performed the line.
- A classmate writes “the intercept means a student who never studies scores 52.” Rewrite the sentence so it is honest about extrapolation.
- Explain to a friend, without equations, the difference between a fitted value \(\hat{y}\) and an observed value \(y\), and where the residual lives between them.
Reading and source pointer
Read ModernDive Chapter 5 — Basic Regression alongside this note; it develops the fitted line, the slope-and-intercept interpretation, fitted values, and residuals for a single numeric predictor, with the same lm() workflow we use here. These notes are the course’s own synthesis, grounded in but not copied from the sources.
Public vs. graded
These notes, the examples, and the practice here are public and ungraded — study material only. No graded prompts, answer keys, rubrics, point values, or due dates appear on this site. Graded modeling checkpoints, labs, quizzes, homework/modeling memos, the midterm, the project, and the final live in Blackboard (the LMS), which is authoritative for due dates, submissions, and grades. If this page and Blackboard ever disagree, follow Blackboard.
Looking ahead
Next week we stay with the very same fitted line \(\hat{y} = 52.0 + 2.5\,x\) but learn to read the rest of the lm() output — the slope’s standard error and confidence interval, the \(R^2 = 0.34\), and the residual standard error \(s = 9.0\) — so that “best fit” comes with an honest account of how sure we are and how much the line actually explains.