Week 2 — Visualization & the modeling workflow
Graph before you model: what a scatterplot tells you first
The week question
What does a scatterplot of final against study tell us before we ever fit a model? Last week we framed the modeling question — does weekly study time help explain final-exam performance? — and named the unit, response, and predictor. This week we resist the urge to compute anything fancy and instead look. The single picture we make, a cloud of 200 points with study on the horizontal axis and final on the vertical, is the first and most honest diagnostic we will ever run on this relationship. The week question is therefore deliberately modest: what can the eye learn from that cloud, and how does looking first change what we do next?
The answer turns out to be: almost everything that matters about whether a straight-line model is even appropriate. The scatterplot shows us the form of the relationship (is it roughly linear, or is there a bend?), its direction (do points drift up to the right or down?), its strength (a tight band or a loose haze?), and any unusual points (a lone student far from the crowd). None of that requires a single line of modeling code. By the end of the week, the slope and correlation we will eventually compute should feel like a confirmation of what the picture already suggested — not a surprise.
Why this matters
A statistical model is a structured argument about how variables relate. Like any argument, it can be built on a false premise. The most common false premise in regression is that the relationship is a straight line when the data plainly say otherwise. The cheapest, fastest, most reliable way to check that premise is to draw the scatterplot — and the cost of skipping it is high. A model fit to curved data will report a slope and a correlation, dutifully, with no error message and no complaint. The numbers will look authoritative. They will also be a poor summary of what is actually happening. The software cannot see the curve; only you can, and only if you look.
This is why the modeling workflow puts visualization upstream of modeling, not downstream of it. A picture is not decoration to be added once the model is fit and the paper is being written. It is the step that tells you whether the model you are about to fit is the right kind of model at all. Graphing first protects you from three quiet failures: fitting a line through a curve, letting a single outlier drag the line around, and reporting a strong-sounding correlation that is really just one influential point. Each of these passes silently through lm(). Each of them is obvious in a scatterplot. The habit we are building this week — graph, then model — is the cheapest insurance in all of applied statistics.
Learning goals
By the end of this week you should be able to:
- Explain why a scatterplot is the first regression diagnostic, made before any model is fit.
- Read a scatter of a numeric response against a numeric predictor for its four features — form, direction, strength, and unusual points — and say what each implies for modeling.
- Anticipate, from the look of a cloud, roughly what a correlation will report, and use that to sanity-check the eventual number.
- Choose an appropriate plot for the kind of variables involved: a scatterplot for two numeric variables, a boxplot for a numeric response across the levels of a categorical predictor.
- Place visualization in its proper place in the tidy-data workflow: import, tidy, visualize, model, communicate.
- Name, in plain language, the modeling failures that looking-first prevents.
Core vocabulary
- Scatterplot. A plot of one numeric variable against another, one point per observation. The basic picture for a numeric response and a numeric predictor.
- Form. The overall shape of the cloud — straight (linear), curved, or shapeless. Form decides what kind of model is reasonable.
- Direction. Whether the cloud drifts up to the right (positive association) or down (negative).
- Strength. How tightly the points hug an underlying trend — a narrow band is strong, a diffuse haze is weak. The eventual \(r\) puts a number on this.
- Outlier / unusual point. An observation far from the main cloud, in \(x\), in \(y\), or in its distance from the trend. Worth a second look before it distorts a fit.
- Correlation \(r\). A single number from \(-1\) to \(1\) summarizing the strength and direction of a linear association. It is a summary of the picture, never a substitute for it.
- Boxplot. A compact summary of a numeric variable’s distribution (median, quartiles, spread, outliers), drawn one box per group — the natural plot for a numeric response across a categorical predictor.
- Tidy data. A table where each row is an observation and each column is a variable — the shape that makes plotting and modeling straightforward.
- The modeling workflow. The repeatable cycle: import → tidy → visualize → model → communicate.
Concept development
Graph before you model — the scatterplot is the first regression diagnostic
We usually meet “diagnostics” as something done after a model is fit — residual plots, leverage, the checks of Week 5. But the very first diagnostic comes earlier, before any coefficients exist: the scatterplot of response against predictor. It diagnoses the premise. A straight-line model assumes the mean of final changes by a constant amount for each additional study hour — a fixed slope, the same everywhere. The scatterplot is how you check, by eye, whether that assumption is even plausible before you commit to it.
Think of it as the question the model cannot ask itself. lm(final ~ study) will happily return an intercept and a slope whether the cloud is a clean line, a parabola, or a fan that widens to the right. The arithmetic runs regardless. What the arithmetic cannot tell you is whether a single straight line is a faithful summary. Only the picture can. So the discipline is simple and non-negotiable: make the scatterplot first, read it, and only then decide whether the straight-line model is the right tool. If the cloud is curved, a straight line is the wrong premise no matter how confident its output looks.
What a scatter reveals — form, direction, strength, outliers
A trained eye reads a scatterplot in four passes, and each pass maps onto a modeling decision.
Form comes first because it is the most consequential. Is the cloud organized around a straight line, a curve, or nothing in particular? Form decides the kind of model. A roughly linear cloud invites a linear model; a clear bend tells you a straight line will systematically miss — over-predicting in the middle and under-predicting at the ends, or vice versa — and that a transformation or a curved term is needed instead.
Direction is next: does the cloud drift up to the right (more study, higher finals — positive) or down (negative)? Direction is the sign of the slope and the sign of \(r\). For final versus study we expect the cloud to tilt upward, and it does.
Strength is the third pass: how tightly do the points hug the trend? A narrow band means knowing study tells you a lot about final; a diffuse haze means it tells you little, even if the average trend is real. Strength is what \(r\) and, later, \(R^2\) quantify. The eye’s verdict and the number should agree — if they disagree, trust the eye and go find out why the number lied.
Unusual points is the last pass. Scan for any observation sitting apart from the crowd — a student who studied very little but aced the final, or studied a great deal and scored poorly. Such a point can pull a fitted line toward itself and inflate or deflate the apparent relationship. Spotting it now, in the picture, means you can investigate it deliberately rather than discover its damage in a confusing model later.
For our recurring data, all four passes point the same way: a cloud that drifts clearly upward (positive), hugs a straight trend reasonably but not tightly (moderate, roughly linear), with no single point dominating. That visual read foreshadows the correlation we will eventually compute, \(r = 0.58\) — positive, moderately strong, the kind of number a moderately tight upward band should produce.
The tidy-data workflow — import, tidy, visualize, model, communicate
Visualization does not live in isolation; it is one stage of a repeatable cycle that organizes the whole course. You import the data into R. You tidy it so every row is one student and every column is one variable — the shape that makes everything downstream straightforward, and the focus of ModernDive’s wrangling chapter. You visualize, which is this week’s stage and the first place the data talks back. You model, fitting and criticizing — most of the rest of the term. And you communicate, turning a fitted model into a claim a reader can trust (Week 14’s reproducible report).
The order is not arbitrary, and visualize sits deliberately before model. The point of this week is that the visualize stage is not optional polish you can defer until the modeling is done. It is a gate the data must pass through on the way to a model, because it is where the data gets to object — to show a curve, a gap, a lone outlier — while objecting is still cheap. Skip the gate and the data’s objections surface later, as a misleading slope or a baffling residual plot, when they are far more expensive to untangle.
Worked examples
Worked example — the scatter of final vs study (studyhabits)
We return to the recurring studyhabits dataset (synthetic; seed set, set.seed(33003); \(n = 200\) students in one intro course; it stands in for a campus learning-analytics study and is not real student data). This week we make the picture that every later week will build on — and we make it before fitting anything.
set.seed(33003)
# studyhabits: synthetic, n = 200; one intro course
# Step 1 of the workflow that matters this week: VISUALIZE, before any lm().

library(ggplot2)
ggplot(studyhabits, aes(x = study, y = final)) +
  geom_point(alpha = 0.6) +
  labs(x = "Average weekly study hours",
       y = "Final exam score (0-100)",
       title = "Look before you model: final vs study")

# Only AFTER reading the cloud do we summarize its strength with a number:
cor(studyhabits$study, studyhabits$final)
#> [1] 0.58      # r = 0.58: positive, moderately strong, roughly linear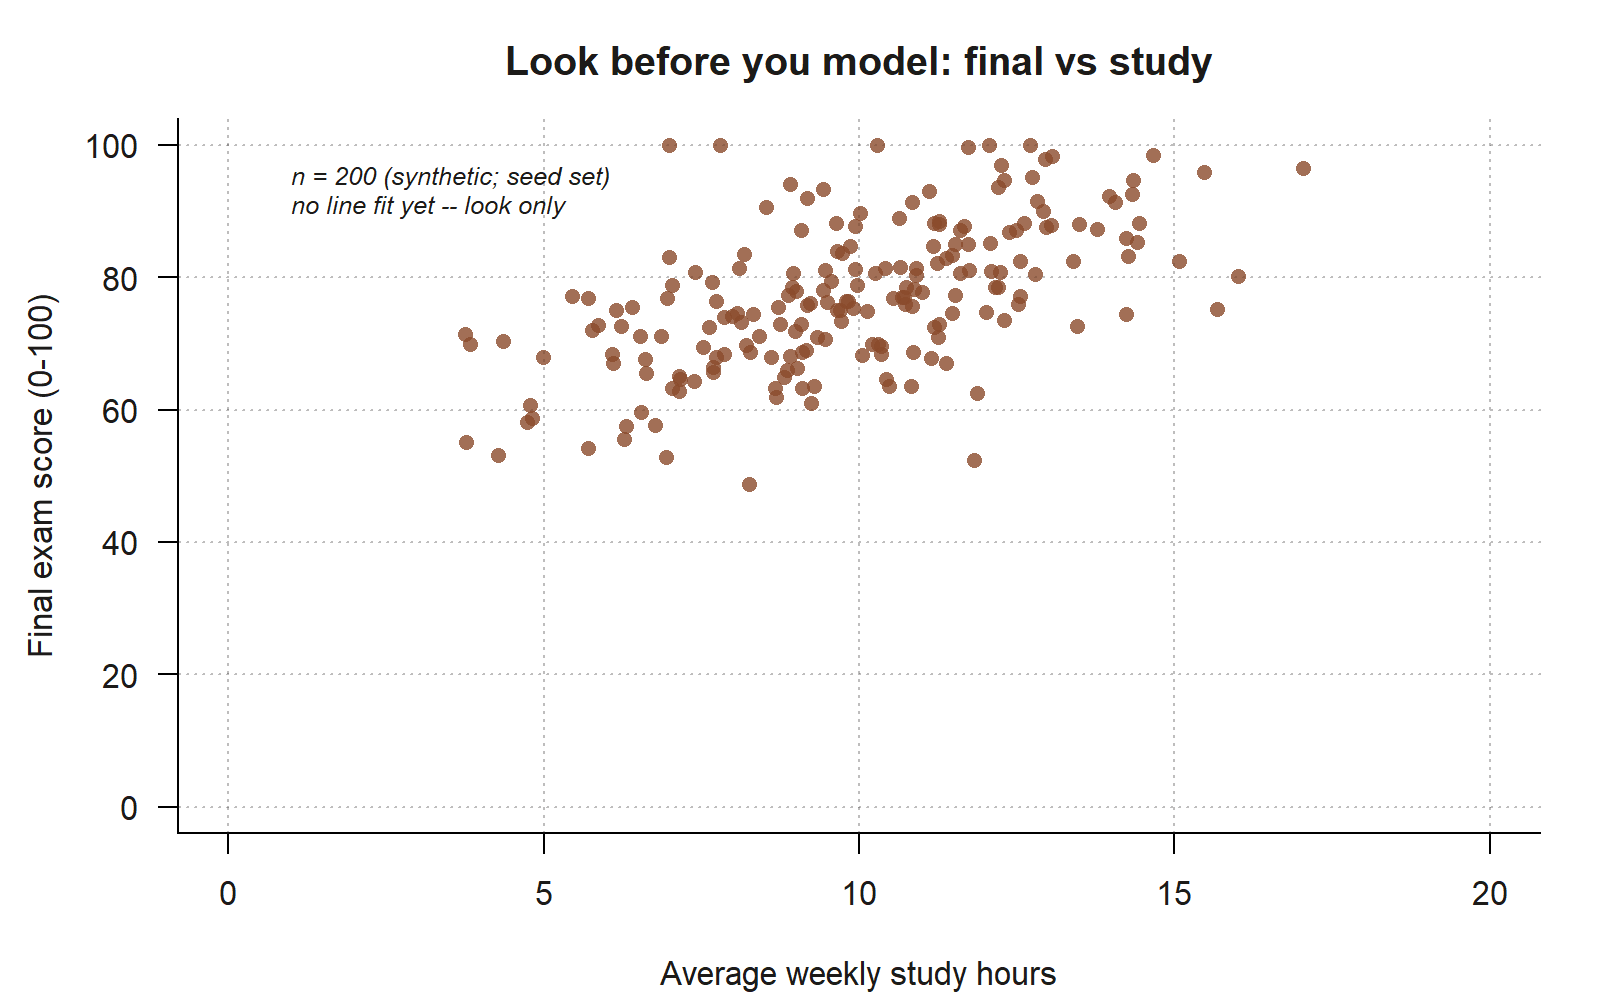
final-vs-study cloud, read before any model is fit. Each point is one of the 200 students in the synthetic studyhabits data; no regression line is drawn on purpose, because this week’s discipline is to read the cloud by eye first. The points drift upward from lower-left to upper-right (positive direction), hug a single roughly straight band without an obvious bend (linear form), and show real but moderate scatter around that band (strength) — a visual pattern consistent with the correlation you just computed, \(r = 0.58\) (synthetic; seed set). No single point sits far enough from the crowd to dominate the picture.
Read the cloud the way the section above describes, in four passes. Form: the points are organized around a single straight band — no obvious bend — so a straight-line model is a defensible premise. Direction: the band tilts up to the right; students who study more tend to score higher, a positive association. Strength: the band is moderately tight — clearly upward but with real scatter around the trend, not a thin line. Unusual points: a few students sit a bit apart, but none dominates the picture.
Only after that visual read do we let a number confirm it: the correlation is \(r = 0.58\). That value sits exactly where the eye put it — positive (the band rises), moderate (the band has width), and consistent with a roughly linear form. The number did not surprise us, and that is the point: a correlation you anticipated from the picture is a correlation you can trust. If cor() had instead returned, say, \(0.95\) for that same diffuse band, the disagreement would be a red flag — usually a single influential point inflating \(r\) — and the picture would be how you caught it.
Notice what we did not do: we did not call lm(). The slope, \(R^2\), and standard errors all wait until Week 3. This week’s deliverable is the picture and the four-pass reading of it. The correlation \(r = 0.58\) is a foreshadowing — a one-number echo of the cloud — not yet a model. (And \(r\) measures linear strength only, which is exactly why the form pass had to come first: a strong curve can hide behind a weak-looking \(r\).)
Worked example — a boxplot of final by format (transfer)
Now move the idea to a new context: instead of a numeric predictor, suppose we want to look at final across the three section formats — in_person, hybrid, online. The variables are different in kind: the response is still numeric, but the predictor format is categorical. A scatterplot is the wrong picture here; with a categorical predictor the natural look-first plot is a boxplot, one box per group, and the “graph before you model” habit carries over unchanged.
set.seed(33003)
# Transfer: numeric response, CATEGORICAL predictor -> boxplot, not scatter
ggplot(studyhabits, aes(x = format, y = final)) +
  geom_boxplot() +
  labs(x = "Section format", y = "Final exam score (0-100)",
       title = "Look first: final by format")

# A look-first numeric summary to read alongside the boxes:
aggregate(final ~ format, data = studyhabits, FUN = mean)
#>      format final
#> 1 in_person  78    # highest
#> 2    hybrid  75
#> 3    online  71    # lowest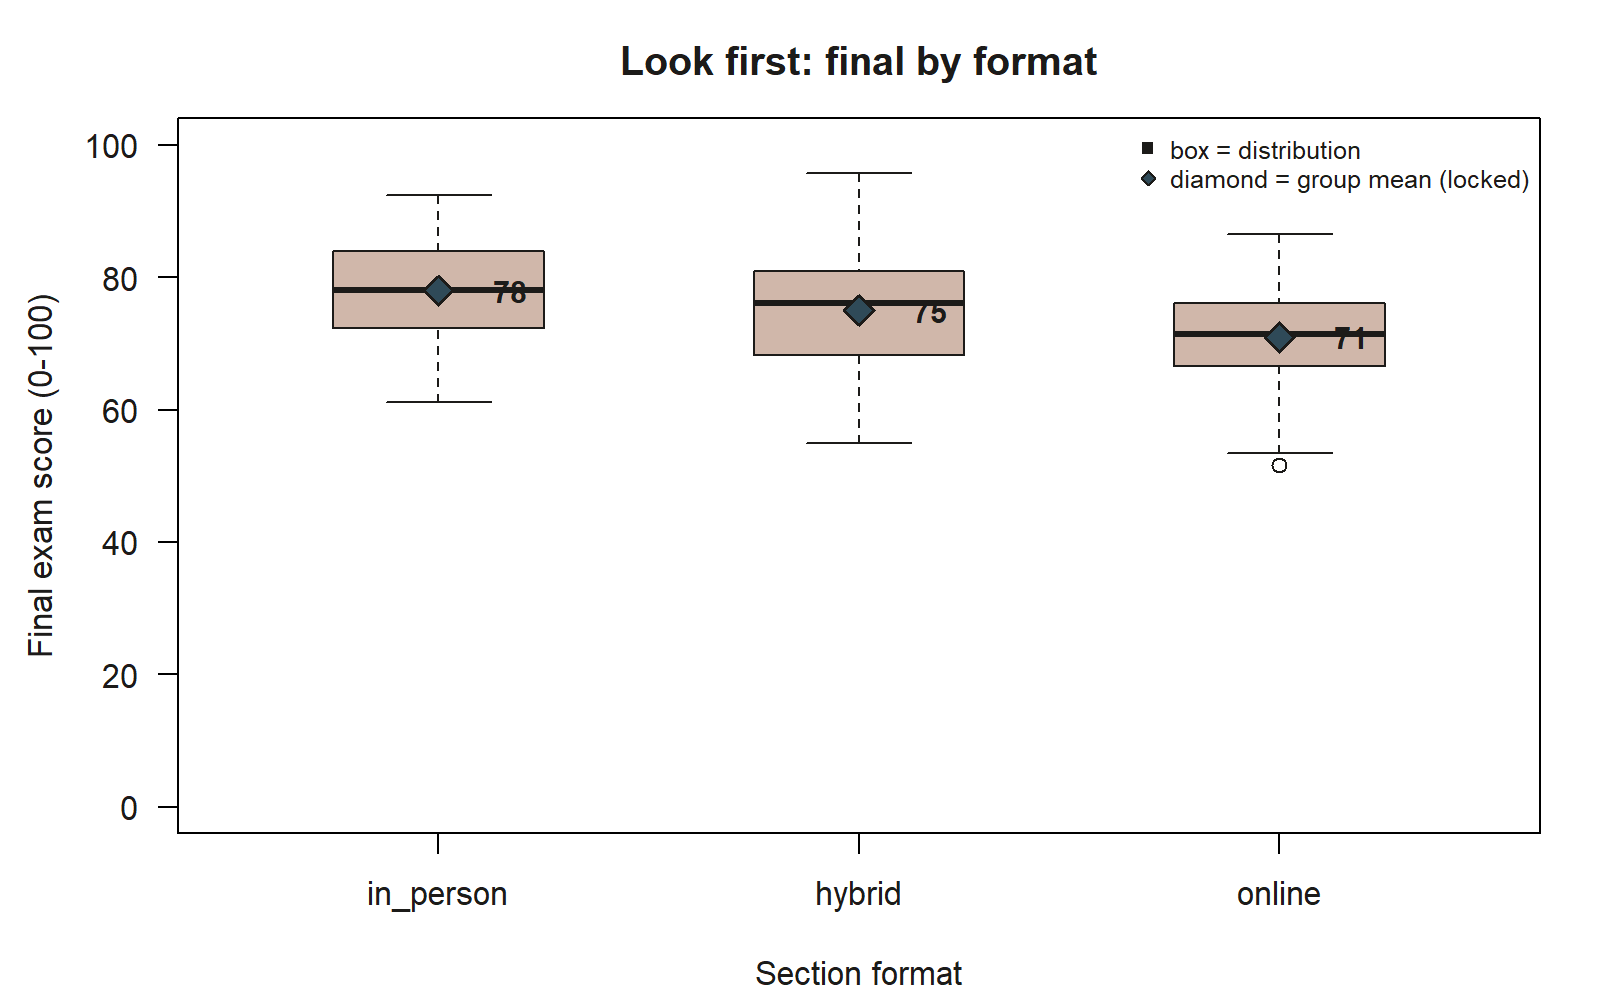
final by section format, with the locked group means marked. Each box summarizes one format’s distribution of final exam scores; the boxes step downward from in_person to hybrid to online, matching the group means \(78\), \(75\), and \(71\) (synthetic; seed set) marked here as blue diamonds so the mean is visible independent of the box’s median line. The ordering repeats the four-pass discipline from the scatter above, just applied to a categorical predictor: read center (the diamonds and the median lines agree closely here), spread (the three boxes are comparably tall), and unusual points (one low outlier appears below the online whisker) before any model is fit.
Read the boxes the way you read the cloud, adapted to groups. Center: the boxes step downward from in_person to hybrid to online, and the group means — \(78\), \(75\), and \(71\) — confirm that ordering. A student’s predicted final is highest in the in-person sections and lowest online, a spread of about \(7\) points across formats. Spread and shape: scan each box’s height for whether the groups are comparably variable, and outliers: note any points drawn beyond the whiskers, since those are the same kind of unusual observations the scatter pass looked for.
The modeling lesson transfers exactly. These group means — \(78 / 75 / 71\) — are what a model with a categorical predictor will later report as a baseline and two differences, and the boxplot lets us anticipate that structure before fitting it, just as the scatter let us anticipate \(r = 0.58\). The plot changes with the kind of variable; the discipline does not. Choose the picture that fits the variables, read it for center, spread, and unusual points, and only then reach for a model.
A common mistake
The signature mistake of this week is jumping straight to lm() before looking at the data. It is tempting because fitting feels like progress: you get coefficients, a correlation, an \(R^2\), a tidy table of numbers that looks like an answer. But a model fit to unexamined data can be confidently wrong. If the true relationship curves, a straight line will report a slope that splits the difference and miss the pattern entirely — and lm() will not warn you, because it cannot see the curve. If one outlier dominates, the line will tilt toward it and the correlation will be inflated, and again there is no error message. If the response is skewed or the scatter fans out, the fitted line may be fine on average but useless where it matters, and the printout will not say so.
Every one of these failures is invisible in the model’s output and obvious in a scatterplot. The fix is the whole point of the week: graph first. Make the picture, read it in the four passes, and only then decide whether — and what kind of — model to fit. A scatterplot costs one line of code and a few seconds; a model built on an unchecked premise can cost you the entire conclusion. When you find yourself typing lm() before you have drawn the cloud, stop, draw the cloud, and look.
Low-stakes self-checks (ungraded)
These are ungraded self-checks — no points, no submission, no due date. Use them to test your eye.
- In your own words, why is the scatterplot called the first regression diagnostic? What premise does it check that
lm()cannot check for you? - Name the four things you read from a scatterplot, and say what modeling decision each one informs.
- The
final-vs-studycloud is positive, moderately strong, and roughly linear. Which single number later summarizes that strength and direction, and roughly what value would you predict it to take before computing it? - You are asked to look at
finalacross the threeformatlevels. Why is a boxplot, not a scatterplot, the right look-first picture here? - A classmate ran
lm()first, got a slope and an \(R^2\), and never plotted the data. Describe one failure that could be hiding in that output that a scatterplot would have revealed. - Put the five workflow stages in order, and explain why visualize comes before model.
Reading and source pointer
Read ModernDive Chapter 2 (Data Visualization) for the grammar of graphics and the standard plot types, and ModernDive Chapter 3 (Data Wrangling) for getting data into the tidy shape that makes plotting and modeling straightforward. These chapters supply the scatterplot and boxplot idioms used above and the import-tidy-visualize framing of the workflow. These notes are the course’s own synthesis, grounded in but not copied from the sources.
Public vs. graded
These notes, the examples, and the practice here are public and ungraded — study material only. No graded prompts, answer keys, rubrics, point values, or due dates appear on this site. Graded modeling checkpoints, labs, quizzes, homework/modeling memos, the midterm, the project, and the final live in Blackboard (the LMS), which is authoritative for due dates, submissions, and grades. If this page and Blackboard ever disagree, follow Blackboard.
Looking ahead
Next week we stop looking and start fitting: we put a straight line through the final-vs-study cloud you graphed today, estimating \(\hat{y} = 52.0 + 2.5\,x\), and we read the slope as a claim about how study time relates to performance — the eye’s verdict turned into a model.
See also
- Companion lab: Lab 2 — Visualizing relationships
- Previous week: Week 1 — Models, data & statistical questions
- Next week: Week 3 — Simple linear regression
- Reference: Notation glossary · Modeling reference