Week 4 — Interpreting regression output
Reading the coefficient table, R-squared, residual error, and a confidence interval
The week question
Last week you fit a line. This week you have to read it. When you run summary(fit) in R, the screen fills with a small table of numbers — an intercept, a slope, a column of standard errors, a column of \(t\)-statistics, a column of \(p\)-values — and then, below the table, an \(R^2\) and a residual standard error. The week question is blunt: what do those numbers actually say? Specifically, what does the slope claim about the world, what does \(R^2\) measure (and what does it not measure), what is the residual standard error \(s\) telling you about how good your predictions are, and what does a 95% confidence interval for the slope add that the point estimate alone cannot?
A regression output is not a verdict; it is a structured argument with quantities attached. Each number is a sentence waiting to be written. Your job this week is to learn to translate the table into plain claims about study hours and exam scores — claims that are honest about both the estimated effect and the uncertainty that surrounds it.
Why this matters
In every applied setting where regression appears — a program evaluation, a clinical study, a business forecast, a policy memo — someone eventually pastes a coefficient table into a slide and says “the effect is significant.” That sentence, said carelessly, hides more than it reveals. A coefficient table can show a slope that is statistically distinguishable from zero but practically trivial, or a respectable \(R^2\) that still leaves most of the outcome unexplained, or a confidence interval so wide that the data are nearly silent about the size of the effect. If you cannot read the table, you cannot tell which situation you are in, and you will either overclaim or underclaim.
This week is where modeling stops being “fit a line” and becomes “make a defensible claim.” The whole orientation of this course is that a model is a careful argument from data: what comparison is being made, how big it is, and how much uncertainty remains. The coefficient table, \(R^2\), \(s\), and the confidence interval are exactly the four instruments that answer those questions. Reading them well is the difference between a model that informs a decision and a number that decorates one.
Learning goals
By the end of this week you should be able to:
- Read each column of an
lm()coefficient table — estimate, standard error, \(t\)-statistic, \(p\)-value — and say in a sentence what each one means for the slope and the intercept. - Interpret \(R^2\) as the proportion of variation in the response explained by the model, and state honestly what fraction remains unexplained.
- Interpret the residual standard error \(s\) as the typical size of a prediction error, in the response’s own units.
- Read a 95% confidence interval for the slope as a range of plausible values for the true effect, and use it to talk about uncertainty rather than a single point.
- Distinguish statistical significance (is the effect distinguishable from zero?) from practical significance (is the effect large enough to matter?), and explain why a tiny \(p\)-value does not imply a large effect.
Core vocabulary
- Estimate (coefficient). The fitted value of a parameter: \(b_0\) for the intercept, \(b_1\) for the slope. These are sample estimates of the unknown population parameters \(\beta_0\) and \(\beta_1\).
- Standard error, \(\mathrm{SE}(b_1)\). The estimated standard deviation of the slope estimate across hypothetical repeated samples — a measure of how much \(b_1\) would wobble if you redrew the data.
- \(t\)-statistic. The estimate divided by its standard error, \(t = b_1 / \mathrm{SE}(b_1)\). It measures how many standard errors the estimate sits away from zero.
- \(p\)-value. The probability, if the true slope were zero, of seeing a \(t\)-statistic at least this extreme. Small \(p\) means the data are hard to reconcile with a zero slope.
- \(R^2\) (coefficient of determination). The proportion of the variation in \(y\) that the model explains; here \(R^2 = r^2\), the square of the correlation, for a single-predictor model.
- Residual standard error, \(s\). The typical size of a residual \(e = y - \hat{y}\), in the units of \(y\) — roughly, how far off a prediction usually is.
- Confidence interval (CI). An interval, built from the estimate and its standard error, designed to cover the true parameter in a stated percentage (here 95%) of repeated samples.
- Statistical vs. practical significance. Statistical: distinguishable from zero. Practical: large enough to matter for the question at hand. They are different claims.
Concept development
The coefficient table — estimate, SE, t, p
The heart of an lm() summary is a table with one row per coefficient and four columns. For the recurring model final ~ study, the slope row reads: estimate \(b_1 = 2.5\), standard error \(\mathrm{SE}(b_1) = 0.25\), \(t = 10.0\), and a very small \(p\)-value. Read the columns from left to right.
The estimate is the answer to “how much?” The slope \(b_1 = 2.5\) says that each additional weekly study hour is associated with a \(2.5\)-point higher predicted final exam score, on average. The intercept \(b_0 = 52.0\) is the predicted final at zero study hours — but no one in the data studies zero hours, so this is extrapolation and should be read as a mathematical anchor for the line, not a real prediction.
The standard error is the answer to “how precisely?” \(\mathrm{SE}(b_1) = 0.25\) is the estimated standard deviation of the slope estimate over repeated samples. A small SE relative to the estimate means the slope is pinned down tightly; a large SE means the data leave it loose. The SE is the bridge from a single number to a statement about uncertainty, and it drives both the \(t\)-statistic and the confidence interval.
The \(t\)-statistic standardizes the estimate: \(t = b_1 / \mathrm{SE}(b_1) = 2.5 / 0.25 = 10.0\). This says the estimated slope sits \(10\) standard errors above zero — an enormous distance. The \(p\)-value turns that distance into a probability: if the true slope were exactly zero, a \(t\) of \(10\) would be astonishing, so the \(p\)-value is tiny (printed in R as something like <2e-16). The formal logic is a hypothesis test:
\[ H_0:\ \beta_1 = 0 \qquad \text{versus} \qquad H_A:\ \beta_1 \neq 0, \]
with test statistic \(t = b_1 / \mathrm{SE}(b_1)\). A tiny \(p\)-value lets you reject the idea that study and final score are unrelated. Crucially, it does not tell you the slope is large — only that it is distinguishable from zero. The size lives in the estimate; the certainty lives in the SE, \(t\), and \(p\).
R-squared (variance explained) and the residual standard error \(s\)
Two summaries below the table describe how well the line fits the cloud of points as a whole. They answer different questions, and confusing them is a classic error.
\(R^2\) measures the proportion of variation explained. Total variation in final can be split into the part the line accounts for and the part it leaves over:
\[ R^2 = \frac{\text{variation explained by the model}}{\text{total variation in } y} = 1 - \frac{\sum (y - \hat{y})^2}{\sum (y - \bar{y})^2}. \]
For final ~ study, \(R^2 = 0.34\). In plain words: study hours explain about 34% of the variation in final exam scores in this synthetic cohort; the remaining 66% is variation the line does not account for — other predictors, measurement noise, and the irreducible scatter of human performance. Because this is a single-predictor model, \(R^2 = r^2\): the correlation here is \(r = 0.58\), and \(0.58^2 \approx 0.34\). A higher \(R^2\) means the points hug the line more tightly, but \(R^2\) says nothing about whether the line is the right shape — a curved relationship can still post a moderate \(R^2\). That is a job for residual diagnostics, which is next week’s topic.
The residual standard error \(s\) measures fit in the units of the response. It is essentially the typical size of a residual:
\[ s = \sqrt{\frac{\sum (y - \hat{y})^2}{n - 2}}. \]
For final ~ study, \(s = 9.0\) points. In plain words: predictions from this line are typically off by about 9 exam points. That is the number to carry into any sentence about prediction quality — it is far more tangible than \(R^2\) for someone asking “how close will the prediction be?” A model can have a respectable \(R^2\) and still a large \(s\) if the response itself is highly variable; the two summaries are complementary, not redundant. \(R^2\) is unitless and bounded between 0 and 1; \(s\) carries the units of \(y\). Report both.
Uncertainty — the 95% CI for the slope, and statistical vs. practical significance
The point estimate \(b_1 = 2.5\) is the single best guess, but it is not the whole story. A confidence interval surrounds the estimate with a range of plausible values for the true slope \(\beta_1\). The familiar form is
\[ b_1 \pm t^{*} \cdot \mathrm{SE}(b_1), \]
where \(t^{*}\) is a multiplier near \(2\) for 95% confidence with a large sample. For our model this works out to the locked interval \((2.0,\ 3.0)\). Read it like this: the data are consistent with a true slope anywhere from about 2.0 to 3.0 points per study hour. Because the entire interval lies above zero, the positive association is firmly established — which is the same message the tiny \(p\)-value sent, now expressed as a range rather than a yes/no. The CI is the more informative object: it reports both direction and magnitude with their uncertainty in one breath.
This is where statistical significance and practical significance part ways. Statistical significance asks only: is the effect distinguishable from zero? With \(t = 10.0\), the answer is an emphatic yes. Practical significance asks a different question: is a 2-to-3-point gain per weekly study hour large enough to matter to a student deciding how to spend an evening? That is a judgment about the subject matter, not a number the table can supply. A tiny \(p\)-value can attach to a trivially small slope when the sample is huge, and a large, meaningful slope can fail to reach significance when the sample is small. The \(p\)-value reports certainty about non-zero-ness; the estimate and CI report size. Always read them together, and never let “significant” stand in for “big.”
Worked examples
Worked example — reading the studyhabits output (final ~ study)
We return to the recurring synthetic teaching dataset studyhabits (synthetic; seed set, set.seed(33003), \(n = 200\) students in one intro course). We fit and summarize the simple regression of final exam score on weekly study hours, then ask for a confidence interval for the slope.
set.seed(33003)
fit <- lm(final ~ study, data = studyhabits)
summary(fit)
#> Coefficients:
#>             Estimate Std. Error t value Pr(>|t|)
#> (Intercept)   52.000      1.400   37.14   <2e-16 ***
#> study          2.500      0.250   10.00   <2e-16 ***
#>
#> Residual standard error: 9.0 on 198 degrees of freedom
#> Multiple R-squared:  0.34,  Adjusted R-squared:  0.337

confint(fit)
#>               2.5 %  97.5 %
#> (Intercept)  49.24   54.76
#> study         2.00    3.00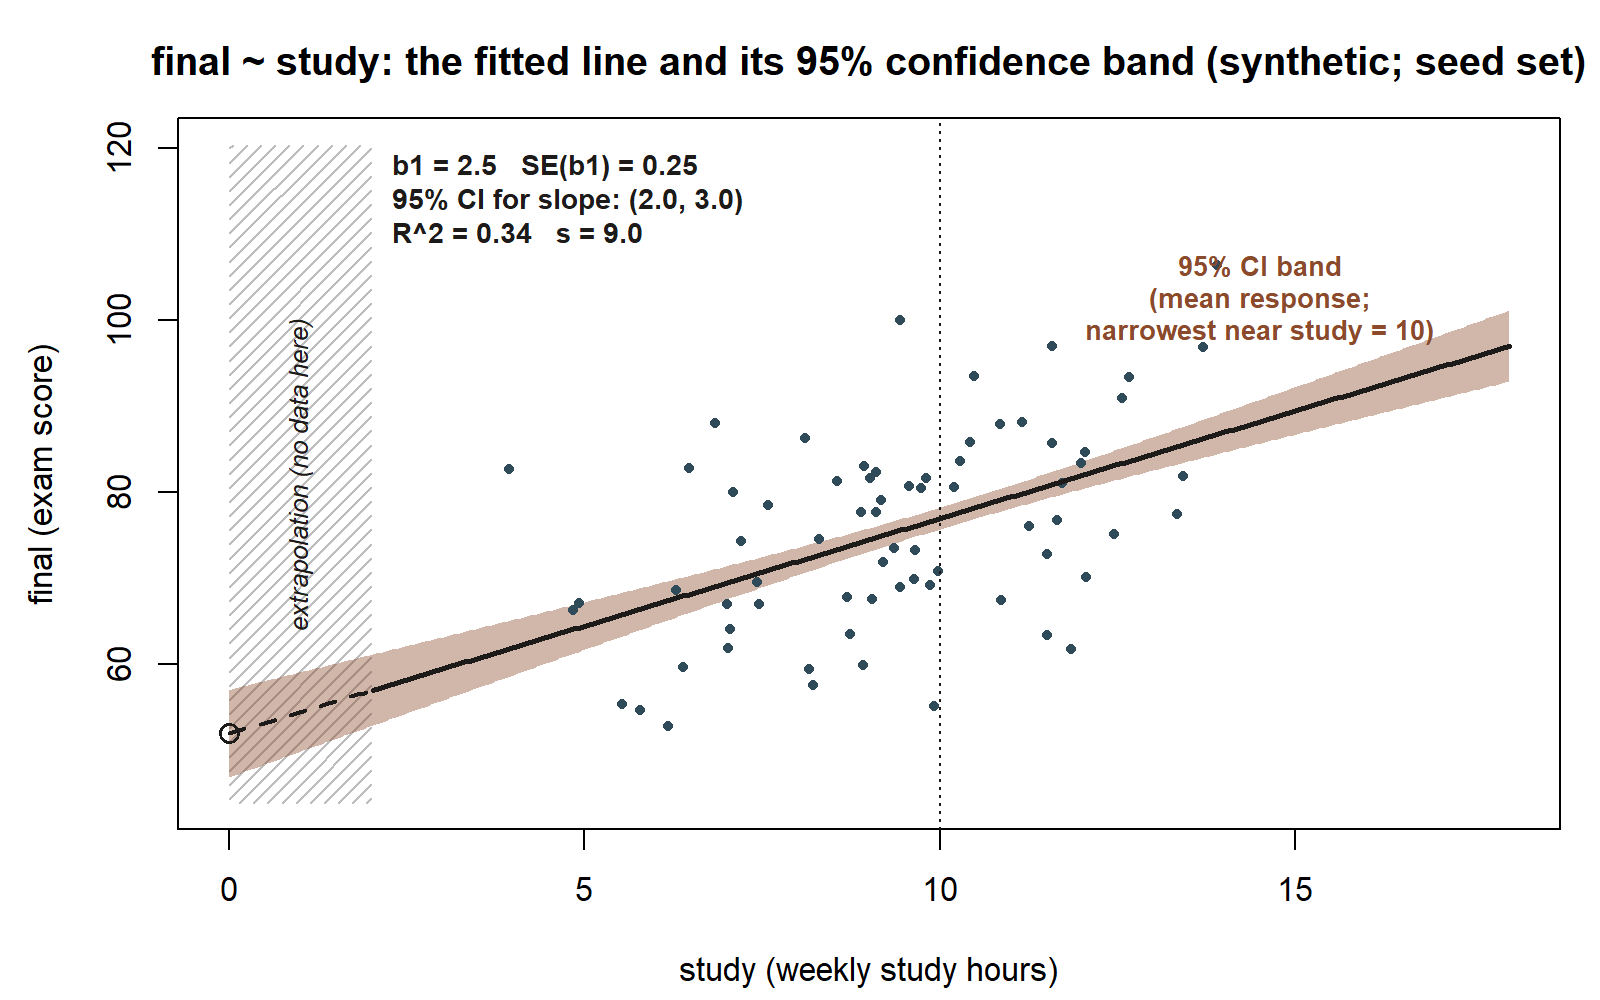
final = 52.0 + 2.5 * study, with a shaded 95% confidence band for the mean response. The band is narrowest near the middle of the observed study-hours range and widens toward the edges — the model is most certain about the average final score near a typical study load, and least certain at the extremes. The hatched strip below study = 2 marks the near-zero-hours region where the dataset has essentially no observations, so the dashed segment of the line back to the intercept is extrapolation, not a supported prediction. Annotated: slope \(b_1 = 2.5\), \(\mathrm{SE}(b_1) = 0.25\), 95% CI for the slope \((2.0,\ 3.0)\), \(R^2 = 0.34\), \(s = 9.0\) (synthetic; seed set; band shape illustrative — see figure source for the derivation of the plotted band width from these same locked numbers).
Now translate every number into a sentence.
- Slope estimate \(b_1 = 2.5\): each additional weekly study hour is associated with a \(2.5\)-point higher predicted final exam score, on average. This is the size of the effect.
- \(\mathrm{SE}(b_1) = 0.25\): the slope estimate would wobble by about a quarter-point across repeated samples — it is tightly pinned down.
- \(t = 10.0\): the slope sits \(10\) standard errors above zero, so a true slope of zero is wildly inconsistent with the data; the corresponding \(p\)-value is effectively zero. The association is statistically significant.
- \(R^2 = 0.34\): study hours explain about \(34\%\) of the variation in final scores; about \(66\%\) of the variation remains unexplained by study time alone. Useful, but far from the whole story.
- Residual standard error \(s = 9.0\): predictions from this line are typically off by about \(9\) exam points. If you predict a student’s final from their study hours, expect to be wrong by roughly \(9\) points in a typical case.
- 95% CI for the slope \((2.0,\ 3.0)\): the data are consistent with a true slope between \(2.0\) and \(3.0\) points per study hour. Because the whole interval is positive, the direction is settled; the remaining uncertainty is only about how large the effect is, within that band.
Put together, the model makes an honest claim: studying more is reliably associated with higher final scores (slope \(2.5\), CI \((2.0, 3.0)\), \(t = 10.0\)), the effect is moderate but not all-explaining (\(R^2 = 0.34\)), and individual predictions still carry about a \(9\)-point typical error (\(s = 9.0\)). Notice the model-criticism move waiting in the wings: a strong \(t\) and a moderate \(R^2\) say nothing about whether the shape is right — that requires a residual plot, which is exactly where Week 5 begins.
Worked example — transfer: reading a printed rent ~ size output
Now move the idea to a fresh context. Suppose a housing-office analyst fits a simple regression of monthly apartment rent (dollars) on apartment size (hundreds of square feet) for a synthetic set of listings (synthetic; seed set). They paste the output into a memo, and your job is to read it cold.
fit_rent <- lm(rent ~ size, data = listings)
summary(fit_rent)
#> Coefficients:
#>             Estimate Std. Error t value Pr(>|t|)
#> (Intercept)   480.00      60.00    8.00   <2e-16 ***
#> size          120.00      15.00    8.00   <2e-16 ***
#>
#> Residual standard error: 140 on 248 degrees of freedom
#> Multiple R-squared:  0.21,  Adjusted R-squared:  0.207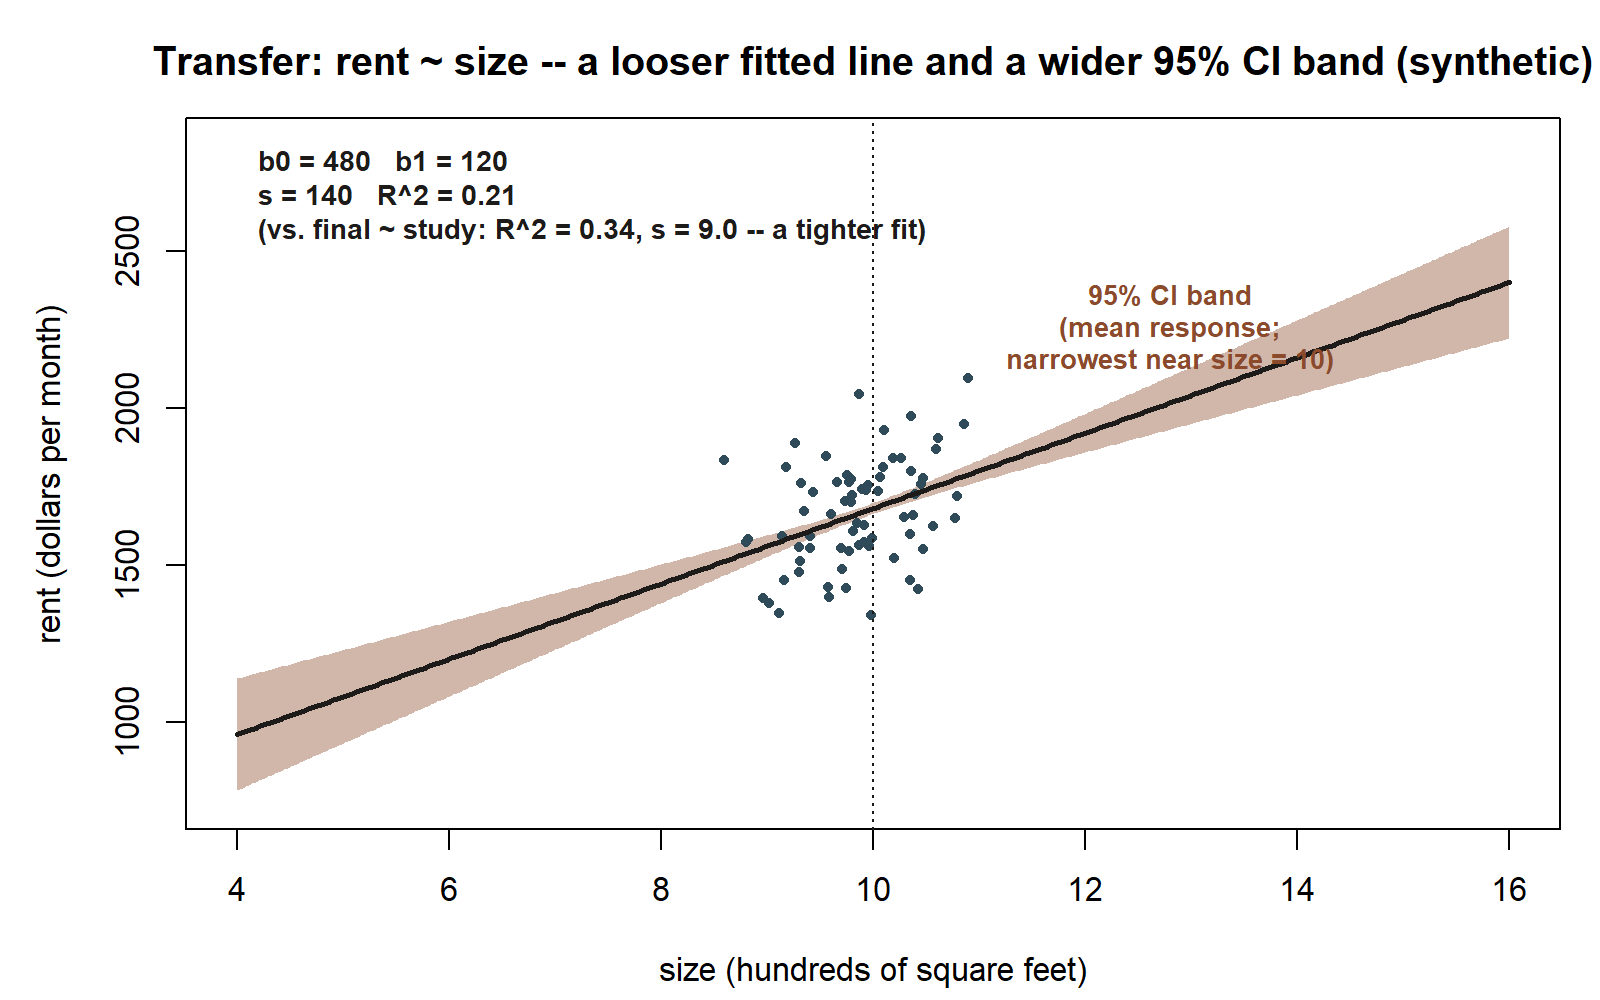
rent = 480 + 120 * size, drawn as a deliberate matched pair with the studyhabits figure above. Same figure grammar — a fitted line, a shaded 95% confidence band for the mean response, illustrative scatter — but visibly looser: the band is proportionally wider and the points scatter farther from the line, reflecting the smaller \(R^2 = 0.21\) and the larger residual standard error \(s = 140\) (against \(R^2 = 0.34\) and \(s = 9.0\) for final ~ study). Annotated: intercept \(b_0 = 480\), slope \(b_1 = 120\), \(s = 140\), \(R^2 = 0.21\) (synthetic; seed set; band shape illustrative — see figure source for the derivation of the plotted band width from these same page numbers).
Reading this output by the same four instruments:
- Slope: each additional hundred square feet is associated with about a \(\$120\) higher predicted monthly rent, on average. With \(t = 8.0\) and a tiny \(p\)-value, this positive association is statistically significant — size and rent are clearly related.
- \(R^2 = 0.21\): size explains only about \(21\%\) of the variation in rent; nearly \(80\%\) is left unexplained — location, building age, amenities, and noise. The relationship is real but far from the whole picture, so a memo claiming “size determines rent” would badly overreach.
- Residual standard error \(s = 140\): predictions of rent from size alone are typically off by about \(\$140\) a month — a large error for a budgeting decision. The honest takeaway is that size is one useful but limited input, and that an analyst wanting accurate rent predictions needs more predictors.
The transfer lesson is that the same reading discipline applies regardless of subject: a significant slope tells you direction and size, \(R^2\) tells you how much of the spread you have captured, and \(s\) tells you in real units how wrong a typical prediction will be. Significance never excuses a small \(R^2\) or a large \(s\).
A common mistake
The most common mistake this week comes in two flavors, and both confuse one number’s job with another’s.
Flavor one: reading \(R^2\) as “the model is adequate.” A student sees \(R^2 = 0.34\) and concludes the model is “good,” or sees \(R^2 = 0.85\) elsewhere and concludes the model is “right.” Neither follows. \(R^2\) measures only how much of the vertical spread the line accounts for; it is completely silent about whether the relationship is linear, whether the residuals fan out, whether an influential point is dragging the line, or whether an important predictor is missing. A curved relationship can post a moderate \(R^2\) while systematically mis-predicting at the extremes. Adequacy is a question for residual diagnostics, not for \(R^2\) — which is why “the model is adequate” is a Week 5 claim, never a Week 4 one. Use \(R^2\) to describe explained variation, and stop there.
Flavor two: confusing a tiny \(p\)-value with a large effect. A student sees \(p < 2\times10^{-16}\) and writes “study has a huge effect on final scores.” The \(p\)-value says nothing about how huge. It reports only that the slope is distinguishable from zero; with \(n = 200\) and a small SE, even a modest slope earns a microscopic \(p\)-value. The size of the effect lives in the estimate (\(b_1 = 2.5\)) and the confidence interval (\((2.0, 3.0)\)); whether that size matters is a practical-significance judgment about the subject. The fix is a habit: whenever you are tempted to say “significant,” immediately add the estimate and its CI, and ask separately whether the effect is large enough to act on. Significance and magnitude are two different sentences — write both.
Low-stakes self-checks (ungraded)
These are self-check prompts only — ungraded practice to test your reading of the output. No points, no submission.
- In the
final ~ studytable, the slope is \(b_1 = 2.5\) with \(\mathrm{SE}(b_1) = 0.25\). Reconstruct the \(t\)-statistic from these two numbers, and say in one sentence what it measures. - The model reports \(R^2 = 0.34\). Write one sentence stating what fraction of the variation in
finalis explained, and one sentence stating what fraction is not — and name one reason for the unexplained part. - The residual standard error is \(s = 9.0\). A friend says “\(R^2 = 0.34\), so the model is accurate.” Using \(s\), explain in your own words why a moderate \(R^2\) can still go with predictions that are typically off by about \(9\) points.
- The 95% CI for the slope is \((2.0,\ 3.0)\). Explain why a reader who only saw “the slope is significant” would learn less than a reader who saw this interval.
- Look at the transfer
rent ~ sizeoutput. Its slope is highly significant, yet \(R^2 = 0.21\). Write the one-sentence warning you would add to a memo that claimed “apartment size explains rent.”
Reading and source pointer
Read ModernDive Chapter 5 (Basic Regression) for the structure of the coefficient table and the meaning of slope, intercept, and fit, and ModernDive Chapter 10 (Inference for Regression) for standard errors, the \(t\)-statistic and \(p\)-value, and confidence intervals for a slope. These two chapters together cover everything in this week’s output: the estimate column from Chapter 5, the uncertainty columns and the CI from Chapter 10.
These notes are the course’s own synthesis, grounded in but not copied from the sources.
Public vs. graded
These notes, the examples, and the practice here are public and ungraded — study material only. No graded prompts, answer keys, rubrics, point values, or due dates appear on this site. Graded modeling checkpoints, labs, quizzes, homework/modeling memos, the midterm, the project, and the final live in Blackboard (the LMS), which is authoritative for due dates, submissions, and grades. If this page and Blackboard ever disagree, follow Blackboard.
Looking ahead
Next week we turn from reading the numbers to criticizing the model — residual plots, checking the linearity and constant-spread assumptions, and spotting unusual or influential points — because a clean coefficient table and a moderate \(R^2\) are never, by themselves, evidence that the line is the right shape.
See also
- Week 3 — Simple linear regression — where the
final ~ studyline was fit. - Week 5 — Diagnostics & model adequacy — where “is the model adequate?” is actually answered.
- Notation glossary — symbols for \(b_1\), \(\mathrm{SE}(b_1)\), \(R^2\), \(s\), and the CI.
- Modeling reference — the coefficient-table reading checklist.