Week 8 — Categorical predictors & group comparisons
Indicator coding and regression as a language for comparing groups
The week question
How does regression compare the in-person, hybrid, and online sections of the course? Until now your predictors have been numbers — study hours, prior GPA — and a slope told you how the response moves as a number climbs. But format is not a number. It is a label: a student sits in in_person, hybrid, or online, and there is no “one more unit” of format to slide along. The week’s question is therefore a translation problem: how do you put a category into a model that, mechanically, only knows how to multiply slopes by numbers? The answer — indicator (dummy) coding — is one of the most useful ideas in the whole course, because it lets a single regression framework handle group comparisons that you might otherwise reach for a separate t-test or table to do. By the end of the week, “compare the three section formats” and “fit final ~ format” should feel like the same sentence said two ways.
Why this matters
Real modeling questions are full of categories. Treatment vs. control, three store layouts, four regions, five product lines, two delivery formats — these are the variables decisions actually turn on. If your only tool for “does the group matter?” is a separate test for each pairwise comparison, you accumulate a drawer of disconnected p-values and no single model that holds the groups together, adjusts for other predictors, or carries forward to prediction. Indicator coding fixes that. It folds categories into the same lm() you already trust, so a group comparison becomes a set of coefficients you can read, test, and interpret with the machinery you have been building since Week 3.
The deeper payoff is conceptual. Once you see that a categorical predictor in regression is just a clever encoding of “which group am I in?”, a surprising amount of classical statistics collapses into one idea. A two-group comparison is a regression with one indicator. A one-way comparison of several groups is a regression with several indicators — which, as Week 13 will show, is exactly ANOVA. Learning to read the coefficients of final ~ format correctly now means that the t-test, ANOVA, and multiple regression you will meet later are not three separate subjects to memorize but one subject seen from three angles. That unification is worth slowing down for, and the single most common way students lose it is by misreading what a coefficient on a category actually says — which is the mistake this week is built to prevent.
Learning goals
By the end of this week you should be able to:
- Explain why a categorical predictor cannot enter a regression as a raw label, and how indicator (dummy) variables encode it as a set of 0/1 columns.
- Identify the baseline (reference) level of a categorical predictor and state what the intercept means once a category is in the model.
- Interpret each coefficient on a categorical predictor as a difference from the baseline group, not as a group mean — and recover each group’s fitted mean from the intercept plus its coefficient.
- Fit
final ~ formatin R, read the coefficient table, and translate it into a plain-language comparison of the three section formats. - Carry the same coding logic to a new context (comparing three store layouts) and say what the model does and does not let you conclude.
Core vocabulary
- Categorical predictor. A predictor whose values are labels (levels), not magnitudes — here,
formatwith levelsin_person,hybrid,online. - Indicator (dummy) variable. A 0/1 column that is \(1\) when an observation belongs to a particular level and \(0\) otherwise. A predictor with \(k\) levels needs \(k-1\) indicators.
- Baseline / reference level. The one level that gets no indicator of its own; every coefficient is measured relative to it. By default R picks the first level alphabetically unless you set it.
- Coefficient as a group difference. For a categorical predictor, a coefficient is the gap between that level’s mean and the baseline’s mean — not the level’s mean by itself.
- Group mean (fitted). The model’s predicted response for a level: the intercept (baseline mean) plus that level’s coefficient.
- Factor. R’s data type for a categorical variable; the order of its levels decides the baseline.
Concept development
Indicator (dummy) variables
A regression line works by multiplying a predictor by a slope: \(\hat y = b_0 + b_1 x\). That sentence quietly assumes \(x\) is a number you can multiply. The label online is not. So before format can enter the model, it has to be re-expressed as numbers — and the honest way to do that is indicator coding. For each level except one, you create a 0/1 column that flags membership. With three formats you need two indicators:
\[ x_{\text{hyb}} = \begin{cases} 1 & \text{if format is hybrid} \\ 0 & \text{otherwise} \end{cases} \qquad x_{\text{onl}} = \begin{cases} 1 & \text{if format is online} \\ 0 & \text{otherwise} \end{cases} \]
An in-person student has \(x_{\text{hyb}} = 0\) and \(x_{\text{onl}} = 0\) — both flags off. A hybrid student has \(x_{\text{hyb}} = 1\), \(x_{\text{onl}} = 0\). An online student has \(x_{\text{hyb}} = 0\), \(x_{\text{onl}} = 1\). No student is ever flagged twice, and exactly one combination — both zeros — is left to stand for the baseline. The regression equation then reads:
\[ \hat y = b_0 + b_{\text{hyb}}\, x_{\text{hyb}} + b_{\text{onl}}\, x_{\text{onl}} . \]
Why \(k - 1\) indicators and not \(k\)? Because a \(k\)-th indicator would be perfectly redundant: if you know a student is neither hybrid nor online, you already know they are in-person. Adding that last column would let the model write the same fitted values in infinitely many ways, and the estimates would no longer be unique. The dropped level is not lost; it is absorbed into the intercept. R does this encoding for you the moment format is a factor — you write final ~ format and the two indicators appear behind the scenes.
The baseline level / reference coding
The level that gets no indicator of its own is the baseline (or reference) level. It is the anchor the whole comparison hangs from. Set both indicators to zero in the equation above and everything except the intercept vanishes:
\[ \hat y_{\text{in\_person}} = b_0 + b_{\text{hyb}}\cdot 0 + b_{\text{onl}}\cdot 0 = b_0 . \]
So with a categorical predictor, the intercept \(b_0\) is no longer “the response at \(x = 0\)” in the old numeric sense — it is the fitted mean of the baseline group. Every other coefficient is then read against that anchor. Which level becomes the baseline is a choice, and a consequential one for readability, even though it never changes the model’s fit or its predictions. By default R sorts the levels alphabetically and takes the first, so here hybrid would win the alphabet. For these notes we set the baseline to in_person, because “compared to the standard in-person section” is the comparison the course actually cares about. You change the baseline with relevel() or by setting the factor’s level order; the fitted group means stay identical, only the labels on the coefficients move. Choosing a baseline that makes your story easy to tell is good modeling hygiene, not cheating.
Coefficients as group differences, not means
Here is the hinge of the whole week, and the single idea most worth getting exactly right. A coefficient on a categorical predictor is a difference between that level’s mean and the baseline’s mean — never the level’s mean on its own. Plug a hybrid student into the equation:
\[ \hat y_{\text{hybrid}} = b_0 + b_{\text{hyb}}\cdot 1 + b_{\text{onl}}\cdot 0 = b_0 + b_{\text{hyb}} . \]
So \(b_{\text{hyb}} = \hat y_{\text{hybrid}} - \hat y_{\text{in\_person}}\): it is the hybrid-minus-in-person gap. Likewise \(b_{\text{onl}} = \hat y_{\text{online}} - \hat y_{\text{in\_person}}\). The coefficients answer “how far is each group from the anchor?”, and you recover a group’s actual fitted mean by adding its coefficient back onto the intercept. This is why a negative coefficient does not mean a group scored below zero or even below average — it means that group sits below the baseline. Keep the anchor in view and the table reads cleanly; drop the anchor and a difference masquerades as a mean. The next section makes this concrete with the locked studyhabits numbers.
Worked examples
Worked example — the three section formats (studyhabits)
We return to the recurring studyhabits dataset (synthetic; seed set, set.seed(33003); \(n = 200\) students standing in for a campus learning-analytics study — not real student data). The slice for this week is the final exam score final and the section format format. We make in_person the baseline so every comparison is “relative to the standard section,” then fit a regression of final on format.
set.seed(33003)
# format is categorical: in_person, hybrid, online
studyhabits$format <- relevel(factor(studyhabits$format), ref = "in_person")

fit <- lm(final ~ format, data = studyhabits)
summary(fit)

#> Coefficients:
#>               Estimate
#> (Intercept)      78.0     # baseline = in_person fitted mean
#> formathybrid     -3.0     # hybrid  - in_person  (a DIFFERENCE)
#> formatonline     -7.0     # online  - in_person  (a DIFFERENCE)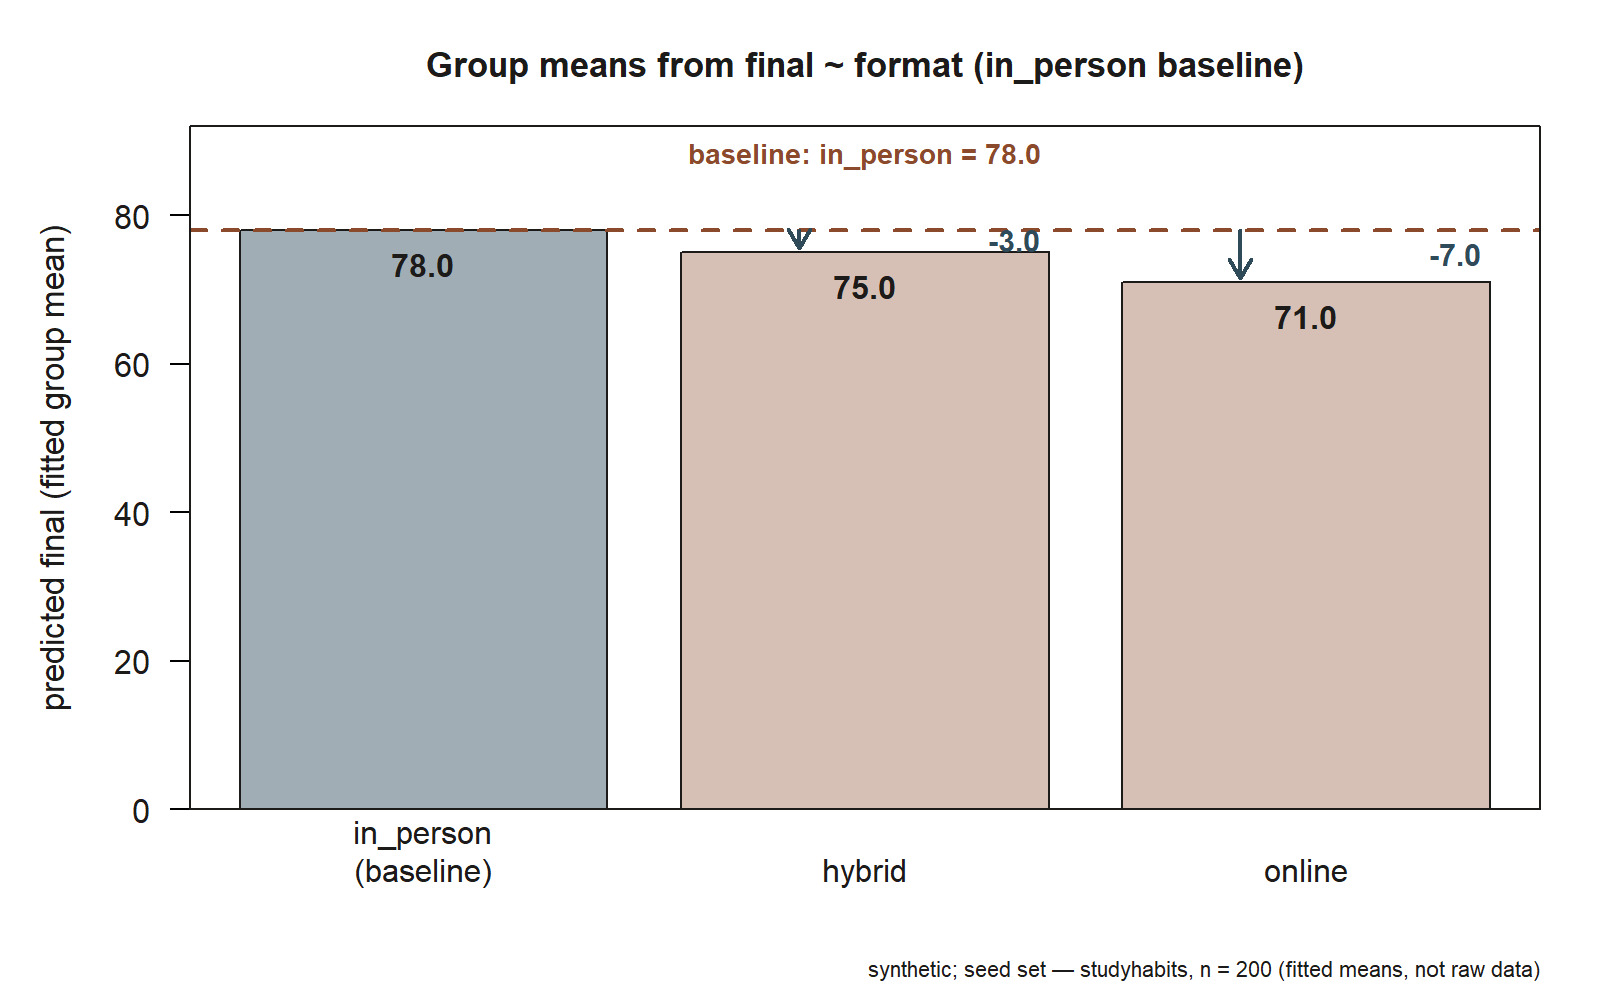
Read this from the anchor outward. The intercept \(b_0 = 78.0\) is not a generic baseline-at-zero — it is the fitted mean final exam score for the in-person sections: in-person students average \(78.0\) points. That is a mean, because in-person is the baseline.
The two format coefficients are differences, not means. The line formathybrid -3.0 says the hybrid sections average \(3.0\) points lower than in-person; it does not say hybrid students scored \(-3.0\). To get the hybrid group’s fitted mean you add the coefficient back onto the intercept:
\[ \hat y_{\text{hybrid}} = 78.0 + (-3.0) = 75.0 . \]
So hybrid students average \(75.0\) points. Similarly, formatonline -7.0 says online sections run \(7.0\) points below in-person, and the online fitted mean is
\[ \hat y_{\text{online}} = 78.0 + (-7.0) = 71.0 , \]
an average of \(71.0\) points. The model has reproduced all three group means — \(78.0\), \(75.0\), \(71.0\) — from one intercept and two differences. In plain language: among these synthetic sections, in-person scores highest, hybrid sits a few points back, and online trails furthest, about \(7\) points below the in-person anchor.
A modeling caution belongs here. These are associations in observed sections, not the causal effect of moving a student from one format to another. Students were not randomly assigned to formats; the kind of student who chooses online may differ systematically from the in-person crowd (in study hours, work hours, or prior GPA), and any of those could drive part of the \(7\)-point gap. The clean group-difference coefficients describe how the sections differ on average — they do not by themselves tell you that the format caused the difference. Holding other predictors constant, as Week 6 taught and Week 9 will extend, is the move that begins to separate format from its companions; a bare final ~ format cannot.
Worked example — comparing three store layouts (transfer)
Now move the idea to a new context. A regional retailer (synthetic; seed set) is testing three store layouts — call them grid, loop, and spine — and records weekly sales per store in thousands of dollars. The question is the same shape as the course question: how do the layouts compare? Make grid the reference layout (the chain’s current standard), and fit sales on layout.
set.seed(33003)
stores$layout <- relevel(factor(stores$layout), ref = "grid")

fit_stores <- lm(weekly_sales ~ layout, data = stores)
summary(fit_stores)

#> Coefficients:
#>               Estimate
#> (Intercept)      40.0     # grid fitted mean weekly sales ($000s)
#> layoutloop        6.0     # loop  - grid  (a DIFFERENCE)
#> layoutspine      -2.0     # spine - grid  (a DIFFERENCE)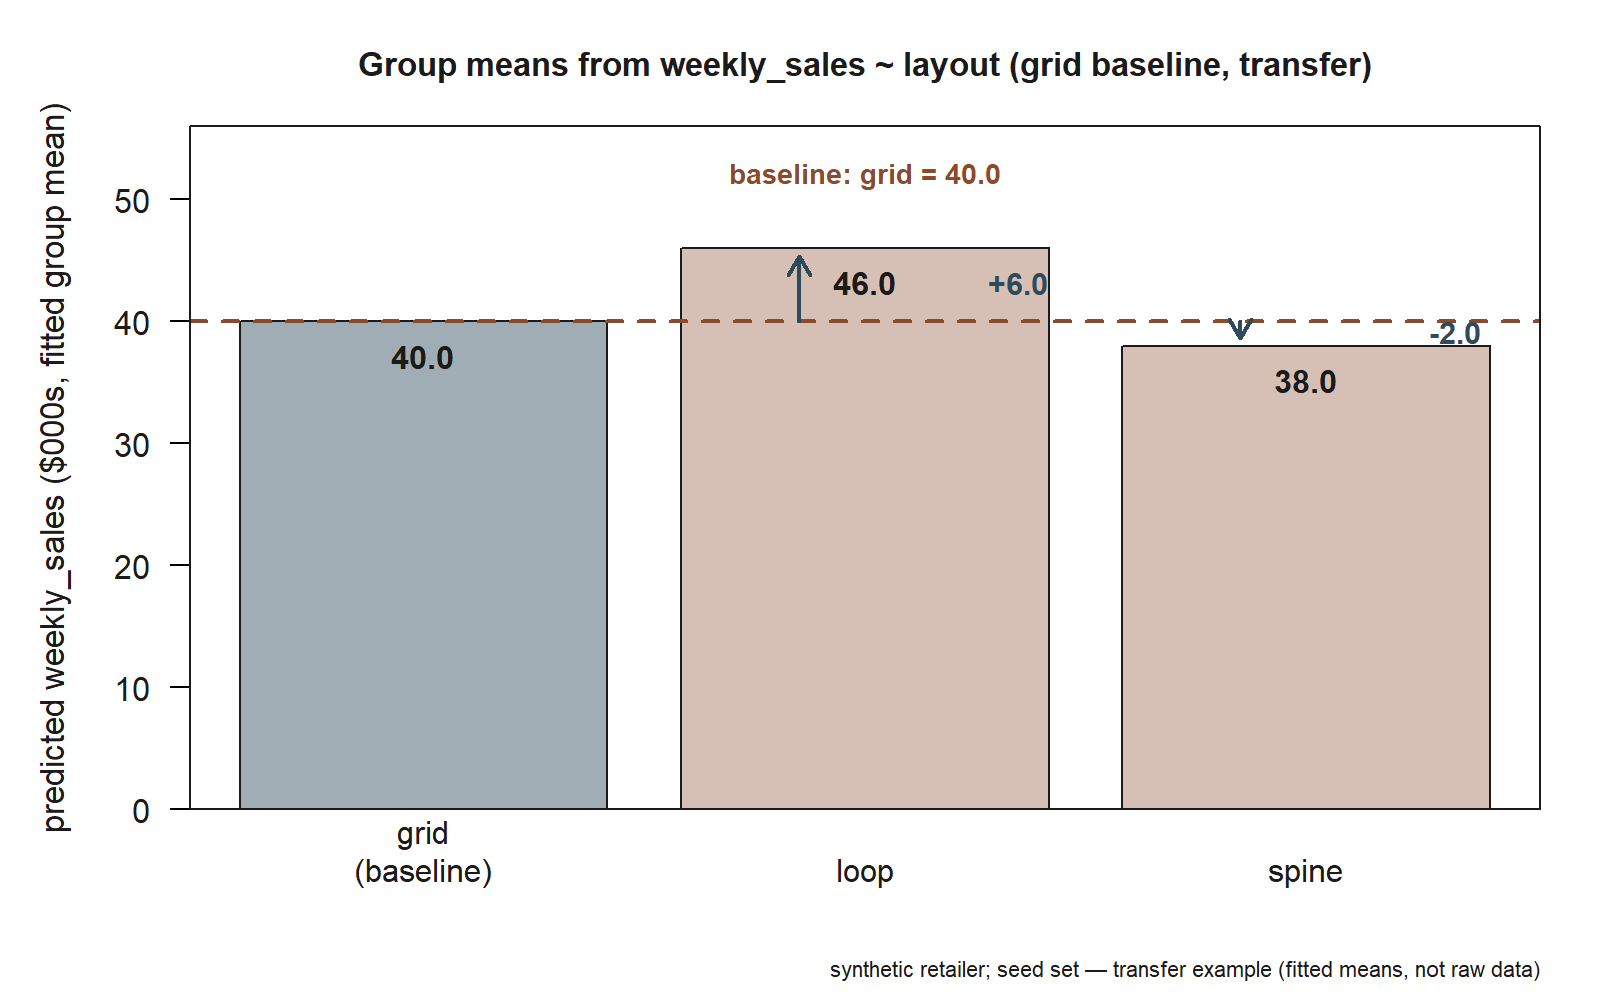
Read it the same way, anchor first. The intercept \(40.0\) is the fitted mean weekly sales for grid stores: about $40k per week. The coefficient layoutloop 6.0 is a difference — loop stores average $6k more than grid — so the loop fitted mean is \(40.0 + 6.0 = 46.0\), about $46k. The coefficient layoutspine -2.0 is also a difference — spine stores run $2k below grid — giving a spine fitted mean of \(40.0 + (-2.0) = 38.0\), about $38k. Loop comes out ahead, grid is the middle anchor, and spine trails slightly.
Notice the transfer. Nothing about the coefficients-as-differences logic changed when we swapped exam scores for sales, students for stores, or three formats for three layouts. The only judgment call was which level to make the reference, and we chose the chain’s current standard so every coefficient reads as “versus what we do now.” The same model-criticism caveat travels too: unless stores were assigned layouts at random, the layout differences are associations that could reflect store size, neighborhood, or foot traffic, not the layout alone. The coding is mechanical; the causal reading is not.
A common mistake
The mistake that swallows the most points of understanding here is forgetting the baseline — reading a categorical coefficient as a group’s mean rather than as a difference from the reference level. A student sees formatonline -7.0 and writes “online students scored \(-7\)” or, almost as often, “the online mean is \(7\).” Both are wrong, and both come from the same slip: losing track of the anchor. The coefficient \(-7.0\) is the gap between online and in-person; the online mean is \(78.0 - 7.0 = 71.0\), and you only recover it by adding the intercept back. A coefficient on a category is meaningless without the level it is being compared to held firmly in mind.
The cure is a habit. Whenever you read a categorical coefficient, say the comparison out loud with both groups named — “online minus in-person is \(-7\)” — before you say anything about a mean. Then recover each group mean explicitly as intercept-plus-coefficient and sanity-check that the means are on the response’s natural scale (here, exam points between \(0\) and \(100\); a “mean” of \(-7\) should have set off an alarm). A related slip is silently letting R’s alphabetical default choose the baseline and then narrating as if it were your intended reference: here the alphabet would crown hybrid, and your sentences about “compared to in-person” would quietly stop matching the table. Set the reference on purpose, and the coefficients say what you think they say.
Low-stakes self-checks (ungraded)
These are ungraded self-checks — no points, no submission. Use them to test whether the anchor-first reading has stuck.
- In
final ~ formatwithin_personas baseline, the coefficient ononlineis \(-7.0\). In one sentence, say what that number is the difference between, then recover the online group’s fitted mean. - A classmate reads
formathybrid -3.0and concludes “hybrid students average \(-3\) on the final.” Diagnose the error in one sentence and give the correct hybrid mean. - The intercept of
final ~ formatis \(78.0\). Why is this a group mean here, when infinal ~ studythe intercept was an extrapolated value at zero study hours? What changed? - If you
relevel()formatto makeonlinethe baseline, will the three fitted group means (\(78\), \(75\), \(71\)) change? Will the coefficients change? Explain the difference in one sentence. - In the store-layout model, the
loopcoefficient is \(6.0\) and thespinecoefficient is \(-2.0\). What is the fitted mean weekly sales for a loop store, and how much higher is loop than spine?
Reading and source pointer
For this week, read ModernDive Chapter 5 on regression with a single categorical predictor, and look ahead to ModernDive Chapter 6, which carries categorical predictors into models with several predictors at once. Chapter 5 builds the intuition that a regression with a categorical \(x\) is producing group means and differences; Chapter 6 shows the same indicators living alongside numeric predictors, which is exactly where Weeks 9 and 13 are headed. These notes are the course’s own synthesis, grounded in but not copied from the sources.
Public vs. graded
These notes, the examples, and the practice here are public and ungraded — study material only. No graded prompts, answer keys, rubrics, point values, or due dates appear on this site. Graded modeling checkpoints, labs, quizzes, homework/modeling memos, the midterm, the project, and the final live in Blackboard (the LMS), which is authoritative for due dates, submissions, and grades. If this page and Blackboard ever disagree, follow Blackboard.
Looking ahead
Next week we let a slope depend on the group rather than just shifting the intercept: interactions and effect modification, where studying buys a different number of points for students who also work many hours than for those who do not — final ~ study * works, with the study slope changing from \(2.8\) to \(1.6\) across groups.
See also
- Notation glossary — the fixed symbols used across the course.
- Modeling reference — the running model catalogue.
- Week 6 — Multiple regression & adjustment — adding predictors and holding them constant, the setup for putting
formatalongside numbers. - Week 9 — Interactions & effect modification — where next week takes the group idea.
- Week 13 — ANOVA, regression & broader modeling — where
final ~ formatis revealed to be one-way ANOVA.