Week 3 — Random sampling vs random assignment
The signature distinction: population claims vs causal claims
The week question
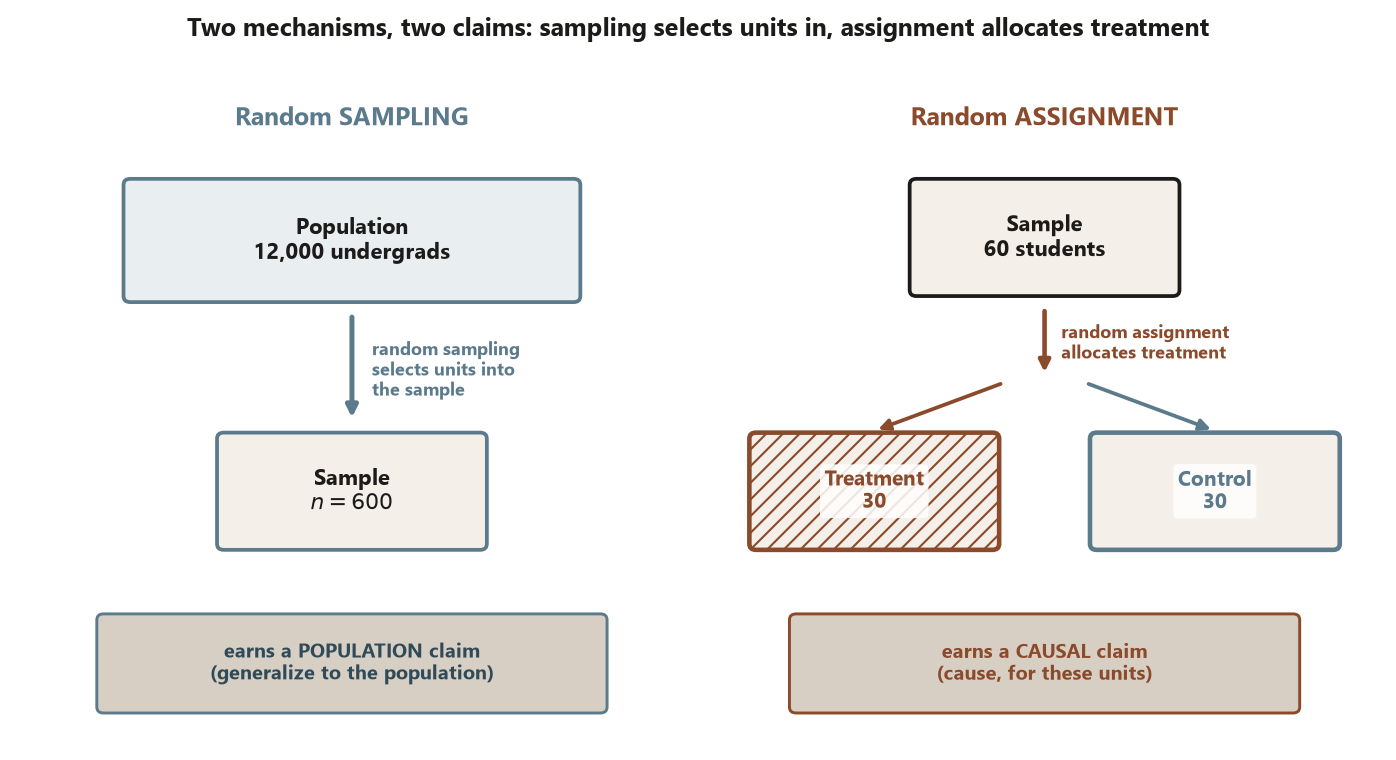
When does a study let you talk about a whole population, and when does it let you talk about a cause? This week answers that with the single distinction the rest of the course returns to: a study earns the right to make a population claim only through random sampling, and it earns the right to make a causal claim only through random assignment. These are two different mechanisms acting at two different moments — one selects which units enter the sample, the other allocates which units get the treatment. A study can have one, both, or neither, and reading the wrong claim off the wrong mechanism is the most common mistake in all of applied statistics.
Why this matters
Almost every overstated headline you have ever read confuses these two ideas. A survey on a carefully drawn random sample tells you what a population believes, but it cannot tell you that one thing caused another. A tightly controlled randomized experiment tells you that a treatment worked for the units in the study, but if those units were a convenience group, it says nothing about any wider population. The mechanism you used decides the kind of claim you have earned — not the size of your sample, not how small your p-value is, and not how sophisticated your model looks.
This course is about the design that produced the data and what that design can support. So the sampling-versus-assignment distinction is not one topic among many; it is the lens for every later week. Bias and confounding (Week 4), completely randomized experiments (Week 5), observational studies (Week 9), and surveys (Week 11) are all just this distinction worked out in detail. Get it crisp now and the rest of the term is bookkeeping on top of it.
A scheduling note that is only a calendar fact: Labor Day falls on Monday, September 7, so there is no Monday class that week and Week 3 runs Wednesday/Friday compressed. Nothing about the content changes — the two ideas below are the whole job of the week.
Learning goals
By the end of this week you should be able to:
- Define random sampling and random assignment as distinct mechanisms, and say when in a study each one acts.
- State precisely what each mechanism licenses: sampling earns a population (generalization) claim; assignment earns a causal (internal-validity) claim.
- Place any study in the 2×2 of sampling × assignment and read off which claims it can and cannot support.
- Explain why a study with assignment-but-not-sampling can support a causal claim that may not generalize, and why a study with sampling-but-not-assignment can support a population claim that is not causal.
- Catch the signature error (Risk 1) — reading a causal claim off sampling, or a population claim off assignment — in your own writing and in published claims.
Core vocabulary
- Unit of analysis — the entity a row of data describes, and the thing a design samples or assigns (a student, a class, a dorm floor). The mechanism acts on units.
- Population / process — the larger thing the claim is meant to be about (all enrolled undergraduates; all students like the ones studied).
- Sampling frame — the operational list you can actually draw from (a registrar email list). Frame \(\neq\) population is coverage error, taken up in Week 11.
- Random sampling — the mechanism that selects units into the sample. It earns population claims, because every unit had a known, nonzero chance of being included.
- Random assignment — the mechanism that allocates treatment to units. It earns causal claims, because it makes the treated and control groups exchangeable in expectation, balancing both measured and unmeasured pre-treatment differences.
- Treatment / exposure \(Z\), outcome \(Y\), covariate \(X\) (a pre-treatment variable).
- Internal validity — does the design support the causal claim here, for these units? External validity — does the result generalize there, to a wider population? Assignment buys the first; sampling buys the second. Keep them separate (Risk 6, previewed).
Concept development
Random sampling: the mechanism that earns a population claim
Random sampling is a rule for getting from a population (or frame) into a sample. In a simple random sample every unit on the frame has the same chance of selection, and the selection is made by a chance device, not by who volunteers or who is easy to reach. Because the chance mechanism — not the units’ own traits — decides who is measured, the sample is representative in expectation, and a summary computed on the sample (a mean, a proportion) is an unbiased estimate of the same summary in the population. That is exactly what licenses a population claim: a statement of the form “in the population, about such-and-such fraction do X,” with a quantified margin of error.
Notice what random sampling does not do. It does not assign anyone to a treatment, so it cannot make two groups comparable on anything; it just decides who is observed. So sampling, on its own, never earns a causal claim. You can survey a perfect random sample of students and find that coffee drinkers sleep less — that is a real population association, but the sampling that earned it says nothing about whether coffee causes the lost sleep.
Random assignment: the mechanism that earns a causal claim
Random assignment is a rule for getting from a set of units into treatment groups. After the units are in hand — however they got there — a chance device decides who receives the treatment and who serves as control. The payoff is comparability: because the coin, not the students’ prior ability or motivation, decides the groups, the treated and control groups have, in expectation, the same distribution of every pre-treatment variable — the ones you measured and the ones you never thought of. That balance is what makes a difference in outcomes attributable to the treatment rather than to some background difference. In potential-outcomes language, assignment makes treatment independent of \(\{Y(1), Y(0)\}\), so the observed difference estimates the average treatment effect \(\text{ATE} = E[Y(1) - Y(0)]\).
And notice what assignment does not do. It does not control which units you started with. If your 60 students were the ones who showed up to a single section, random assignment makes the causal claim internally valid for those 60, but it gives you no warrant to generalize to all undergraduates — that warrant would have to come from sampling. Assignment buys the cause; it does not buy the population.
The 2×2 of sampling × assignment
Because the two mechanisms are independent, every study lands in one of four boxes. The cell tells you exactly which claims you have earned.
| Random assignment: YES | Random assignment: NO | |
|---|---|---|
| Random sampling: YES | Causal and population: the gold standard — randomized experiment on a random sample. Generalizable cause. | Population, not causal: a survey / well-sampled observational study. Estimates a population quantity or association. |
| Random sampling: NO | Causal, not (yet) population: a randomized experiment on a convenience group. Internally valid cause; external validity unargued. | Neither, by design: a convenience observational study. Association only, for an unrepresentative group. |
Read the table as a claim machine. Move down a column and you lose the population claim (you can no longer generalize). Move right across a row and you lose the causal claim (you can no longer say “caused”). The top-left box is rare and precious; most real studies sit elsewhere, and the honest move is to claim only what your box allows and to name what it cannot support.
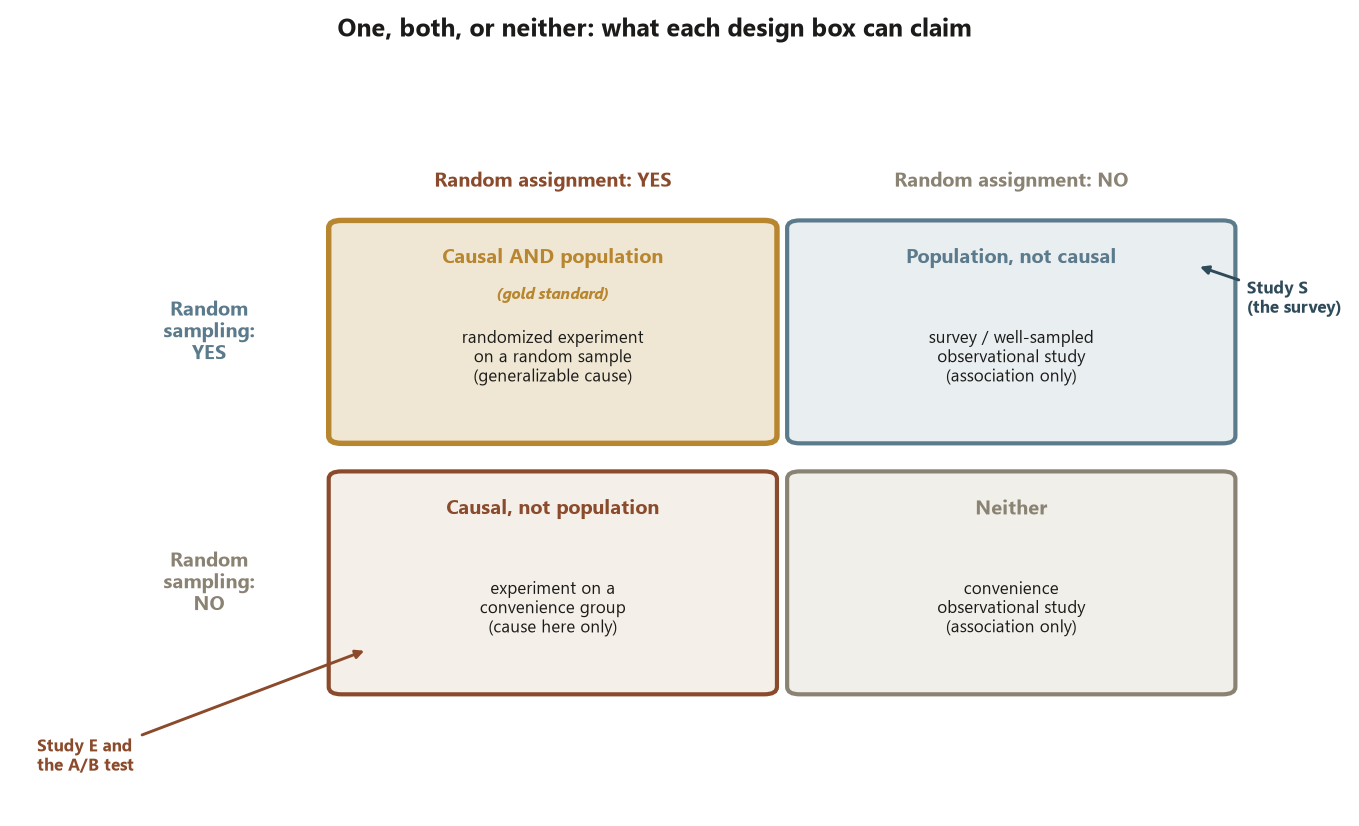
The recurring campus studies are deliberately built to occupy different boxes. The study-habits survey (Study S) uses sampling but not assignment — bottom-left of nothing, top-right of the table — so it earns a population proportion but no cause. The Focus experiment (Study E) uses assignment but not sampling — bottom-left — so it earns a cause for its students but no automatic generalization. Laying them side by side is the heart of this week.
Worked examples
Worked example — the survey and the experiment, side by side (recurring slice)
These are the locked synthetic numbers for the campus world; data are synthetic, seed set.
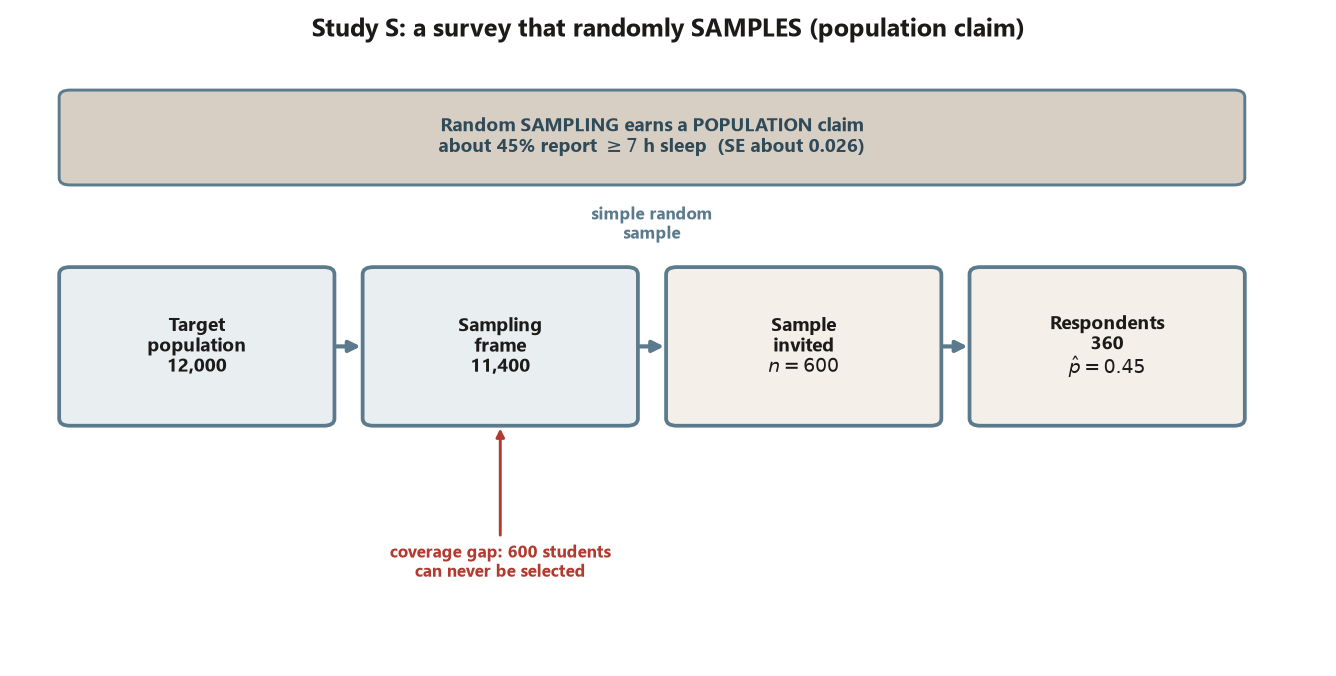
Study S — the study-habits survey (sampling, no assignment). The target population is all \(12{,}000\) enrolled undergraduates. The sampling frame is the registrar email list of \(11{,}400\) — a coverage gap of \(600\) students with no active campus email, who can never be selected. From the frame a simple random sample of \(n = 600\) is invited; \(360\) respond. Among the \(360\) respondents, the proportion reporting \(\ge 7\) hours of sleep is
\[ \hat p = \frac{162}{360} = 0.45, \qquad \operatorname{SE}(\hat p) = \sqrt{\frac{0.45 \cdot 0.55}{360}} \approx 0.026, \]
giving an approximate 95% interval of \((0.40, 0.50)\). Interpretation, naming the design move: the random sampling is what was done to the units, so this earns a population claim — we estimate that about \(45\%\) of the sampled population report adequate sleep, with a margin of error near \(\pm 5\) points. No treatment was assigned, so there is no causal claim here at all: nothing in this design says that sleep causes anything, only that this fraction sleeps. (The frame gap of \(600\) and the \(240\) nonrespondents threaten even the population claim — that is Week 11’s problem, not this week’s.)
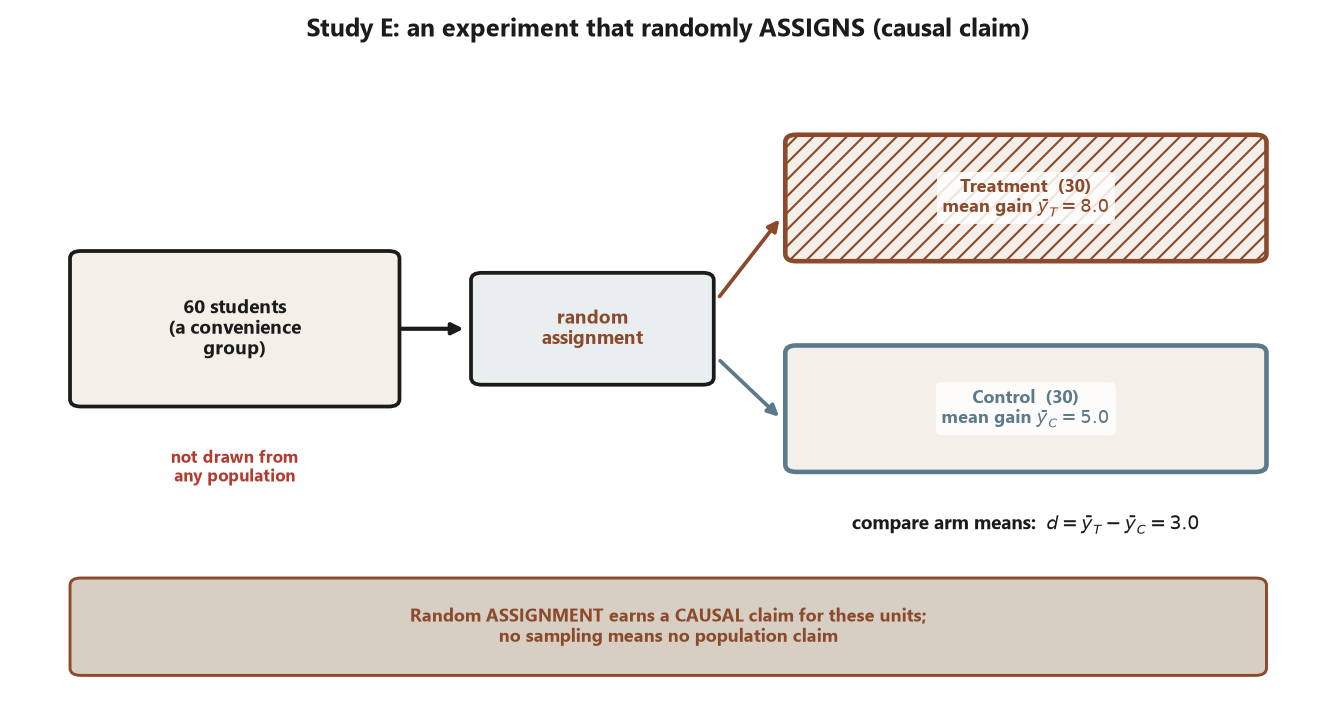
Study E — the Focus study-skills experiment (assignment, no sampling). Here \(n = 60\) students are randomized \(30\) to a study-skills workshop and \(30\) to control, and the outcome is a timed problem-solving gain score. The treatment mean gain is \(\bar y_T = 8.0\) and the control mean gain is \(\bar y_C = 5.0\), so the observed effect is
\[ d = \bar y_T - \bar y_C = 8.0 - 5.0 = 3.0 \text{ points.} \]
Interpretation, naming the design move: the random assignment is what was done to the units, so this earns a causal claim — for students like these, the workshop causes about a \(3.0\)-point gain on average, because the coin (not prior ability) decided the groups and made them comparable. But the \(60\) students were not randomly sampled from any population, so this earns no population claim: we cannot say the \(3.0\)-point effect holds for all undergraduates, only for units like the ones in the study. Assignment bought the cause; the missing sampling means external validity is unargued.
Put the two next to each other and the distinction is unmissable: same campus, same questions, different mechanism, different licensed claim. The survey can generalize but not attribute cause; the experiment can attribute cause but not generalize. Neither study is “better” — each earned exactly the claim its mechanism supports.
A small static computation makes the two mechanisms concrete. The code is shown as teaching and is not executed.
set.seed(45403)  # course seed; data are synthetic

# --- Study S: random SAMPLING selects units into the sample ---
frame_size <- 11400                       # registrar email list (coverage gap of 600 vs 12,000)
sampled    <- sample(frame_size, size = 600)   # SRS: each frame unit equally likely
# 360 of the 600 respond; 162 report >= 7 hours of sleep
p_hat <- 162 / 360                          # 0.45  -> a POPULATION proportion claim
se_p  <- sqrt(p_hat * (1 - p_hat) / 360)    # ~0.026 -> 95% CI about (0.40, 0.50)
# sampling earns a population claim; NO treatment assigned -> NO causal claim

# --- Study E: random ASSIGNMENT allocates treatment to units ---
students <- 1:60
treat    <- sample(students, size = 30)     # 30 to workshop, 30 to control
ybar_T <- 8.0                               # treatment mean gain (synthetic)
ybar_C <- 5.0                               # control mean gain   (synthetic)
d      <- ybar_T - ybar_C                   # 3.0 points -> a CAUSAL claim for these units
# assignment earns a causal claim; NO sampling frame -> generalization NOT earned
The two sample() calls look almost identical in R, and that is the trap the whole week guards against: the same verb does two opposite jobs. The first sample() chooses who is observed (sampling → population claim); the second chooses who is treated (assignment → causal claim). The code cannot tell you which claim you earned — only the design role of the draw can.
Worked example — a randomized email A/B test on a mailing list (transfer)
Now move to a new context with clearly illustrative (not locked) numbers. A campus newsletter team runs an A/B test: among the \(8{,}000\) people on their self-selected mailing list, they randomly assign half to subject line A and half to subject line B, then measure the open rate. Suppose \(2{,}000\) of the \(4{,}000\) A-recipients open (\(50\%\)) versus \(1{,}760\) of the \(4{,}000\) B-recipients (\(44\%\)), an estimated lift of
\[ \hat\Delta = 0.50 - 0.44 = +0.06 \;=\; +6 \text{ percentage points.} \]
Where is this in the 2×2? There is random assignment (a coin decided A vs B), so the lift is a causal claim: subject line A causes about a \(6\)-point higher open rate for people on this list. There is no random sampling — the list is whoever signed up, not a random draw from any broader population — so there is no population claim: we cannot say A would beat B by \(6\) points among all campus email users, only among this self-selected list. This is the bottom-left box: internally valid cause, external validity unargued.
The transfer to remember: the A/B test and the Focus experiment live in the same box despite looking nothing alike — both assigned treatment to a non-random group, so both earn a cause without earning a population. Recognizing the box, not the surface details, is the skill.
A common mistake
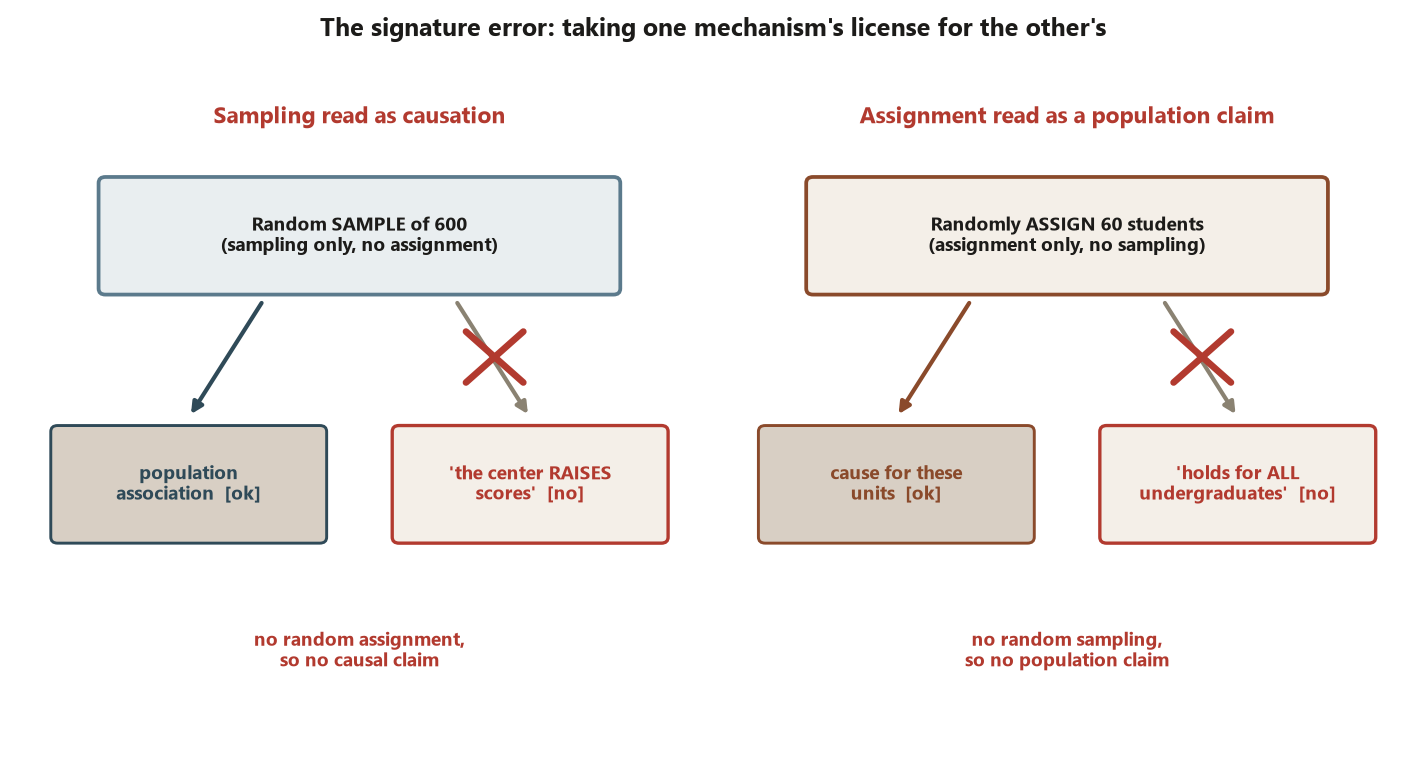
The signature error (Risk 1): reading a causal claim off sampling, or a population claim off assignment. The two failures are mirror images:
- Sampling read as causation. “We surveyed a random sample of \(600\) students and found that tutoring- center users score higher, so the center raises scores.” The random sampling earns only a population association; with no random assignment, you cannot attribute the gap to the center. Self-selected users may differ in prior ability — a confounder waiting in Week 4. The correct claim is “in the population, using the center is associated with higher scores,” full stop.
- Assignment read as a population claim. “We randomly assigned \(60\) students and the workshop raised gains by \(3.0\) points, so the workshop raises gains by \(3.0\) points for all undergraduates.” The random assignment earns a causal claim for units like these \(60\); with no random sampling, the jump to all undergraduates is unsupported. The correct claim names its scope: “for students like those in the study, the workshop causes about a \(3.0\)-point gain.”
Both mistakes substitute one mechanism’s license for the other’s. The fix is a two-step habit you can apply to any claim: (1) name the mechanism — was there random sampling, random assignment, both, or neither? (2) state only the matching claim — population from sampling, cause from assignment — and explicitly say what the design cannot support. A small p-value never repairs a missing mechanism: it cannot turn a survey into a cause or an experiment into a generalization (a preview of Risk 5).
Low-stakes self-checks (ungraded)
These are practice only — nothing here is graded.
- A study draws an SRS of \(600\) students and reports that \(45\%\) sleep at least \(7\) hours. Which mechanism is present, and which single claim has it earned? Which claim has it not earned?
- A study randomizes \(60\) students \(30/30\) to a workshop and finds a \(3.0\)-point gain. Name the box in the 2×2 it occupies, and write one sentence that claims exactly what it earned and disclaims what it did not.
- Rewrite this overstatement so it is honest about its mechanism: “A random sample shows gym users are healthier, so the gym makes students healthier.”
- For the email A/B test, suppose the team now draws the \(8{,}000\)-person list as a random sample from all campus email users before assigning A/B. Which box does the study move to, and which new claim becomes available?
- Give one study you can imagine that has neither random sampling nor random assignment, and say which of the four claims (population, cause, both, neither) it can support.
Reading and source pointer
This week is grounded in the instructor notes (primary) and in IMS (Çetinkaya-Rundel & Hardin), the study-design and sampling material that introduces random sampling and random assignment as distinct ideas and motivates which claim each supports. Read that chapter for the concept sequence and terminology level; the side-by-side survey-versus-experiment framing and the 2×2 claim table here are the course’s own organization. These notes are the course’s own synthesis, grounded in but not copied from the sources.
Public vs. graded
These notes, the examples, and the practice here are public and ungraded — study material only. No graded prompts, answer keys, rubrics, point values, or due dates appear on this site. Graded design checkpoints, weekly quizzes, design memos and homework, applied design labs, the midterm, the final design project, and the final exam live in Blackboard (the LMS), which is authoritative for due dates, submissions, and grades. If this page and Blackboard ever disagree, follow Blackboard.
Looking ahead
Next week turns the distinction into a threat list. Once you know that only assignment earns a cause, the obvious question is what goes wrong when assignment is absent — and the answer is bias, confounding, and validity (Week 4), where the tutoring-center observational study shows a naive \(+8.0\) gap shrinking to an adjusted \(+3.0\) once a confounder is taken into account. We carry the sampling-versus-assignment lens straight into it: every threat we name is a story about a missing or broken mechanism.