Week 11 — Surveys and sampling frames
Target populations, frames, coverage, and nonresponse
The week question
For ten weeks the campus world has been about causes — whether the Focus workshop raises gain scores, whether the tutoring center helps once you adjust for who chose to use it. This week the question changes shape. The study-habits survey does not assign anything to anyone; it asks a sample of students how much they sleep and reports a single proportion back to the whole campus. So the week question is a sampling question, not a causal one: when you measure a quantity on a sample of people, what exactly has to be true for that number to describe the population you care about — and which gaps between the people you wanted, the people you could reach, and the people who actually answered will quietly bend the answer?
The design move here is random sampling, and it is a different move from random assignment. Random sampling earns you a population claim — a statement about all undergraduates — and nothing more. It does not earn a causal claim, because no one was assigned anything. Keeping that boundary sharp is the whole point of the week.
Why this matters
A survey can be analyzed flawlessly and still be wrong, because the errors that matter most happen before the arithmetic. If the list you sample from leaves people out, no confidence interval will tell you. If the people who answer differ from the people who do not, the cleanest standard error in the world is computed on the wrong group. The sampling formula answers a narrow question — how much would this estimate bounce around if I drew a fresh random sample of the same size? — and it answers nothing about coverage or nonresponse.
That matters because students (and reporters, and administrators) routinely read a tight interval as a guarantee of accuracy. It is not. A poll of 600 people can have a margin of sampling error near three percentage points and still be off by twenty, if a quarter of the people invited never reply and they differ systematically from those who do. This week teaches you to size both kinds of uncertainty and to notice that, for the study-habits survey, the sampling interval is the small one. The threat is the gap between who was invited and who answered, and you bound that threat with reasoning, not with \(\sqrt{\hat p(1-\hat p)/n}\).
This is also where overclaiming creeps in. A survey of this campus, drawn from this frame, supports a claim about these undergraduates — not about students nationally, and not about a causal effect of anything. Naming the population the design actually reached is as important as naming the number.
Learning goals
By the end of this week you should be able to:
- distinguish the target population, the sampling frame, and the sample, and identify the coverage gap between the first two;
- explain why random sampling earns a population claim and not a causal one, and resist the slide from one to the other;
- compute the standard error of a sample proportion under simple random sampling and turn it into a 95% confidence interval, then state precisely what that interval does and does not cover;
- distinguish the nonresponse rate from the response proportion, and build a nonresponse sensitivity bound that brackets where the truth could sit if respondents and nonrespondents differ;
- recognize when nonresponse, not sample size, is the dominant source of error, and refuse to generalize beyond the frame the design actually sampled.
Core vocabulary
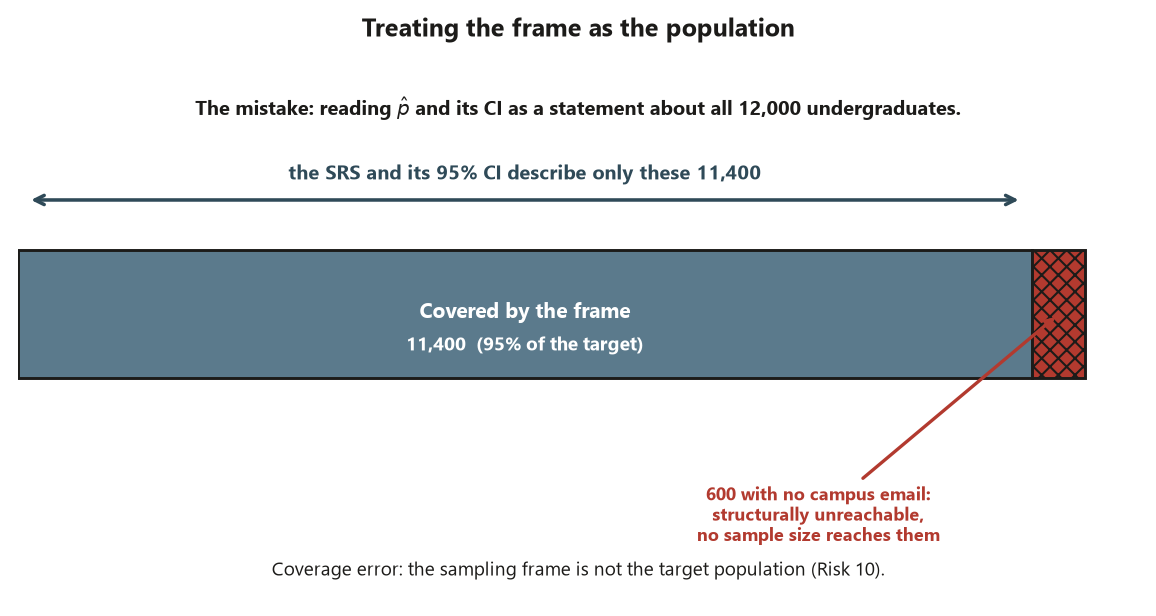
- Target population — the full set of units the claim is about. Here: all \(12{,}000\) enrolled undergraduates.
- Sampling frame — the operational list you can actually draw from. Here: the registrar email list, \(11{,}400\) students. The frame is what you sample; the population is what you want to talk about.
- Coverage error — the mismatch when the frame \(\neq\) the population. The \(600\) students with no active campus email are undercovered: they can never be selected, so no sample size fixes them (Risk 10).
- Sample — the units actually drawn from the frame. Here: \(n = 600\) invited under simple random sampling.
- Simple random sample (SRS) — every set of \(n\) units in the frame is equally likely to be the sample. It is the design that makes the proportion formula and its standard error valid.
- Sample proportion \(\hat p\) — the fraction of respondents with the trait of interest (here, \(\ge 7\) hours of sleep). The estimate; the unknown population proportion \(p\) is the estimand.
- Standard error of a proportion \(\operatorname{SE}(\hat p) = \sqrt{\hat p(1-\hat p)/n}\) — the typical sampling-to-sampling wobble of \(\hat p\), under SRS.
- Nonresponse — invited units that do not answer. The nonresponse rate is their share of those invited; it is not the same as \(\hat p\), which is computed only on respondents.
- Nonresponse bias — the systematic error when nonrespondents differ from respondents on the very thing you measure. Sampling SE does not capture it; a sensitivity bound does (Risk 11).
Concept development
Target population, frame, and sample — three nested groups, two gaps
Every survey has three groups, and the two gaps between them are where the trouble lives. The target population is what you want to describe: all \(12{,}000\) undergraduates. The sampling frame is the list you can physically draw names from: the registrar email list, \(11{,}400\) students. The sample is who you actually selected: \(n = 600\).
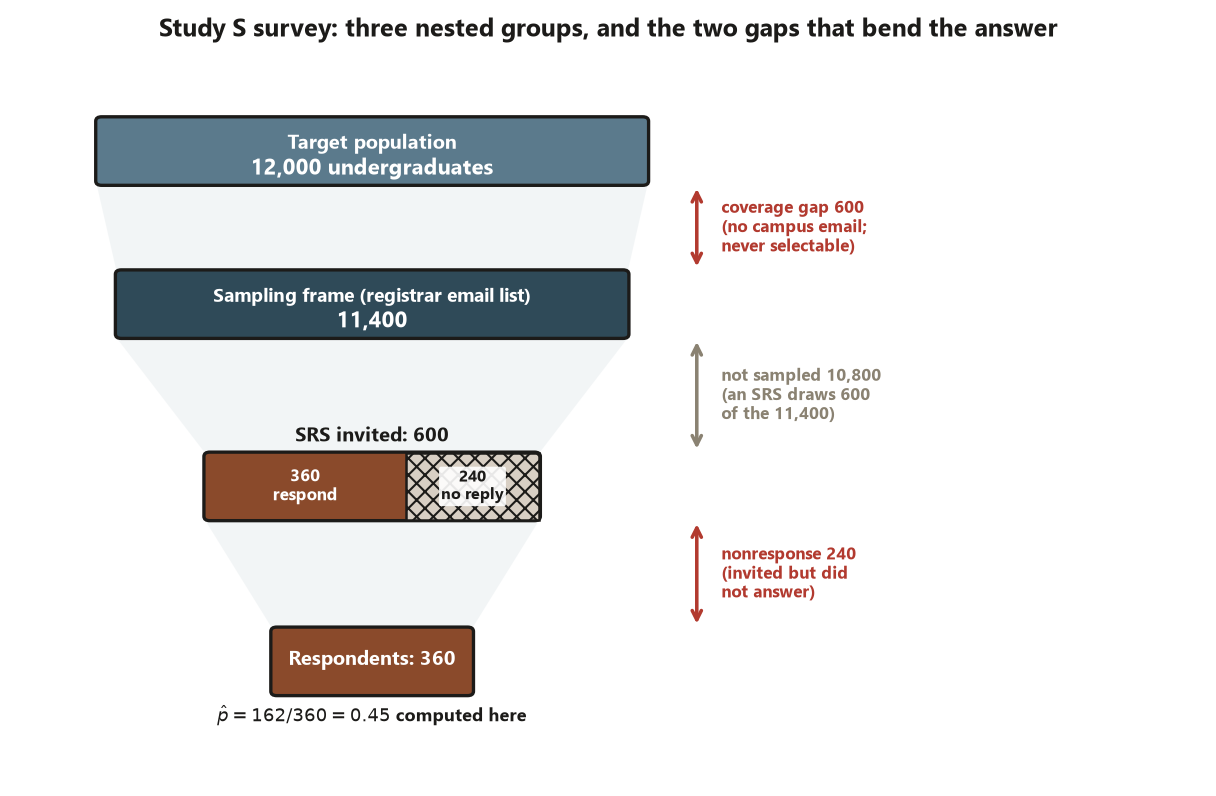
The first gap, population minus frame, is coverage error. Here it is \(12{,}000 - 11{,}400 = 600\) students who hold no active campus email. They are not unlucky in the draw — they are structurally unreachable. A random sample of the frame can only ever speak for the \(11{,}400\), so if the \(600\) excluded students sleep differently (say, more part-time or off-campus students who never set up campus mail), the estimate is biased toward the covered group no matter how large \(n\) grows. This is why a larger sample is no cure for undercoverage: you would just be sampling the same incomplete frame more thoroughly. The design move is to name who the frame leaves out and limit the claim accordingly.
The second gap, sample minus respondents, is nonresponse, and it is the §“Concept development” beat below. The discipline of the week is to keep these three groups — and their two gaps — labeled at every step, so you never quietly let “the frame” stand in for “the population” (Risk 10).
Random sampling earns a population claim — and only that
The reason an SRS is worth the trouble is that the selection mechanism is a known chance process, and that is what licenses the leap from \(\hat p\) to a statement about \(p\). Because every student in the frame had the same chance of selection, the sample is, in expectation, a miniature of the frame, and the sampling distribution of \(\hat p\) is centered on the frame’s true proportion. That is a population claim: it is about who the undergraduates are, not about what would happen if you changed something.
It is emphatically not a causal claim. No one was assigned to sleep more or less; you only observed how much people already sleep. If the survey found that students who sleep more also earn higher grades, random sampling would let you say that pattern holds in the population — but it would say nothing about whether sleep causes the grades, because the design has no random assignment to break confounding (Risk 1). Random sampling and random assignment are independent design choices; this study has the first and not the second, so it earns a population claim and stops there. Read week 3 again if that boundary feels slippery — it is the course’s signature distinction, and the survey is where it is easiest to overstep.
The sampling SE of a proportion — and what it does not cover
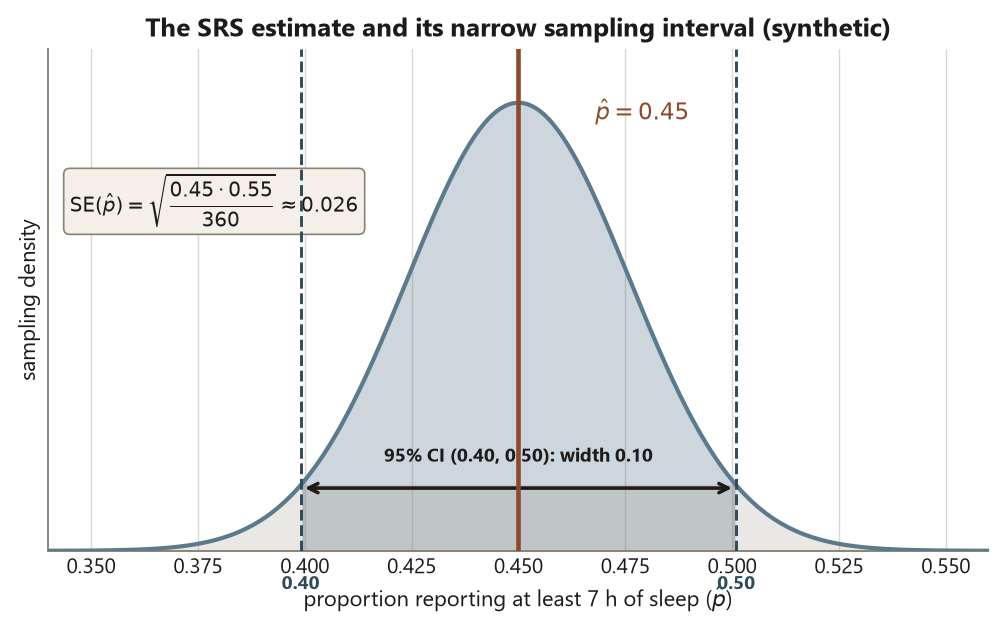
Once you have an SRS and a respondent proportion \(\hat p\), the sampling standard error measures only how much \(\hat p\) would jump around across repeated random samples of the same size from the same frame: \[ \operatorname{SE}(\hat p) = \sqrt{\frac{\hat p\,(1 - \hat p)}{n}}. \] A 95% confidence interval is then \(\hat p \pm 1.96 \times \operatorname{SE}(\hat p)\). The interval is a statement about sampling variability under SRS — the luck of the draw — and absolutely nothing else. It assumes the frame covers the population and that every invited person answered. When neither holds, the formula still produces a tidy number; it is just answering a question you did not ask. The next beat shows that for this survey the sampling interval is the narrow uncertainty, and the wide one comes from the 240 people who never replied.
Nonresponse and nonresponse bias — the threat the SE cannot see
Of the \(600\) invited, 360 respond (a 60% response rate) and 240 do not. The proportion \(\hat p = 0.45\) is computed on the 360 respondents only. The danger is that the 240 nonrespondents differ on sleep — perhaps the busiest students, who sleep least, are also the least likely to fill out a survey. If so, \(\hat p\) over the respondents is a biased estimate of \(p\) over the whole sample, and the sampling SE — which never looks at the 240 at all — cannot detect it.
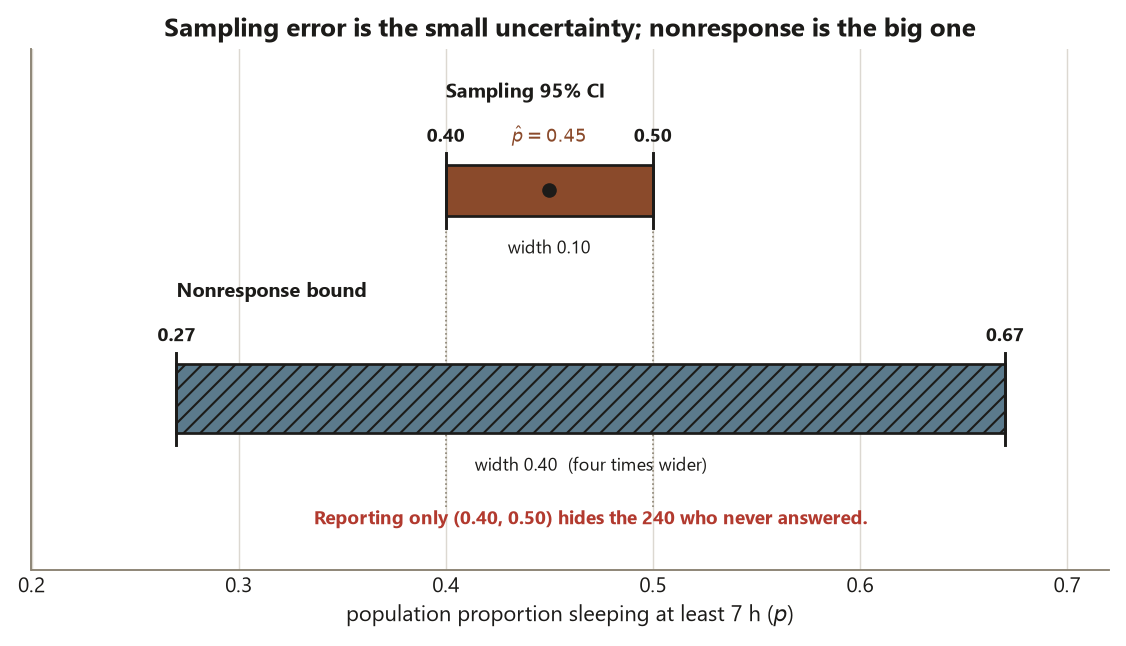
Because you cannot know how the 240 would have answered, you bound it. Hold the 162 known “yes” answers fixed and imagine the two extremes for the missing 240. If all 240 sleep \(<7\) hours, the population proportion among the 600 is \(162/600 = 0.27\). If all 240 sleep \(\ge 7\) hours, it is \((162 + 240)/600 = 0.67\). The nonresponse bound \([0.27, 0.67]\) is the honest range of where \(p\) could sit given who answered, and it dwarfs the sampling CI \((0.40, 0.50)\). That comparison is the lesson of the week: nonresponse, not sample size, is the threat, and you do not assume it away as missing-completely-at-random — you bound it (Risk 11). Week 13 names the mechanism (MCAR / MAR / MNAR) behind this bound formally.
Worked examples
Worked example — the study-habits survey (the recurring slice)
Design. A campus survey estimates the proportion of undergraduates who get adequate sleep (\(\ge 7\) hours). The target population is all \(12{,}000\) enrolled undergraduates. The sampling frame is the registrar email list, \(11{,}400\) students — a coverage gap of \(600\). From the frame, an SRS of \(n = 600\) is invited; 360 respond, 240 do not. Among the 360, \(162\) report \(\ge 7\) hours, so \(\hat p = 162/360 = 0.45\). Data are synthetic; seed set.
Sampling SE and CI. \[ \operatorname{SE}(\hat p) = \sqrt{\frac{0.45 \times 0.55}{360}} = \sqrt{\frac{0.2475}{360}} \approx 0.026, \qquad 0.45 \pm 1.96 \times 0.026 \approx (0.40,\ 0.50). \] Interpretation. The unit sampled is the individual student, and what was sampled (not assigned) is a random 600 from the 11,400-name frame. The interval \((0.40, 0.50)\) says: if the frame covered the population and if every invitee answered, then across repeated SRS draws the respondent proportion would land in this band about 95% of the time. It is a population claim about adequate sleep, and it is not a causal claim about anything.
Coverage check. The \(600\) undercovered students can never be selected, so even this interval speaks, at best, for the \(11{,}400\) in the frame — not the full \(12{,}000\) (Risk 10). Naming that gap is part of stating the claim.
Nonresponse bound. The 240 nonrespondents are the real exposure. Holding the 162 known “yes” answers fixed: \[ \text{lower} = \frac{162}{600} = 0.27, \qquad \text{upper} = \frac{162 + 240}{600} = 0.67, \qquad \text{bound} = [0.27,\ 0.67]. \] Interpretation. The sampling CI has width \(0.10\); the nonresponse bound has width \(0.40\) — four times wider. The thing that could most move the answer is not how many you sampled but who declined to answer (Risk 11). Reporting only \((0.40, 0.50)\) would understate the real uncertainty by ignoring the 240. And the claim stays inside the frame: this is a statement about these undergraduates, not a national one (Risk 13).
set.seed(45403)

# --- Study-habits survey (synthetic; seed set) -------------------------------
target_pop  <- 12000        # all enrolled undergraduates (the claim is about these)
frame       <- 11400        # registrar email list (what we can actually sample)
coverage_gap <- target_pop - frame
coverage_gap                                  # 600 undercovered (Risk 10)

n_invited   <- 600          # SRS drawn from the frame (random SAMPLING, not assignment)
n_respond   <- 360          # respondents (60% response rate)
n_nonresp   <- n_invited - n_respond
n_yes       <- 162          # respondents reporting >= 7 hours of sleep

p_hat <- n_yes / n_respond
p_hat                                          # 0.45

se_phat <- sqrt(p_hat * (1 - p_hat) / n_respond)
se_phat                                        # ~ 0.026  (SAMPLING variability only)

ci <- p_hat + c(-1, 1) * 1.96 * se_phat
round(ci, 2)                                   # (0.40, 0.50)  -- a POPULATION claim

# Nonresponse sensitivity: bound the unknown 240 at both extremes
nonresp_lower <- n_yes / n_invited             # all 240 said "no"  -> 0.27
nonresp_upper <- (n_yes + n_nonresp) / n_invited  # all 240 said "yes" -> 0.67
c(nonresp_lower, nonresp_upper)                # [0.27, 0.67]  -- dwarfs the CI (Risk 11)
The code computes only what a static page can show; it is not executed here. The comments carry the locked numbers so the page is computationally concrete: \(\hat p = 0.45\), \(\operatorname{SE} \approx 0.026\), CI \((0.40, 0.50)\), and the nonresponse bound \([0.27, 0.67]\).
Worked example — a phone poll with a cell-only coverage gap (transfer)
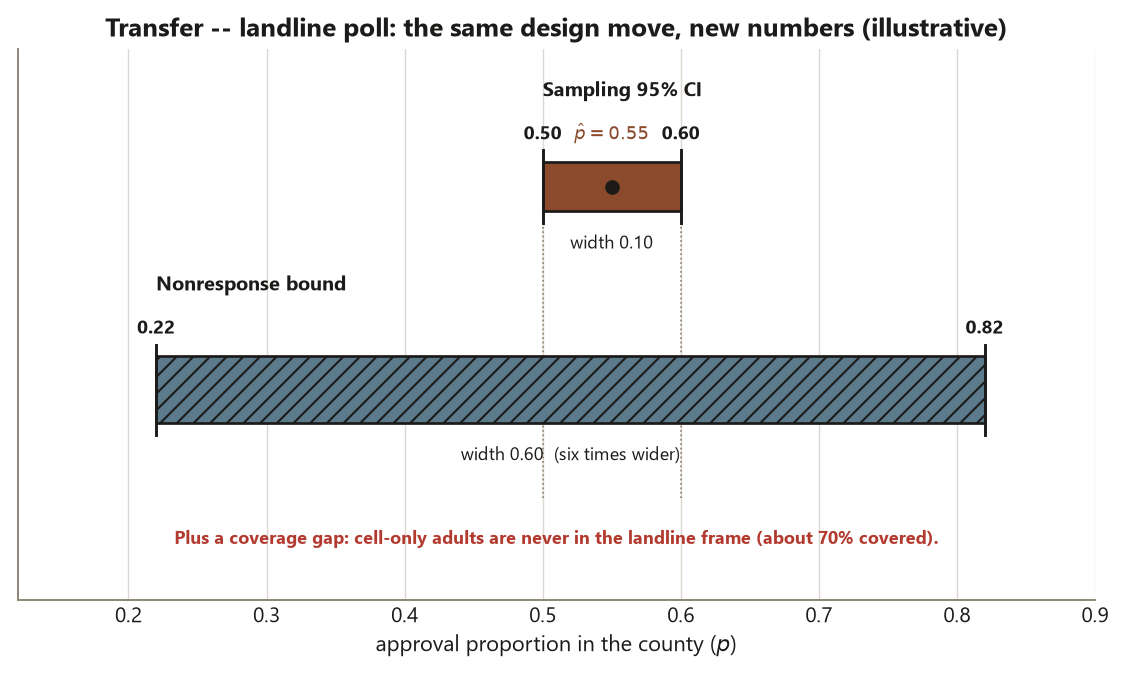
Design. A regional pollster wants the proportion of adults in a county who approve of a new transit plan — the target population is all adults in the county. The pollster’s frame is a list of landline phone numbers, but a large share of adults now live in cell-only households and hold no landline. Those adults are structurally excluded from the frame: a coverage gap, exactly like the 600 email-less students. The numbers below are illustrative and distinct from the campus study.
Suppose the frame reaches roughly \(70\%\) of county adults, the pollster dials an SRS of \(n = 1{,}000\) landline numbers, and \(400\) people answer (\(600\) do not). Of the 400, \(220\) approve, so \(\hat p = 220/400 = 0.55\).
Sampling SE and CI. \[ \operatorname{SE}(\hat p) = \sqrt{\frac{0.55 \times 0.45}{400}} \approx 0.025, \qquad 0.55 \pm 1.96 \times 0.025 \approx (0.50,\ 0.60). \] Interpretation. The unit sampled is the adult; what was sampled is a random 1,000 landline numbers. The interval describes sampling wobble within the landline frame only — it is a population claim restricted to landline-reachable adults.
Coverage and nonresponse, side by side. Two gaps stack here. First, cell-only adults are never in the frame, so if they approve at a different rate (younger, more mobile voters often do), the estimate is biased toward landline holders regardless of \(n\) (Risk 10). Second, the 600 who did not answer the phone could move the bound: hold the 220 known approvals fixed and the respondent-driven range over the 1,000 invited runs from \(220/1000 = 0.22\) (all nonrespondents disapprove) to \((220 + 600)/1000 = 0.82\) (all approve). That \([0.22, 0.82]\) bound, like the campus survey’s, dwarfs the \((0.50, 0.60)\) sampling CI (Risk 11), and the claim cannot honestly reach beyond landline-reachable county adults (Risk 13). Same design lesson, new context: random sampling earns a population claim, bounded by the frame and by who actually responds — never a causal one.
A common mistake
The signature mistake this week is reading the sampling interval as the whole story — treating \((0.40, 0.50)\) as “we know adequate sleep is between 40% and 50%.” It is not. That interval prices only the luck of the draw under SRS; it silently assumes the frame covered the population (it did not — 600 students are excluded) and that everyone answered (they did not — 240 declined). The honest uncertainty about \(p\) is the nonresponse bound \([0.27, 0.67]\), four times wider, and it sits on top of whatever coverage bias the missing 600 introduce.
The cure is a habit, not a formula: name all three groups (population \(12{,}000\), frame \(11{,}400\), sample \(600\)), name the coverage gap (\(600\)), report the sampling CI for what it is, and then bound the nonresponse rather than assume it away as missing-completely-at-random. And keep the claim inside the frame: a campus survey speaks for these undergraduates, not for students everywhere, and never for a cause-and-effect relationship that no assignment was made to test (Risks 1, 10, 11, 13 all live in this one sentence).
Low-stakes self-checks (ungraded)
These are for your own practice — ungraded, no submission.
- In one sentence each, identify the target population, the sampling frame, and the sample for the study-habits survey, and state the size of the coverage gap.
- The survey reports \(\hat p = 0.45\) with CI \((0.40, 0.50)\). A classmate says, “So sleeping more causes better grades in this population.” Name the two things wrong with that sentence (which claim a survey can support, and which it cannot).
- Recompute \(\operatorname{SE}(\hat p)\) if the response had instead been \(\hat p = 0.50\) on the same 360 respondents. Is the interval wider or narrower, and why?
- Suppose 480 of the 600 had responded instead of 360. Does that shrink the sampling SE, the nonresponse bound, both, or neither? Explain which kind of uncertainty a higher response rate actually attacks.
- For the phone-poll transfer example, write the one sentence you would add to a headline so the claim does not overreach the landline frame.
Reading and source pointer
For this week, lean on the instructor notes (primary) for the target/frame/sample vocabulary, the coverage gap, and the nonresponse-bound habit. For the survey-error framing and the SRS standard-error of a proportion, the parallel topic is IMS (Çetinkaya-Rundel & Hardin), the sampling and survey-error material — read it for the concepts and sequence (sampling designs, sources of survey error, coverage and nonresponse), not for worked numbers. These notes are the course’s own synthesis, grounded in but not copied from the sources. The study-habits numbers here are synthetic and seed-set (set.seed(45403)), built for this course, not drawn from any source.
Public vs. graded
These notes, the examples, and the practice here are public and ungraded — study material only. No graded prompts, answer keys, rubrics, point values, or due dates appear on this site. Graded design checkpoints, weekly quizzes, design memos and homework, applied design labs, the midterm, the final design project, and the final exam live in Blackboard (the LMS), which is authoritative for due dates, submissions, and grades. If this page and Blackboard ever disagree, follow Blackboard.
Looking ahead
Next week takes the same study-habits survey and asks how to sample smarter. Stratified sampling splits the frame by class year and can lower the standard error below the SRS value when sleep differs across years (a design effect under 1); cluster sampling, sampling whole dorm floors, is cheaper but inflates the variance, because students who share a floor are correlated (a design effect above 1). Both are still population claims, not causal ones — and week 12 carries a companion lab that builds those sampling designs by simulation. Week 13 then returns to the 240 nonrespondents and names the missing-data mechanism (MCAR / MAR / MNAR) behind this week’s \([0.27, 0.67]\) bound.
See also
- Week 10 — Causal diagrams and backdoor reasoning — the causal-evidence weeks the survey deliberately does not extend.
- Week 12 — Stratified and cluster sampling — sampling smarter on the same survey, with a companion lab.
- Week 13 — Missing data and nonresponse — the MCAR/MAR/MNAR mechanism behind this week’s nonresponse bound.
- Sampling designs by simulation (Lab 12) — the nearest hands-on companion; week 11 itself has no separate lab.
- Design glossary · Design reference · Causal-diagram guide.