Week 4 — Bias, confounding, and validity
Selection and measurement bias, confounding, and internal vs external validity
The week question
When a study reports a difference — users of the tutoring center score \(8.0\) points higher than non-users — what could be standing between that difference and the claim someone wants to make from it? This week names the standing threats. A bias is a systematic distortion baked into how units were selected, measured, or compared; a confounder is a pre-treatment common cause that makes two groups differ for reasons other than the treatment; and validity is the question of whether the design supports the claim here (internal) and whether it travels there (external). The week’s anchor is the tutoring-center observational study, where a naive \(+8.0\) shrinks to an adjusted \(+3.0\) once prior ability is accounted for — the gap is the confounding.
Why this matters
Every later week in this course builds on the ability to look at a reported number and ask what the design will and will not license. An experiment (Study E) earns its causal reading from random assignment; a survey (Study S) earns its population reading from random sampling. The observational tutoring-center study (Study O) has neither random assignment of who uses the center nor a clean route to a causal claim — so the \(+8.0\) is, until proven otherwise, an association. Confusing that association for a causal effect is the most common error this course exists to prevent. Understanding bias, confounding, and validity is what lets you say precisely how much of a reported difference you trust, and for whom.
Learning goals
By the end of this week you should be able to:
- Distinguish selection bias and measurement bias, and say where in a design each one enters.
- Define a confounder as a pre-treatment common cause of treatment and outcome, and explain how it opens a backdoor that inflates or hides an effect.
- Separate a confounder (which you adjust for) from a covariate that needn’t be adjusted, and from a post-treatment variable you must not adjust for.
- Read the tutoring-center study’s naive \(+8.0\) vs adjusted \(+3.0\) as a measurement of confounding, not as two competing effects.
- State whether a claim is about internal validity (causal here) or external validity (generalizes there), and judge whether the design supports the one being made.
- Explain why a small \(p\)-value cannot rescue a confounded comparison.
Core vocabulary
- Selection bias — the units that enter a comparison group are systematically different from those that do not, in a way related to the outcome (here, who chooses to use the center).
- Measurement bias — the instrument or process systematically mis-measures the outcome or exposure for one group relative to another.
- Confounder — a pre-treatment variable that is a common cause of the treatment \(Z\) and the outcome \(Y\); it opens a backdoor path \(Z \leftarrow X \rightarrow Y\) that mixes into the comparison.
- Covariate \(X\) — any pre-treatment variable; a covariate is only a confounder if it also drives the treatment. Not every covariate must be adjusted for.
- Post-treatment variable — anything measured after, and caused by, the treatment (a mediator or a collider); adjusting for it is a bad control and biases the estimate.
- Internal validity — does the design support the causal claim in this study?
- External validity — does the finding generalize to a different population, setting, or time?
- Estimand vs estimate — the causal target you want (e.g. the ATE \(E[Y(1)-Y(0)]\)) vs the one number \(\hat d\) you computed. A biased design means \(\hat d\) is not estimating the estimand you named.
Concept development
Selection and measurement bias — where distortion enters
Bias is not noise. Noise (random error) averages out as the sample grows; bias is systematic and does not shrink with \(n\). The two entry points to watch are who gets compared and how they get measured.
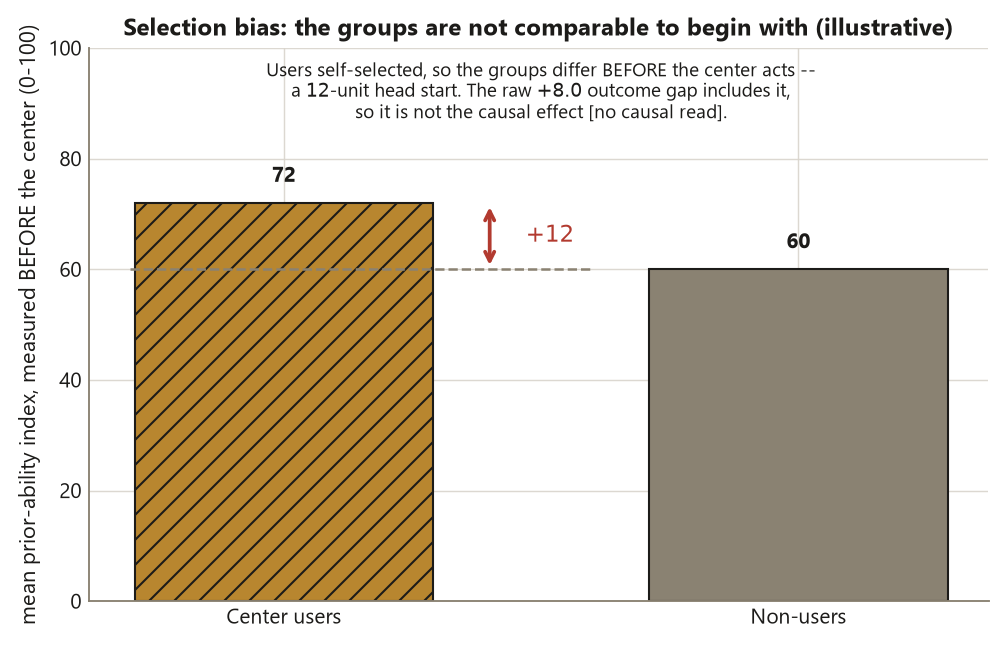
Selection bias enters when group membership is tied to the outcome through the way units were chosen. In the tutoring-center study, nobody assigned students to use the center — students self-selected. If the more motivated, higher-prior-ability students are the ones who walk in, then the user group was selected on a trait that also raises the outcome. The two groups differ before the center ever acts.
Measurement bias enters when the outcome or exposure is recorded differently for the groups. If end-of-term performance were graded more leniently for center users, or if “center use” were self-reported and over-claimed by strong students, the recorded difference would be distorted even if the true difference were zero. Naming the operational definition (Week 2’s job) is the first defense; naming who was compared is this week’s.
Confounding — a pre-treatment common cause
A confounder is the formal name for the selection-bias engine in an observational comparison. It is a variable \(X\) that is (1) pre-treatment — it exists before treatment is decided — and (2) a common cause of both the treatment \(Z\) and the outcome \(Y\). Picture three arrows:
\[ Z \leftarrow X \rightarrow Y, \qquad Z \rightarrow Y . \]
The path \(Z \leftarrow X \rightarrow Y\) is the backdoor: it lets association flow between \(Z\) and \(Y\) without any causal effect of \(Z\) on \(Y\). When you compare users and non-users marginally, you get the causal path plus the backdoor — and you cannot tell them apart by staring at the means. In the tutoring-center study, $X = $ prior ability: it pushes students toward using the center and it raises their end-of-term score. So part of the \(+8.0\) gap is “the center helped” and part is “stronger students were already going to score higher and they are over-represented among users.”
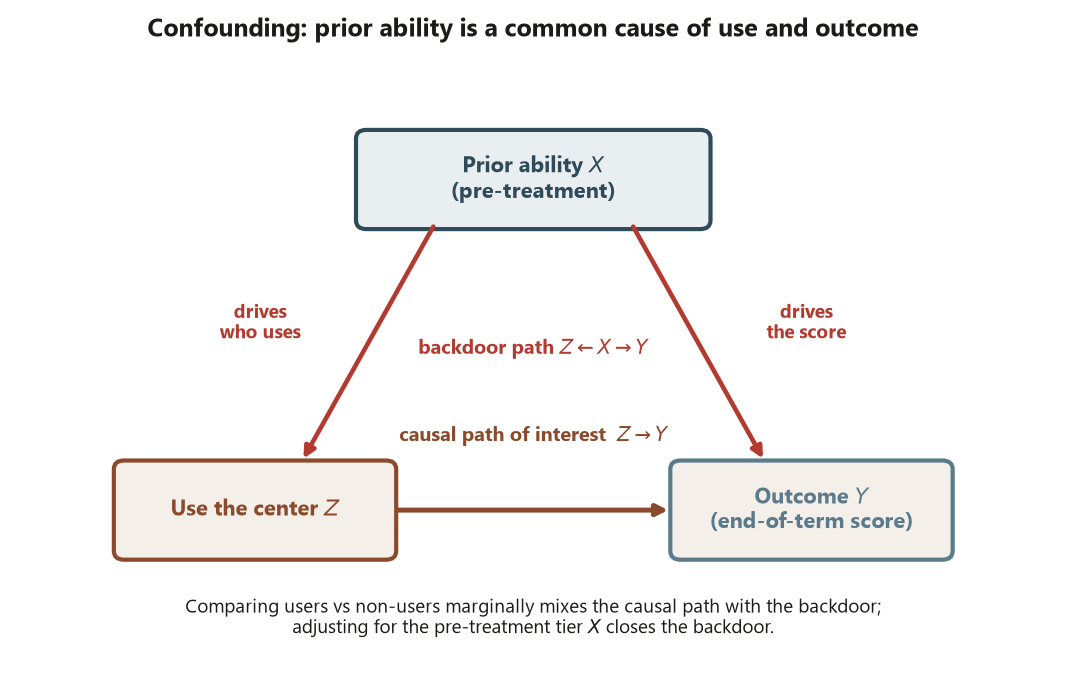
The fix is to close the backdoor by comparing users and non-users within levels of \(X\) — stratify on the prior-ability tier, compute the user-minus-non-user difference inside each tier, and combine. That adjusted comparison holds \(X\) fixed, so only the causal path can move the means. A confounder is therefore something you adjust for; the point of adjustment is to block a real backdoor, not to throw every available variable into a model. A covariate that does not drive the treatment opens no backdoor, and a post-treatment variable must never be adjusted at all (next week’s bad-control story).
Internal vs external validity — two different questions
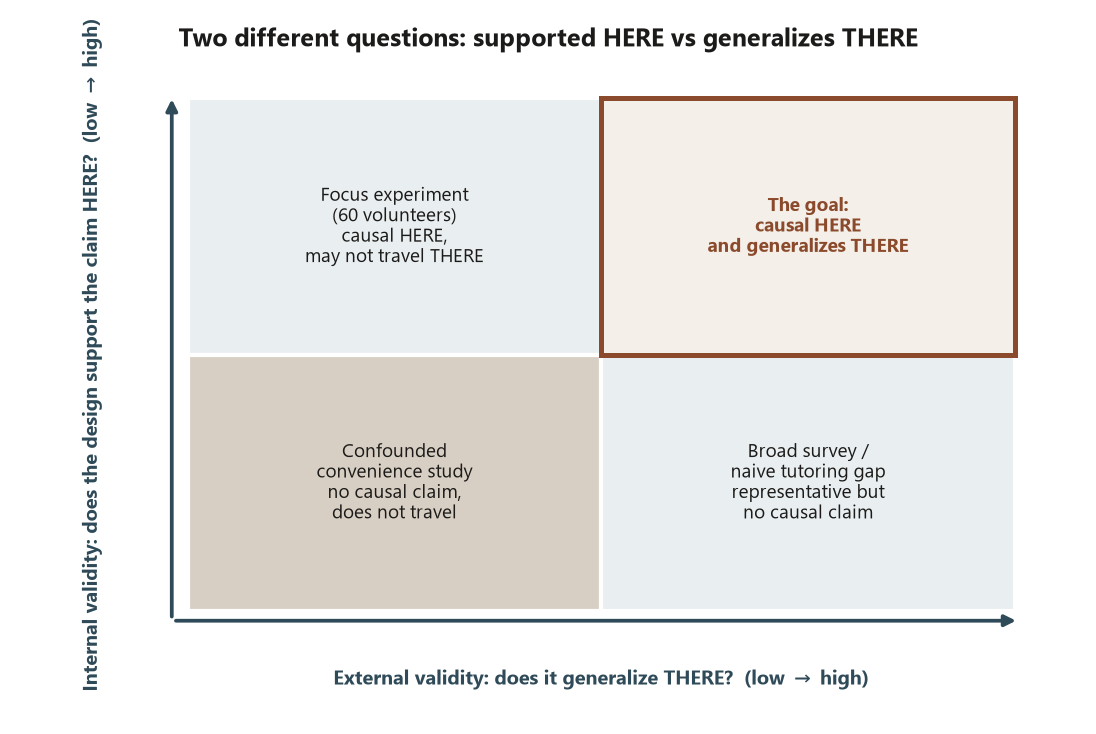
Internal validity asks: in this study, with these units, does the design license the causal claim? A randomized experiment (Study E) has strong internal validity because random assignment makes the treatment and control groups exchangeable on average — there is no confounder, measured or unmeasured, because nothing pre-treatment is associated with the coin flip. The observational tutoring-center study has weaker internal validity: its causal claim rests entirely on having measured and correctly adjusted for every confounder, which is a strong and unverifiable assumption.
External validity asks a separate question: does the finding generalize beyond the studied units? A Focus experiment run on \(60\) volunteers from one course has strong internal validity (random assignment was clean) yet may have limited external validity (those \(60\) may not represent all undergraduates, or another semester, or another campus). The two can dissociate in every combination, which is exactly why they are tracked separately: a perfectly internally valid experiment can still fail to travel, and a broadly representative survey can still support no causal claim at all. Naming which validity a sentence is claiming — and whether the design earns it — is the discipline. A common slip is to take a tight, well-randomized result and quietly generalize it to a population the study never sampled.
Worked examples
Worked example — the tutoring-center study: naive \(+8.0\) vs adjusted \(+3.0\)
The design. Study O is observational: among \(300\) students, \(n = 120\) chose to use the tutoring center and \(n = 180\) did not. The unit of analysis is the individual student; the treatment \(Z\) is center use (self-selected, not assigned); the outcome \(Y\) is the end-of-term performance score. There is no random assignment, so the headline number is an association until a design or assumption earns more.
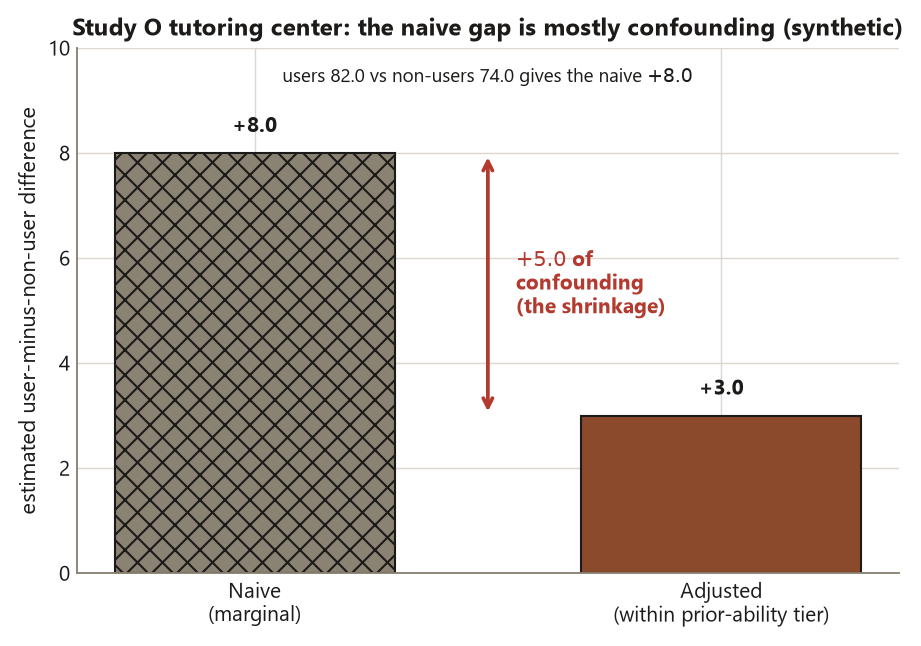
The naive comparison. The user mean is \(82.0\) and the non-user mean is \(74.0\):
\[ \hat d_{\text{naive}} = 82.0 - 74.0 = +8.0 \text{ points.} \]
Read literally, this says nothing causal: users are associated with an \(8\)-point-higher score. Because students self-selected, selection bias is live, and the suspected engine is the pre-treatment confounder $X = $ prior-ability tier, which drives both center use and the score.
The adjusted comparison. Stratify on the prior-ability tier, compute the user-minus-non-user difference within each tier, and combine across tiers. Holding \(X\) fixed closes the backdoor \(Z \leftarrow X \rightarrow Y\), and the difference shrinks:
\[ \hat d_{\text{adjusted}} = +3.0 \text{ points.} \]
The interpretation. The gap between the two numbers is the confounding:
\[ \hat d_{\text{naive}} - \hat d_{\text{adjusted}} = 8.0 - 3.0 = +5.0 \text{ points of confounding.} \]
Prior ability inflated the naive estimate by \(+5.0\). After adjustment, the data are consistent with a \(+3.0\) benefit of using the center — but only if prior-ability tier is the sole confounder and is measured correctly, since adjustment can close only the backdoors you can see. Notice the deliberate parallel to the Focus experiment, whose randomized effect is \(d = 3.0\): careful adjustment approximates what random assignment delivers, when (and only when) the confounder is measured and correct. This is a lesson about design, not a guaranteed identity — the experiment earns the \(3.0\), the observational study only borrows it under assumptions.
Here is the adjustment shown as a small, static computation — not executed in this diagnostic; it draws no randomness, but the seed is set as house convention for any chunk that could:
# Study O — tutoring center, observational (synthetic; seed set; not executed)
set.seed(45403)

# Naive (marginal) comparison: ignores prior ability
mean_user    <- 82.0          # users,     n = 120
mean_nonuser <- 74.0          # non-users, n = 180
d_naive <- mean_user - mean_nonuser
d_naive                       # +8.0  <-- association only; self-selected groups

# Adjusted comparison: difference WITHIN prior-ability tiers, then combined.
# Adjusting for a PRE-TREATMENT confounder (prior ability) closes the backdoor
# PriorAbility -> Use and PriorAbility -> Outcome.
fit <- lm(score ~ center_use + prior_ability_tier)   # coef on center_use ~ +3.0
d_adjusted <- 3.0
d_adjusted                    # +3.0  <-- backdoor closed (if X measured & correct)

confounding <- d_naive - d_adjusted
confounding                   # +5.0  <-- the naive estimate's confounding bias
The design move: nothing was assigned, so the marginal \(+8.0\) is association; the only thing that turns it toward a cause is adjusting for a pre-treatment confounder, and even then the claim is conditional on that confounder being the right one.
Worked example — transfer: “breakfast eaters get better grades”
The claim and the design. A campus-paper headline reports that students who eat breakfast have higher GPAs than those who skip it — a difference of, say, \(+0.30\) GPA points (illustrative, distinct from the locked Study O numbers). The unit is the student; the treatment \(Z\) is eating breakfast; the outcome \(Y\) is GPA. Crucially, nobody randomly assigned breakfast — students chose. So this is observational, and \(+0.30\) is an association.
The confounder. Household resources \(X\) plausibly cause both: families with more stable resources make breakfast routine and support higher grades through tutoring, quiet study space, and fewer work hours. That is a textbook pre-treatment common cause — a confounder opening \(Z \leftarrow X \rightarrow Y\).
# Transfer: breakfast & GPA (illustrative numbers; not the locked Study O values)
set.seed(45403)
gpa_breakfast <- 3.10        # breakfast eaters
gpa_skip      <- 2.80        # breakfast skippers
d_naive_bf <- gpa_breakfast - gpa_skip
d_naive_bf                   # +0.30  <-- association; breakfast self-selected

# Suppose adjusting for household-resource tier shrinks it:
d_adjusted_bf <- 0.10
confounding_bf <- d_naive_bf - d_adjusted_bf
confounding_bf               # +0.20  <-- confounding by household resources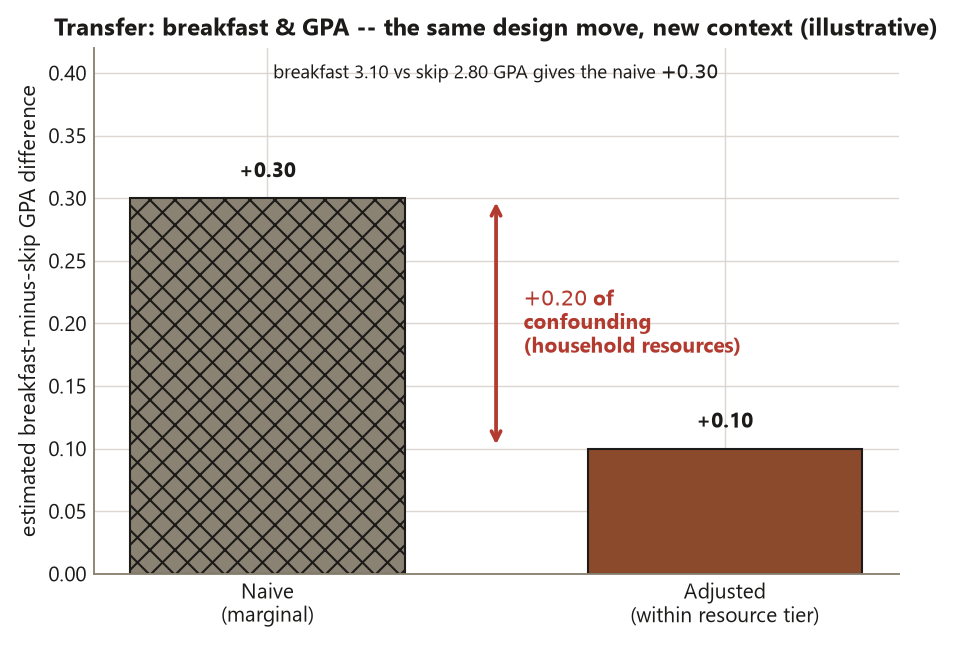
The interpretation. After adjusting for household resources, much of the \(+0.30\) is confounding; the residual \(+0.10\) is what survives, and only if resources were the relevant confounder and were well measured. The design move is identical to Study O: an unassigned exposure plus a pre-treatment common cause means the raw gap mixes a possible effect with a backdoor, and the honest claim is “associated with,” not “causes.” And note the external-validity caveat — even the adjusted \(+0.10\) generalizes only to students like those observed.
A common mistake
The mistake this week guards against has four faces, and a confounded study can show all of them at once:
- Reading association as causation (Risk 2). Writing “using the tutoring center raised scores by \(8\) points” treats a self-selected, unadjusted difference as a causal effect. No random assignment and no closed backdoor means no causal verb — say “associated with.”
- Reading significance as a strong design (Risk 5). Suppose the \(+8.0\) comes with a tiny \(p\)-value. A small \(p\)-value says the difference is unlikely under no association; it says nothing about whether the difference is confounded. A confounded \(+8.0\) that is “highly significant” is a precisely estimated biased number. Significance never rescues design.
- Conflating internal and external validity (Risk 6). Taking the cleanly randomized Focus result and announcing it holds “for all college students” overreaches — strong internal validity does not grant external validity to a population the study never sampled.
- Confusing a confounder with a covariate that needn’t be adjusted (Risk 7). Adjustment is for closing a real backdoor. Throwing in variables that do not drive the treatment buys nothing, and reflexively adjusting for a post-treatment variable (a consequence of using the center, like term study-hours) is a bad control that introduces bias — the topic of Week 10.
The throughline: a reported difference is only as trustworthy as the design that produced it, and adjustment helps only for measured, pre-treatment confounders.
Low-stakes self-checks (ungraded)
These are for your own practice — ungraded, no submission.
- In one sentence each, give an example of selection bias and measurement bias for the tutoring-center study, and say where in the design each one enters.
- Prior ability is a confounder for center use → score. Is “hours studied during the term” a confounder you should adjust for? Why or why not? (Hint: when does it occur relative to the treatment?)
- The naive difference is \(+8.0\) and the adjusted is \(+3.0\). State the \(+5.0\) in words, and the one assumption under which the adjusted number is the causal effect.
- A clean randomized Focus experiment gives \(d = 3.0\) on \(60\) volunteers. Which validity is strong, which is in question, and what claim would overreach?
- Someone says “the \(p\)-value was \(0.001\), so the center clearly works.” Name the risk and rewrite the conclusion honestly.
Reading and source pointer
This week is grounded in the instructor notes (primary) and in IMS (Çetinkaya-Rundel & Hardin) on confounding and the validity of study designs — the concepts and sequence for distinguishing association from causation, identifying confounders, and separating internal from external validity. These notes are the course’s own synthesis, grounded in but not copied from the sources. No source prose, examples, exercises, figures, or solutions are reproduced. For symbol conventions, see the design glossary; for the confounder / backdoor picture you will formalize in Week 10, see the causal-diagram guide.
Public vs. graded
These notes, the examples, and the practice here are public and ungraded — study material only. No graded prompts, answer keys, rubrics, point values, or due dates appear on this site. Graded design checkpoints, weekly quizzes, design memos and homework, applied design labs, the midterm, the final design project, and the final exam live in Blackboard (the LMS), which is authoritative for due dates, submissions, and grades. If this page and Blackboard ever disagree, follow Blackboard.
Looking ahead
Next week we move from threats to a claim to the design that defeats most of them: the completely randomized experiment (Study E). You will see how random assignment makes treatment and control groups exchangeable — dissolving the confounding that haunted the tutoring-center study — and how the randomization itself, not just a \(t\)-test, licenses the causal reading of \(d = 3.0\).
See also
- Week 3 — Random sampling vs random assignment — the signature distinction this week’s threats sit on top of.
- Week 5 — Completely randomized experiments — the design that removes confounding by construction.
- Design glossary — confounder, covariate, internal/external validity, bias.
- Design reference — the design families side by side.
- Causal-diagram guide — backdoor paths, adjustment sets, bad controls.