Week 5 — Completely randomized experiments
Why random assignment licenses a causal claim, and how to read the comparison
The week question
When you randomly assign units to a treatment group and a control group, run them through the study, and find that the treatment group’s average outcome is higher, what exactly have you earned the right to say? This week’s question is narrow and load-bearing: why does random assignment — and not the p-value — license a causal claim, and how do you read the comparison the design produces? A completely randomized design (CRD) is the simplest experiment that answers it, so it is where the causal-evidence half of the course begins.
Why this matters
Up to now the course has warned you that an observed difference between two groups can come from the treatment or from the groups having been different to begin with — a confounder. The completely randomized design is the first design that structurally rules out that alternative. Random assignment makes the two groups exchangeable in expectation: every pre-treatment characteristic, measured or not, is balanced on average across the treatment and control arms. That balance is what converts “the groups differ on the outcome” into “the treatment caused the difference.”
This is the course’s signature distinction made concrete. Random sampling would earn you a claim about a population; random assignment earns you a claim about cause. They are different mechanisms answering different questions, and an experiment can have one, both, or neither. The CRD is where you watch assignment do its specific job, and where you learn to resist the most common error in reading an experiment: treating a small p-value as proof that the design was good. The design is what supports the claim; the p-value only describes how surprising the result would be under the no-effect null.
Learning goals
By the end of this week you should be able to:
- State what a completely randomized design is — treatment and control groups formed by random assignment — and name the unit that was assigned.
- Compute the observed effect as a difference in means \(d = \bar y_T - \bar y_C\) and explain why, under random assignment, it estimates a causal contrast rather than a mere association.
- Compute the standard error of a difference \(\operatorname{SE}(d)\) and read a \(t\)-ratio and a \(p\)-value as descriptions of variability, not as verdicts on the design.
- Describe the randomization reference distribution — shuffle the treatment labels under the null of no effect, recompute \(d\), repeat — and read the randomization \(p\)-value as a tail probability.
- Explain why the causal reading rests on the random assignment, and articulate what the experiment can and cannot support.
Core vocabulary
- Completely randomized design (CRD) — an experiment in which units are assigned to treatment or control purely at random, with no blocking or pairing structure imposed.
- Treatment (\(Z\)) and control — the conditions being compared; \(Z = 1\) for treated units, \(Z = 0\) for control units.
- Outcome (\(Y\)) — the response measured after the treatment; here a problem-solving gain score in points.
- Difference in means (\(d\)) — the observed effect, \(d = \bar y_T - \bar y_C\); one realized estimate of the causal estimand (the average treatment effect \(\text{ATE} = E[Y(1) - Y(0)]\)).
- Standard error of a difference (\(\operatorname{SE}(d)\)) — how much \(d\) would vary from one random assignment to another: \(\operatorname{SE}(d) = s_p\sqrt{1/n_T + 1/n_C}\).
- Randomization (permutation) reference distribution — the distribution of \(d\) you would see by re-shuffling the treatment labels under the null that the labels are irrelevant.
- Randomization \(p\)-value — the fraction of shuffled \(d\) values at least as extreme as the observed \(d\); a tail probability, not a measure of design quality.
- Exchangeability — the property, created by random assignment, that the treatment and control groups have the same distribution of pre-treatment characteristics in expectation.
Concept development
The design: what was assigned, and what that buys you
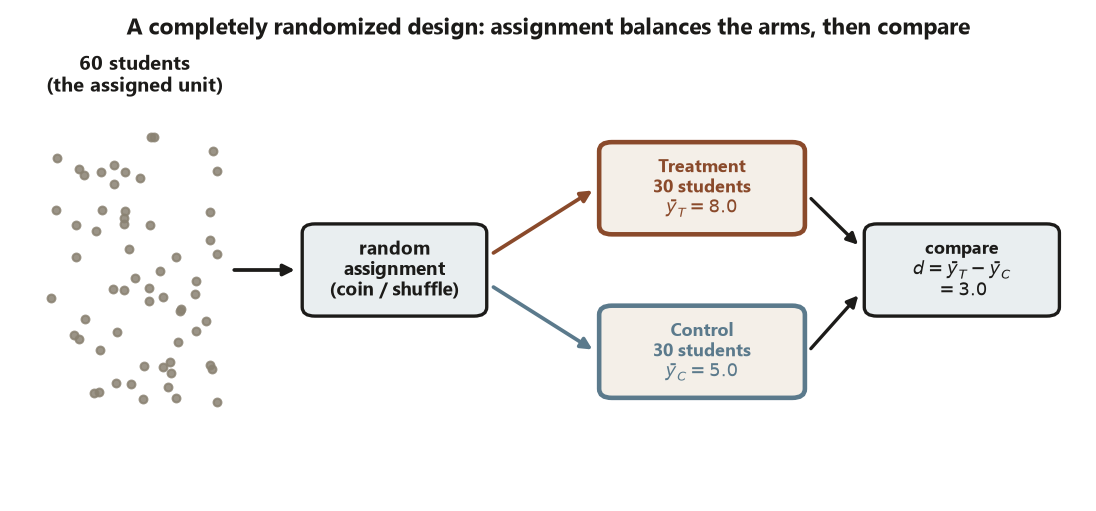
In a completely randomized design you take your \(n\) units, decide on the arm sizes, and let a random mechanism — a coin, a shuffle, sample() — decide which unit goes to treatment and which to control. Nothing about a unit’s prior performance, motivation, or schedule is allowed to influence the assignment. That is the whole design, and its plainness is the point: with no blocking and no pairing, random assignment alone is doing the work of making the two groups comparable.
The unit of analysis is the entity that was assigned, and you must analyze at that grain (Risk 3). In the recurring Focus experiment the unit is the individual student: 60 students were each assigned, one at a time, to the workshop or to control. So the outcome is compared student-by-student, and the \(n\) in every formula below is a count of students, not of classrooms or sessions. If you had instead assigned whole classrooms to a condition, the unit would be the classroom, and analyzing 600 individual students as if they were independently assigned would overstate your information badly. Name the assigned unit first; the arithmetic follows from it.
What random assignment buys you is exchangeability. Because the coin does not know or care about prior ability, the treatment and control groups end up balanced — on average — on every pre-treatment variable at once, including ones you never measured. That average balance is exactly the condition that lets the difference in means be read as a causal effect rather than as a mixture of treatment and confounding.
The effect and its standard error
The observed effect is the difference in group means,
\[ d = \bar y_T - \bar y_C . \]
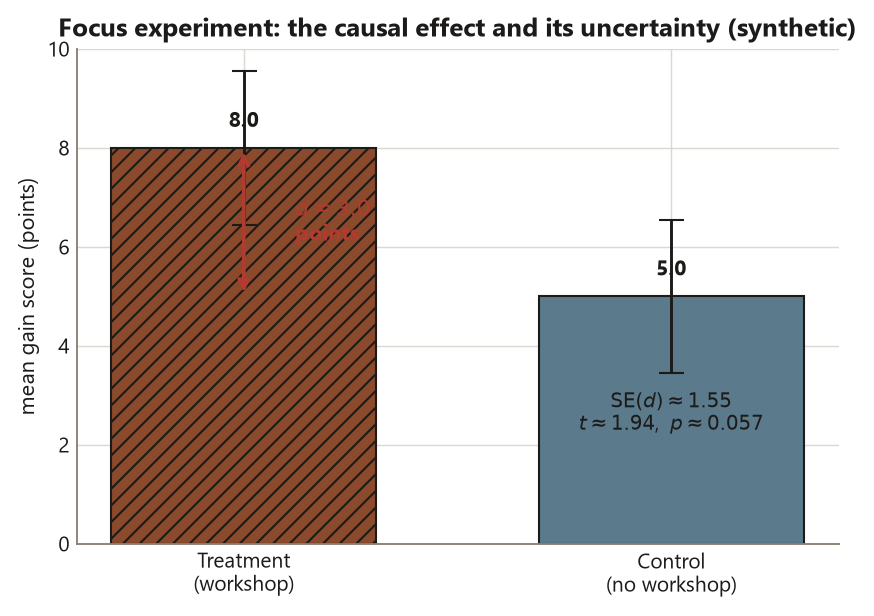
For the Focus experiment, \(\bar y_T = 8.0\) and \(\bar y_C = 5.0\), so \(d = 8.0 - 5.0 = 3.0\) points. Under random assignment this \(3.0\) is an estimate of the estimand — the average treatment effect — not merely an association: the design has already ruled out the pre-treatment confounding that would otherwise muddy that reading.
A single \(d\) is one draw, though. A different random assignment of the same 60 students would have produced a slightly different \(d\) even if the workshop did nothing, because the two groups would contain different people. The standard error measures that assignment-to-assignment variability:
\[ \operatorname{SE}(d) = s_p\sqrt{\frac{1}{n_T} + \frac{1}{n_C}} . \]
With a pooled standard deviation \(s_p \approx 6.0\) and \(n_T = n_C = 30\),
\[ \operatorname{SE}(d) = 6.0\sqrt{\frac{1}{30} + \frac{1}{30}} = 6.0\sqrt{\tfrac{2}{30}} \approx 1.55 . \]
So an effect of \(3.0\) points carries a standard error of about \(1.55\) points. The \(t\)-ratio compares the two: \(t = d / \operatorname{SE}(d) = 3.0 / 1.55 \approx 1.94\), with a two-sided \(p \approx 0.057\). This is a deliberately borderline result — just outside the conventional \(0.05\) line. The interpretation is not “the workshop almost worked.” It is “an effect this size or larger would happen about \(6\%\) of the time if the workshop truly did nothing.” The design earned the causal framing; the p-value only sets the surprise level.
The randomization reference distribution
The \(t\)-based p-value above leans on a theoretical sampling-distribution approximation. A completely randomized design lets you build the reference distribution directly from the assignment mechanism itself, with no distributional assumption — which is conceptually cleaner because it uses the very randomness the design introduced.
The idea: under the null hypothesis of no effect, a student’s outcome would have been the same whichever arm they landed in, so the treatment labels are arbitrary tags. To see how big a \(d\) that arbitrariness alone can produce, you shuffle the 60 labels — randomly relabel 30 students “treatment” and 30 “control” while keeping their outcomes fixed — recompute \(d\), and repeat thousands of times. The resulting spread of shuffled \(d\) values is the randomization reference distribution: the set of effects the design could manufacture when the treatment does nothing.
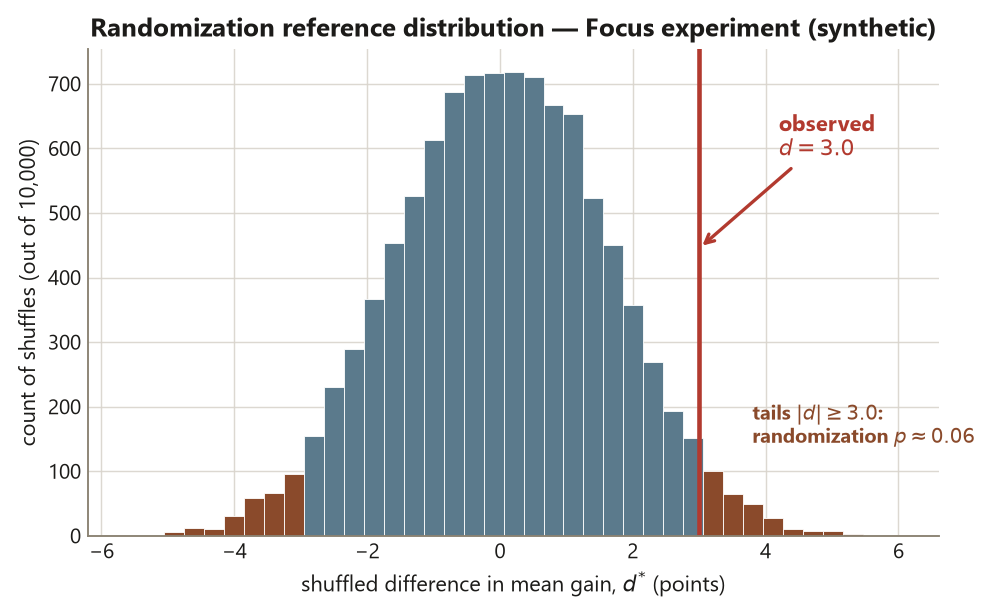
You then place the observed \(d = 3.0\) against that distribution. The randomization \(p\)-value is the fraction of shuffles that produced a \(d\) at least as extreme as \(3.0\). For the Focus experiment that fraction is \(p \approx 0.06\) — essentially the same as the theoretical \(0.057\). That agreement is reassuring (randomization \(\approx\) theory here), but the deeper lesson is what the p-value is: a tail of a distribution generated by the assignment, not a certificate that the design was sound. A confounded study with no random assignment can still produce a tiny p-value; the small number would be describing noise inside a broken design (Risk 5).
Worked examples
Worked example — the Focus study-skills experiment (recurring slice)
Design. \(n = 60\) students were each randomly assigned, individually, to a study-skills (“Focus”) workshop (\(n_T = 30\)) or to a no-workshop control (\(n_C = 30\)) — a completely randomized design. The unit of analysis is the student; the outcome \(Y\) is a timed problem-solving gain score in points. Data are synthetic; seed set.
Computation. The static R below shows the group means, the difference \(d\), its standard error, and the randomization reference distribution. It is shown as teaching code and is not executed here.
set.seed(45403)

# Synthetic Focus experiment: 60 students, completely randomized 30/30.
# (Group outcomes summarized to their locked means/SD for this static slice.)
y_T <- rnorm(30, mean = 8.0, sd = 6.0)   # treatment arm gain scores
y_C <- rnorm(30, mean = 5.0, sd = 6.0)   # control arm gain scores

d  <- mean(y_T) - mean(y_C)              # observed effect  -> d = 3.0 points
sp <- 6.0                                # pooled SD (locked)
se <- sp * sqrt(1/30 + 1/30)             # SE(d) = 6.0 * sqrt(2/30) ~= 1.55
t  <- d / se                             # t = 3.0 / 1.55         ~= 1.94
# two-sided theoretical p ~= 0.057  (borderline)

# Randomization reference distribution: shuffle the 60 labels under the null.
y    <- c(y_T, y_C)
perm <- replicate(10000, {
  lab <- sample(rep(c("T", "C"), each = 30))   # random relabel, outcomes fixed
  mean(y[lab == "T"]) - mean(y[lab == "C"])
})
rand_p <- mean(abs(perm) >= abs(d))      # fraction as extreme as d -> ~0.06

# d = 3.0   SE(d) = 1.55   t = 1.94   theory p = 0.057   randomization p = 0.06
Interpretation. What was assigned is the workshop, to individual students, at random — so the observed \(d = 3.0\) points estimates the causal effect of the workshop, not just an association. The standard error \(1.55\) says that \(3.0\) is uncertain at roughly half its own size, and the borderline \(p \approx 0.057\) (matched by the randomization \(p \approx 0.06\)) says a difference this large would arise about \(6\%\) of the time if the workshop did nothing. The claim the design supports is: for students like these, randomly assigned, the workshop plausibly raised gain scores by about \(3\) points, though the evidence is borderline. The claim it does not support is “the workshop definitely works” (the result is borderline) or “this holds for all students everywhere” (that is an external- validity question random assignment does not answer). Crucially, the causal reading comes from the random assignment; the p-value is just the tail of the randomization distribution.
Worked example — a reminder-text trial (transfer, new context)
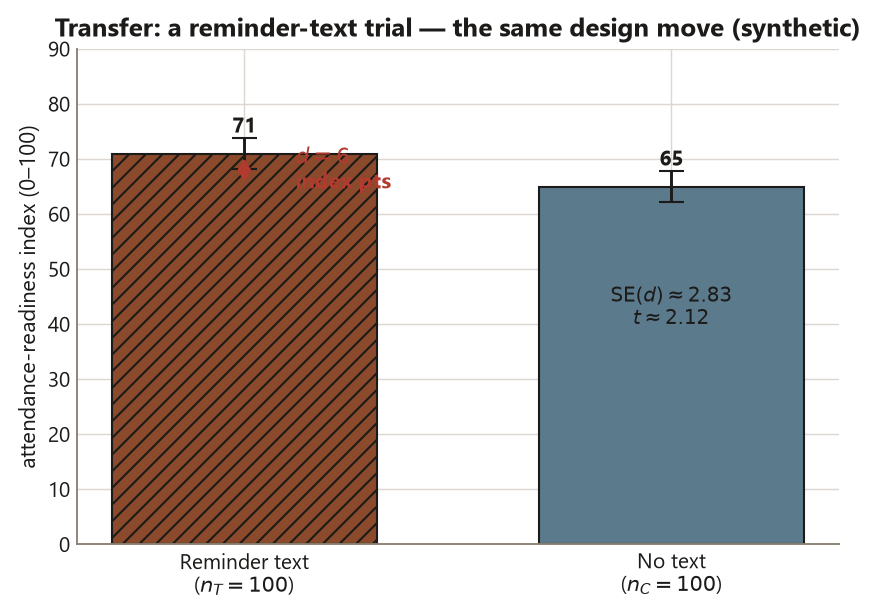
Design. A clinic wants to know whether a same-day reminder text raises the rate at which patients keep their appointments. It enrolls \(200\) patients and, by a random draw, assigns \(100\) to receive the text and \(100\) to a no-text control — a completely randomized design with the patient as the unit of analysis. The outcome is the attendance gain measured on a \(0\)–\(100\) readiness-to-attend index. These numbers are illustrative and distinct from the Focus study.
Computation. Suppose the texted group averages \(\bar y_T = 71\) and the control group \(\bar y_C = 65\), with a pooled standard deviation \(s_p \approx 20\) and \(n_T = n_C = 100\). Then
\[ d = 71 - 65 = 6 , \qquad \operatorname{SE}(d) = 20\sqrt{\tfrac{1}{100} + \tfrac{1}{100}} = 20\sqrt{\tfrac{2}{100}} \approx 2.83 , \]
\[ t = \frac{d}{\operatorname{SE}(d)} = \frac{6}{2.83} \approx 2.12 . \]
A randomization test would shuffle the \(200\) text/no-text labels under the null of no effect, recompute \(d\) each time, and report the fraction of shuffles with \(|d| \ge 6\).
Interpretation. Because the reminder was assigned at random to individual patients, the \(d = 6\) index points reads as the causal effect of the reminder for patients like these — random assignment, not the texting itself being “obviously helpful,” is what licenses that. The larger arm sizes make \(\operatorname{SE}(d) \approx 2.83\) tighter relative to the effect than in the Focus study, so \(t\) is a bit larger. Note what changed and what did not: the design move is identical — randomly assign, compare means, build a reference distribution — only the context and the numbers differ. And as before, a small p-value here would describe surprise under the null, not certify that the trial was well run.
A common mistake
The week’s central trap is reading statistical significance as evidence of a strong design (Risk 5), usually braided together with confusing random assignment with random sampling (Risk 1) and analyzing at the wrong unit (Risk 3).
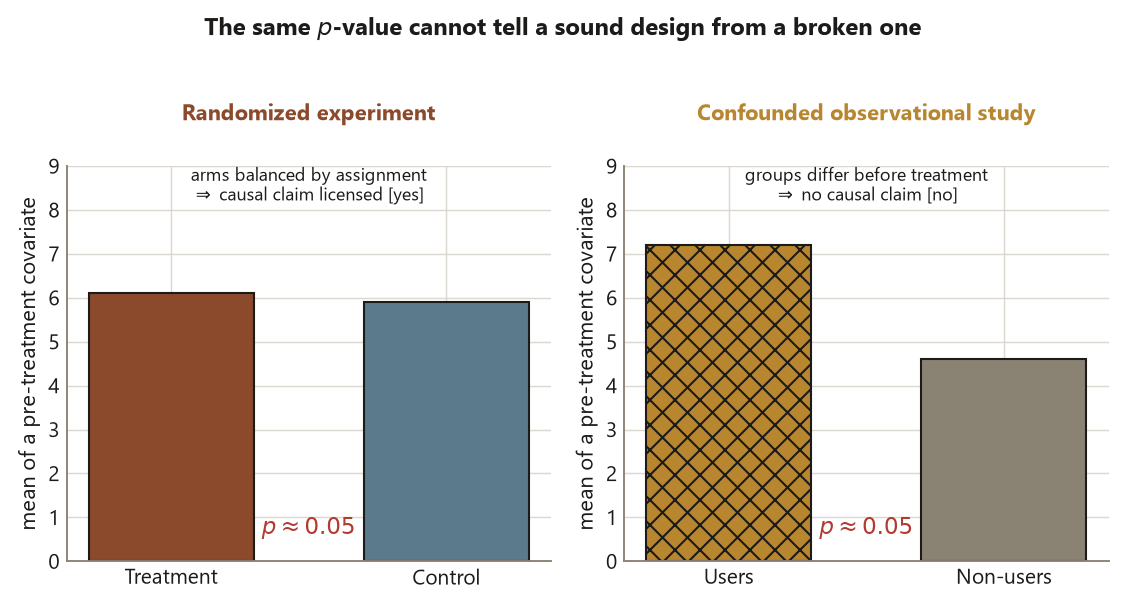
The significance trap sounds like: “\(p = 0.057\), so the design is almost good enough,” or worse, “\(p < 0.05\), so the study is sound.” Neither follows. The p-value is a tail probability of the randomization reference distribution — it tells you how unusual the observed \(d\) would be if the treatment did nothing. It says nothing about whether the units were assigned at random, whether the right unit was analyzed, or whether the outcome was measured well. A badly confounded observational study can hand you \(p = 0.001\); the tiny number is then a precise description of noise inside a design that cannot support a causal claim at all. What licenses the causal reading is the random assignment, full stop; the p-value only calibrates surprise given a sound design.
The sampling-versus-assignment confusion sounds like: “the workshop helped these \(60\) students, so it helps undergraduates generally.” The \(60\) were assigned at random (earning a causal claim) but were not sampled at random from any population (so no population claim is earned). The experiment supports “the workshop caused a gain for units like these”; it does not, by itself, support “this generalizes to all students” — that is external validity, a separate question. And the unit trap sounds like assigning sessions or classrooms but then computing \(\operatorname{SE}(d)\) as if hundreds of individuals had been independently assigned; the standard error must use the count of assigned units, or it will badly understate the uncertainty.
Low-stakes self-checks (ungraded)
These are for your own practice — ungraded, no submission.
- In one sentence each, say what was assigned and what (if anything) was sampled in the Focus experiment, and name the claim each mechanism does or does not license.
- Recompute \(\operatorname{SE}(d)\) for the Focus study if each arm had \(n = 15\) instead of \(30\) (same \(s_p = 6.0\)). Does the standard error get larger or smaller, and why does that make sense?
- A classmate says “the randomization \(p \approx 0.06\) proves the workshop has no real effect.” Identify two things wrong with that statement.
- Explain, in your own words, what shuffling the treatment labels is simulating, and what the resulting reference distribution represents.
- Suppose the trial had assigned whole dorm floors to text or no-text but reported a standard error computed from the number of individual patients. Name the design error and say which direction it pushes the reported uncertainty.
Reading and source pointer
This week is grounded in the instructor notes (the primary course materials) for the completely randomized design and the causal reading, with the IMS (Çetinkaya-Rundel & Hardin) chapter on experiments and randomized comparison for the design vocabulary and sequence, and the ModernDive (Ismay, Kim & Valdivia) treatment of the randomization / permutation workflow for the reference distribution you will build in the companion lab. These notes are the course’s own synthesis, grounded in but not copied from the sources. No prose, examples, exercises, figures, or solutions are reproduced from any source.
Public vs. graded
These notes, the examples, and the practice here are public and ungraded — study material only. No graded prompts, answer keys, rubrics, point values, or due dates appear on this site. Graded design checkpoints, weekly quizzes, design memos and homework, applied design labs, the midterm, the final design project, and the final exam live in Blackboard (the LMS), which is authoritative for due dates, submissions, and grades. If this page and Blackboard ever disagree, follow Blackboard.
Looking ahead
Next week we keep the same Focus experiment and the same effect \(d = 3.0\), but we change the design to buy precision. Blocking by a pre-treatment prior-performance tier and pairing matched students both remove a source of nuisance variation, shrinking \(\operatorname{SE}(d)\) from about \(1.55\) toward \(1.03\) (blocked) and \(0.91\) (paired) — the same effect, estimated more sharply. The lesson previews itself: a better design tightens the estimate without inventing a bigger effect.
See also
- Week 4 — Bias, confounding, and validity — the threat the CRD is built to rule out.
- Week 6 — Blocking and paired designs — same effect, sharper estimate.
- Lab 5 — Randomization and the reference distribution — simulate random assignment and read the randomization p-value.
- Design glossary — CRD, difference in means, standard error, randomization distribution.
- Design reference — the design families side by side.
- Causal-diagram guide — how assignment closes backdoor paths.