Week 2 — Measurement, variables, and operational definitions
Turning ideas into observable data without pretending measurement is automatic
The week question
Last week you named the question, the unit of analysis, and the population or process for each of the three campus studies. This week the question is narrower and easier to skip: how does an idea become a number or a category in a data table? A “study skill,” a night’s “sleep,” a “performance” — none of these arrives pre-measured. Someone has to decide what to record, on what scale, with what instrument, and that decision is a design choice that quietly governs every claim you make later. The week question is: what is the construct, what is the measure you actually use, and how big is the gap between them?
This is not a side detail before the “real” design work. A randomized assignment that earns a causal claim, or a random sample that earns a population claim, is still only as good as the thing being measured. Bad measurement is a leak that no downstream design can patch.
Why this matters
The course’s spine is that the design that produced the data decides what the data can support. Measurement sits one layer beneath that spine. If your outcome measure is biased, even a flawless experiment estimates the biased quantity precisely; if it is noisy, even a large sample buys you less precision than the sample size suggests. The design move you make this week is operationalization — writing down the exact, repeatable procedure that turns a construct into recorded data — and then naming the error in that procedure honestly.
Two distinctions carry the week. First, construct vs operational definition: the idea you care about (the construct) is never identical to the recorded measure (its operationalization), and pretending otherwise is the trap. Second, bias vs noise: a measure can be systematically off (bias, which no sample size removes) or randomly scattered (noise, which averaging can reduce). Keeping those apart — and keeping reliability (does the measure repeat?) apart from validity (does it measure the right construct?) — is what separates a defensible study from one that merely looks quantitative.
Learning goals
By the end of this week you should be able to:
- State the difference between a construct and its operational definition, and write a clean operational definition for a given construct (the exact procedure, scale, and unit).
- Classify a variable as categorical (nominal/ordinal) or numeric (discrete/continuous), and as explanatory or response, and explain why the role depends on the design, not the variable.
- Distinguish measurement bias (systematic error) from measurement noise (random error), and say what each does to an estimate and what, if anything, reduces it.
- Distinguish reliability (consistency on repetition) from validity (measuring the intended construct), and recognize that a measure can be reliable without being valid.
- Name the construct → measure → gap for an outcome and a self-report item, and explain why ignoring that gap (Risk 9) quietly undermines an otherwise sound design.
Core vocabulary
- Construct — the abstract idea a study is about (study skill, adequate sleep, food insecurity). Not directly observable; it must be operationalized.
- Operational definition — the exact, repeatable procedure that produces the recorded value: the instrument, the scale, the unit, the timing. “Adequate sleep = self-reported \(\ge 7\) hours on a typical recent night” is an operational definition; “well-rested” is not.
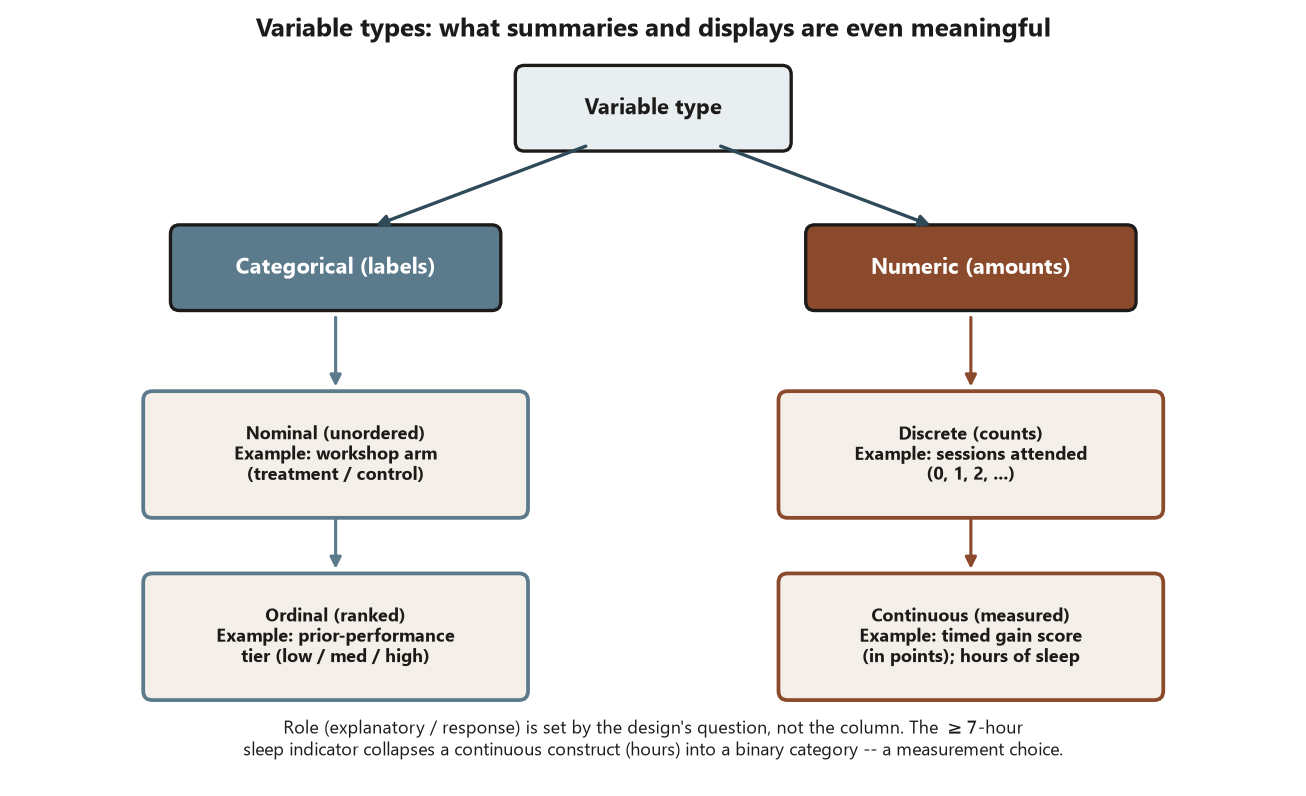
- Variable — a recorded characteristic that varies across units. Categorical (values are labels: nominal if unordered, ordinal if ranked) vs numeric (counts or measured amounts; discrete vs continuous). The explanatory vs response role is assigned by the design’s question, not by the variable itself.
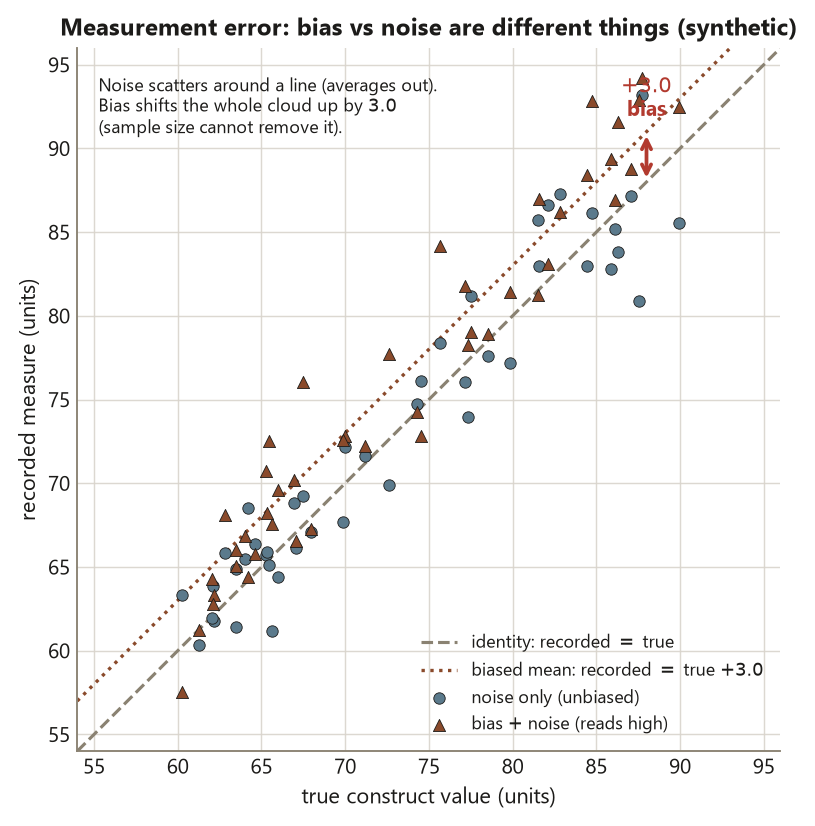
- Measurement error — the difference between the recorded value and the true construct value for a unit. Splits into bias (a systematic, repeatable offset — the average of repeats is off) and noise (random scatter — the average of repeats is on target but any single reading is off).
- Reliability — does the measure give the same value on repetition (same instrument, same unit, short interval)? A reliability question only about consistency.
- Validity (of a measure) — does the measure capture the intended construct? Distinct from the study-level internal/external validity you will meet in Week 4. A bathroom scale that always reads three pounds high is reliable but, for “true weight,” biased and so not fully valid.
Concept development
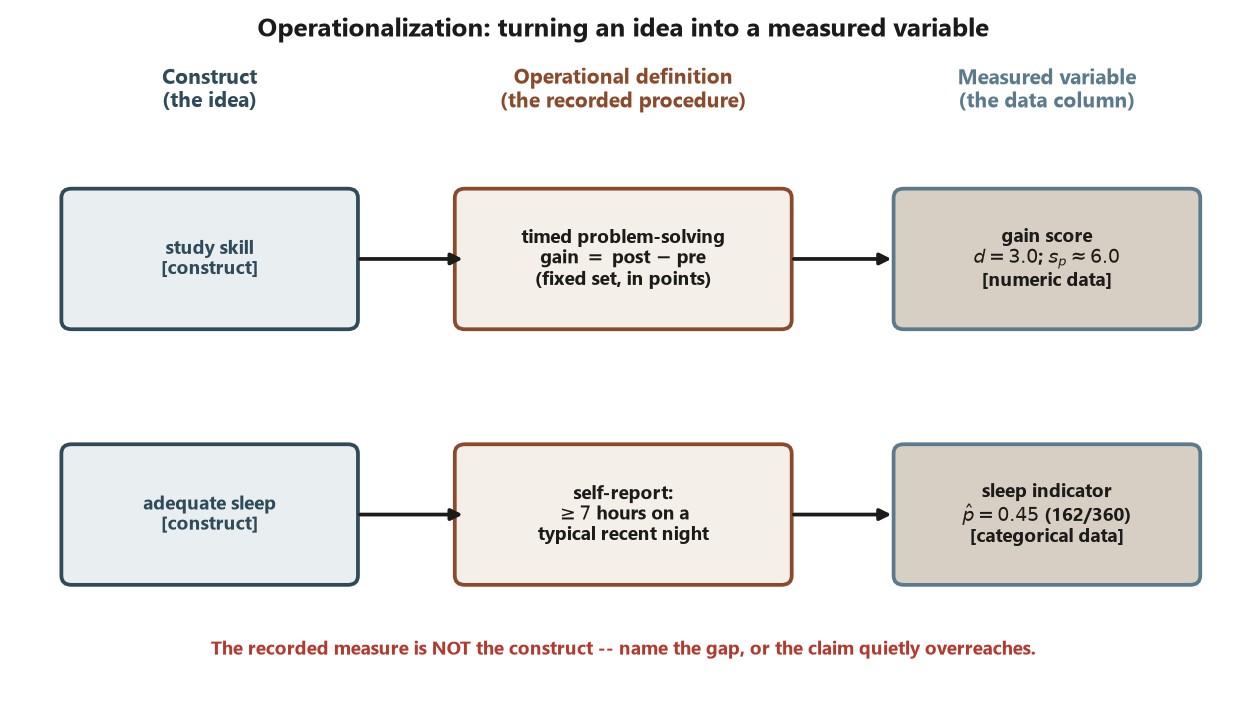
Construct vs operational definition — the measure is not the construct
A construct lives in your research question; an operational definition lives in your data-collection procedure. The whole act of measurement is committing to a procedure and accepting that it stands in for — but is not identical to — the construct. Three honest sentences make a defensible measurement plan: here is the construct; here is the exact procedure I will record; here is the gap I expect between them. Write all three or you have not really operationalized anything.
The gap is unavoidable and that is fine — what is not fine is leaving it unnamed. When you later report an effect on “study skill,” you have in fact reported an effect on the timed gain score you chose to record. The claim is licensed only as far as the measure tracks the construct. Naming the construct, the measure, and the gap is the entire design move of Week 2, and skipping it is Risk 9.
Variable types and roles — set by the design, not the column
Before you can record a value you must decide its type, because type controls what summaries and displays are even meaningful. A categorical variable (workshop arm: treatment / control) takes labels; an ordinal one (prior-performance tier: low / medium / high) has order but no fixed spacing; a numeric one (a gain score in points) supports means and differences. Recording a numeric construct as a coarse category, or treating an ordinal label as if its spacing were equal, are measurement decisions with downstream consequences.
The explanatory vs response role is not a property of the variable — it is assigned by the design’s question. In the Focus experiment the workshop arm is explanatory and the gain score is the response; in a different study the same gain score could be an explanatory covariate. State the role the design gives each variable, and analyze at the design’s grain (the Week 1 unit-of-analysis discipline still binds).
Measurement error — bias vs noise, and reliability vs validity
Every recorded value is the true construct value plus error, and the error has two ingredients that behave completely differently:
\[ \text{recorded} = \text{true construct value} + \underbrace{\text{bias}}_{\text{systematic}} + \underbrace{\text{noise}}_{\text{random}} . \]
Noise is random scatter: it averages out, so a larger sample or repeated measurement shrinks its effect on an estimate, at the cost of precision you must account for. Bias is a systematic offset in one direction: it does not average out, so no sample size removes it — a self-report item where respondents overstate sleep by half an hour is off by half an hour whether you ask 30 people or 30,000. That asymmetry is the practical heart of the week: sample size fights noise, never bias.
Reliability and validity answer different questions about a measure. Reliability asks: if I measure the same unit again, do I get the same value? Validity asks: am I measuring the construct I claimed? They are independent — a scale that always reads three pounds high is perfectly reliable (consistent) yet biased and so not valid for true weight. A measure must be reliable to be useful, but reliability alone never guarantees you are measuring the right thing. When you critique a study, ask both questions separately.
Worked examples
Worked example — operationalizing the Focus experiment outcome and the sleep item (recurring slice)
These are the recurring synthetic studies from the course world; all numbers are synthetic, seed set (set.seed(45403)).
Study E — the gain-score outcome. The Focus study-skills experiment randomizes \(n = 60\) students, 30 treatment / 30 control, and reports a timed problem-solving gain score in points. The construct is “improvement in study skill.” The operational definition is the recorded measure: (post-test score) − (pre-test score) on a fixed, timed problem set, in points. The locked numbers are treatment mean gain \(\bar y_T = 8.0\), control mean gain \(\bar y_C = 5.0\), observed effect \(d = 8.0 - 5.0 = 3.0\) points, with pooled SD \(s_p \approx 6.0\).
Now name the gap. The gain score is not “study skill” — it is performance on one timed instrument, so it carries noise (a student’s timed score wobbles day to day, fatigue, a lucky problem) and possibly bias (if the post-test is systematically easier than the pre-test, every gain is inflated by a fixed amount). The noise is exactly what \(s_p \approx 6.0\) summarizes and what the design fights with sample size; the bias is what random assignment does not fix — both arms would carry the same inflated gain, so a constant test-difficulty bias cancels in the difference \(d\), but a bias that acts differently by arm (say, treatment students take the post-test more rested) would contaminate \(d\) itself.
Design reading: random assignment licenses reading \(d = 3.0\) as a causal effect of the workshop on the gain score. It earns a causal claim about the measure, not automatically about the construct — that last step rests on the gain score being a valid operationalization of study skill. Name the measure, or the causal claim quietly overreaches (Risk 9).
Study S — the sleep item. The campus study-habits survey estimates the proportion of undergraduates who get adequate sleep. The construct is “adequate sleep.” The operational definition is a self-report item: reports \(\ge 7\) hours of sleep on a typical recent night. Among the 360 respondents, the proportion meeting that threshold is the locked \(\hat p = 0.45\) (\(162/360\)).
The gap here is dominated by self-report bias: people round, misremember, and answer in a socially desirable direction, so self-reported hours may systematically overstate true sleep — a bias that no increase in sample size removes. The \(\ge 7\)-hour cutoff is itself a measurement choice: a continuous construct (hours, quality) is collapsed into a binary, and the threshold is a design decision that moves \(\hat p\). (Coverage, nonresponse, and the bound \([0.27, 0.67]\) are Week 11’s sampling story; here the point is the measure, before any sampling concern.)
Design reading: \(\hat p = 0.45\) is an estimate about the operationalized measure — self-reported \(\ge 7\) hours — not directly about true adequate sleep. State the item and its self-report bias, or the population claim overreaches.
A compact way to record both is the construct → measure → likely error display:
| Construct | Operational definition (the recorded measure) | Likely measurement error |
|---|---|---|
| Improvement in study skill | Timed problem-solving gain \(=\) post − pre, in points | Noise (day-to-day score wobble, \(s_p \approx 6.0\)); possible bias if post-test is easier |
| Adequate sleep | Self-report: \(\ge 7\) hours on a typical recent night | Self-report bias (rounding, social desirability); threshold collapses a continuous construct |
Here is the same logic as static, non-executed R — the measurement model and the locked numbers shown as comments. Code is shown for teaching; it is not run in this diagnostic.
# Week 2 — measurement model for the recurring studies (STATIC, not executed)
# All data synthetic. Seed set for any random draw.
set.seed(45403)

# --- Study E: the gain score as construct + bias + noise -------------------
# Construct = true improvement in study skill (unobservable).
# Operational measure = timed problem-solving gain (post - pre), in points.
n_T <- 30; n_C <- 30                 # random ASSIGNMENT: 30 treatment / 30 control
ybar_T <- 8.0                        # locked: treatment mean gain
ybar_C <- 5.0                        # locked: control  mean gain
d      <- ybar_T - ybar_C            # observed effect = 8.0 - 5.0 = 3.0 points
s_p    <- 6.0                        # pooled SD ~ 6.0 : this is measurement+person NOISE
# A constant test-difficulty BIAS adds the SAME amount to both arms -> cancels in d:
test_difficulty_bias <- 1.0          # illustrative offset, points
ybar_T_obs <- ybar_T + test_difficulty_bias
ybar_C_obs <- ybar_C + test_difficulty_bias
d_obs <- ybar_T_obs - ybar_C_obs     # 9.0 - 6.0 = 3.0  -> SAME d : symmetric bias cancels
# Interpretation: sample size fights s_p (noise); it does NOT fix a bias that differs by arm.

# --- Study S: the sleep item as a thresholded self-report ------------------
n_resp   <- 360                      # respondents (sampling story is Week 11)
n_yes    <- 162                      # reported >= 7 hours
p_hat    <- n_yes / n_resp           # locked: 162/360 = 0.45
# Self-report BIAS is a fixed offset in p_hat; more respondents do not remove it:
# p_hat = 0.45 estimates the >=7h SELF-REPORT, not true adequate sleep.
The R re-states the design point: in Study E a symmetric measurement bias cancels in the difference \(d = 3.0\) but an arm-dependent bias would not, and the pooled SD \(s_p \approx 6.0\) is the noise that random assignment plus sample size manages; in Study S the self-report bias is a fixed offset in \(\hat p = 0.45\) that no sample size erases.
Worked example — operationalizing “food insecurity” for a campus study (transfer)
Now a new context. A campus wellbeing study wants to estimate food insecurity among students. The construct is clear enough as an idea, but it is not a recorded value until you choose a measure — and two reasonable choices behave differently. (These numbers are illustrative, distinct from the locked studies.)
- Single-item measure: one yes/no question, “In the last 30 days, did you skip meals because you could not afford food?” This is a binary categorical variable, cheap to collect, but it captures only one facet of the construct and is exposed to self-report bias (under-reporting a stigmatized experience) and to the threshold choice baked into the wording.
- Screening-scale measure: a validated multi-item screener summed to a 0–6 score, with \(\ge 3\) flagged as “insecure.” This is a numeric (then thresholded) variable, more reliable across repeats and closer to the full construct, but longer and still self-reported.
Suppose the single item flags \(0.18\) of respondents and the scale flags \(0.27\). The two operational definitions of the same construct give different estimates — not because food insecurity changed, but because the measure changed. That spread is the construct-vs-measure gap made visible.
Design reading: nothing about sampling or assignment is at issue here — the same population, measured two ways, yields \(0.18\) vs \(0.27\). The single item is likely the less valid operationalization (it misses students who ration rather than skip meals), and is more exposed to self-report bias. The design move is to state which measure you used and why, and to read the estimate as an estimate of that measure, not of the bare construct. Reporting “\(18\%\) of students are food insecure” without naming the single-item operationalization is exactly Risk 9.
A common mistake
Risk 9 — measurement error and poor operationalization ignored. The classic slip is to write the construct into the conclusion while having recorded only the measure: “the workshop improves study skill” (when you measured a timed gain score), or “\(45\%\) of students get adequate sleep” (when you measured a self-reported \(\ge 7\)-hour item). The fix is the three-sentence discipline — name the construct, name the operational definition, name the gap — and to keep bias and noise straight, because they call for different responses.
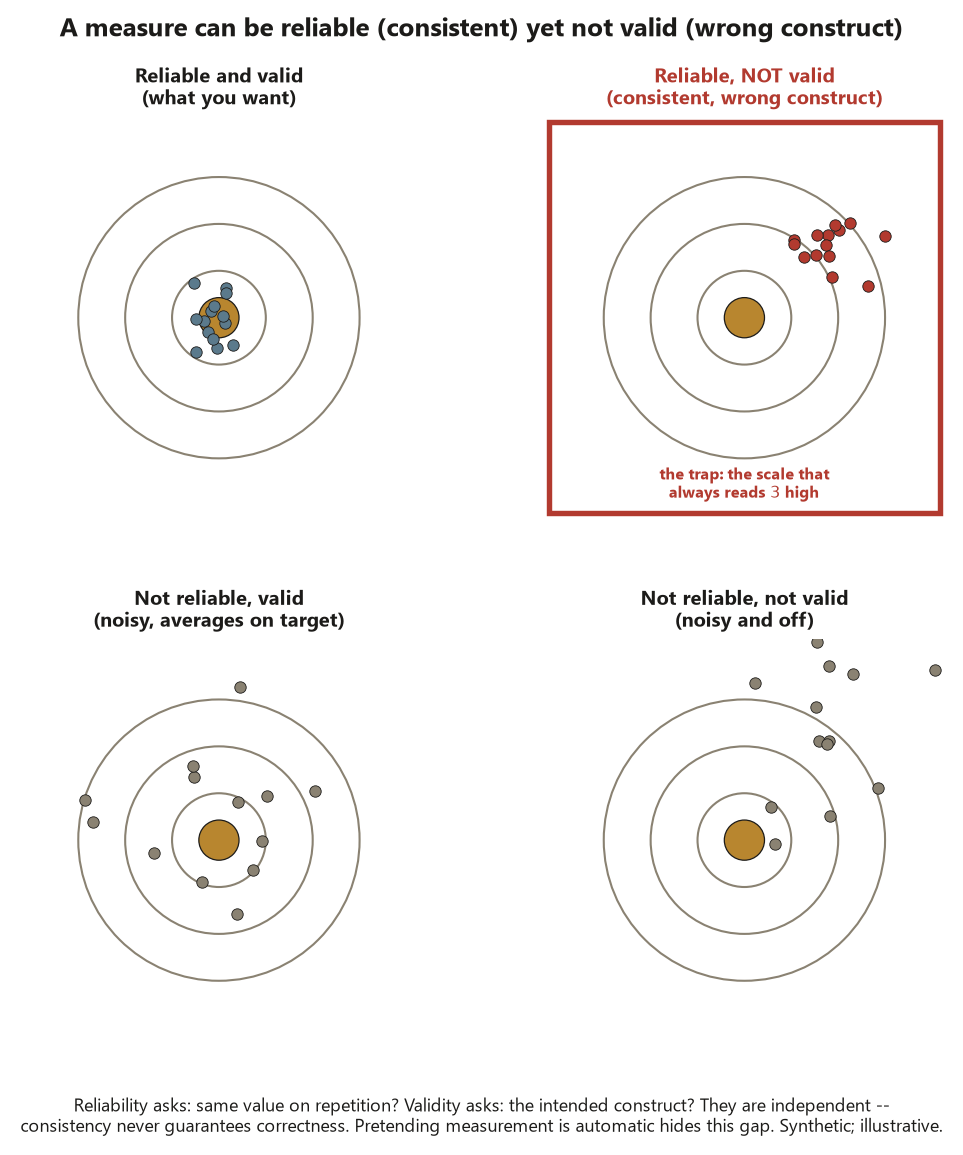
Two specific traps live inside this one. First, assuming sample size cures everything. It does not: a larger sample shrinks noise and tightens precision, but a systematic bias (a self-report offset, a miscalibrated instrument) is just as wrong at \(n = 30{,}000\) as at \(n = 30\). Second, confusing reliability with validity. A measure that repeats consistently (reliable) can still measure the wrong construct (not valid) — the scale that always reads three pounds high. A reviewer checking this page’s risk asks: are the construct, its measure, and the gap all stated, and are self-report and instrument error named rather than assumed away?
Low-stakes self-checks (ungraded)
These are ungraded practice — no points, no submission, just thinking.
- Write a one-sentence operational definition of “engagement in class” that another person could apply the same way you would. Then name one source of bias and one source of noise in it.
- For the Focus gain score (\(d = 3.0\), \(s_p \approx 6.0\)): if the post-test were systematically harder for the treatment arm only, would the bias cancel in \(d\)? Say why or why not in one sentence.
- Classify each as categorical (nominal/ordinal) or numeric: workshop arm; prior-performance tier; gain score; “hours of sleep last night”; the \(\ge 7\)-hour sleep indicator. Which one is a numeric construct collapsed into a category?
- A campus app logs phone “screen-time” automatically. Is that measure more reliable than a self-report of screen time? Is it necessarily more valid for the construct “time distracted from studying”? Answer the two questions separately.
- A team triples its survey sample but keeps the same self-report sleep item. Which kind of measurement error did they reduce, and which did they leave untouched?
Reading and source pointer
This week is grounded in the instructor notes (primary) and in IMS (Çetinkaya-Rundel & Hardin), the data-and-variables / measurement material — variable types (categorical/numeric, explanatory/ response) and the idea that data come from a measurement procedure. These notes are the course’s own synthesis, grounded in but not copied from the sources — no source prose, examples, datasets, or exercises are reproduced. IMS is CC BY-SA 3.0 (free at https://openintro-ims.netlify.app/); attribution is given and nothing is adapted wholesale.
Public vs. graded
These notes, the examples, and the practice here are public and ungraded — study material only. No graded prompts, answer keys, rubrics, point values, or due dates appear on this site. Graded design checkpoints, weekly quizzes, design memos and homework, applied design labs, the midterm, the final design project, and the final exam live in Blackboard (the LMS), which is authoritative for due dates, submissions, and grades. If this page and Blackboard ever disagree, follow Blackboard.
Looking ahead
Next week turns to the course’s signature distinction — random sampling vs random assignment — using Study S’s sampling against Study E’s assignment. Week 2 is the hidden prerequisite: a population claim earned by random sampling and a causal claim earned by random assignment are each only as trustworthy as the measure they rest on, so carry the construct-measure-gap habit into every design that follows.