Week 14 — Applied analysis report workshop
Turning an analysis into a clear, honestly-bounded report
Concept note
For thirteen weeks you have been building methods: paired and one-sample comparisons, two-group comparisons, one-way ANOVA, assumptions and diagnostics, multiple comparisons and contrasts, two-way ANOVA and interaction, simple and multiple regression, ANCOVA, contingency tables, and logistic regression. Every one of those weeks ran the same six-step analysis blueprint — Question → Structure → Method → Assumptions & diagnostics → Estimate & uncertainty → Conclusion — on a slice of the Cypress Ridge College Student-Success world. This week you do not add a method. You learn to assemble what you already have into a report someone else can trust: a short, reproducible, honestly-bounded write-up of an applied analysis. That assembly is its own skill, and it is the one most likely to fail in practice, because it is where a good model fit gets oversold into a claim the data cannot support.
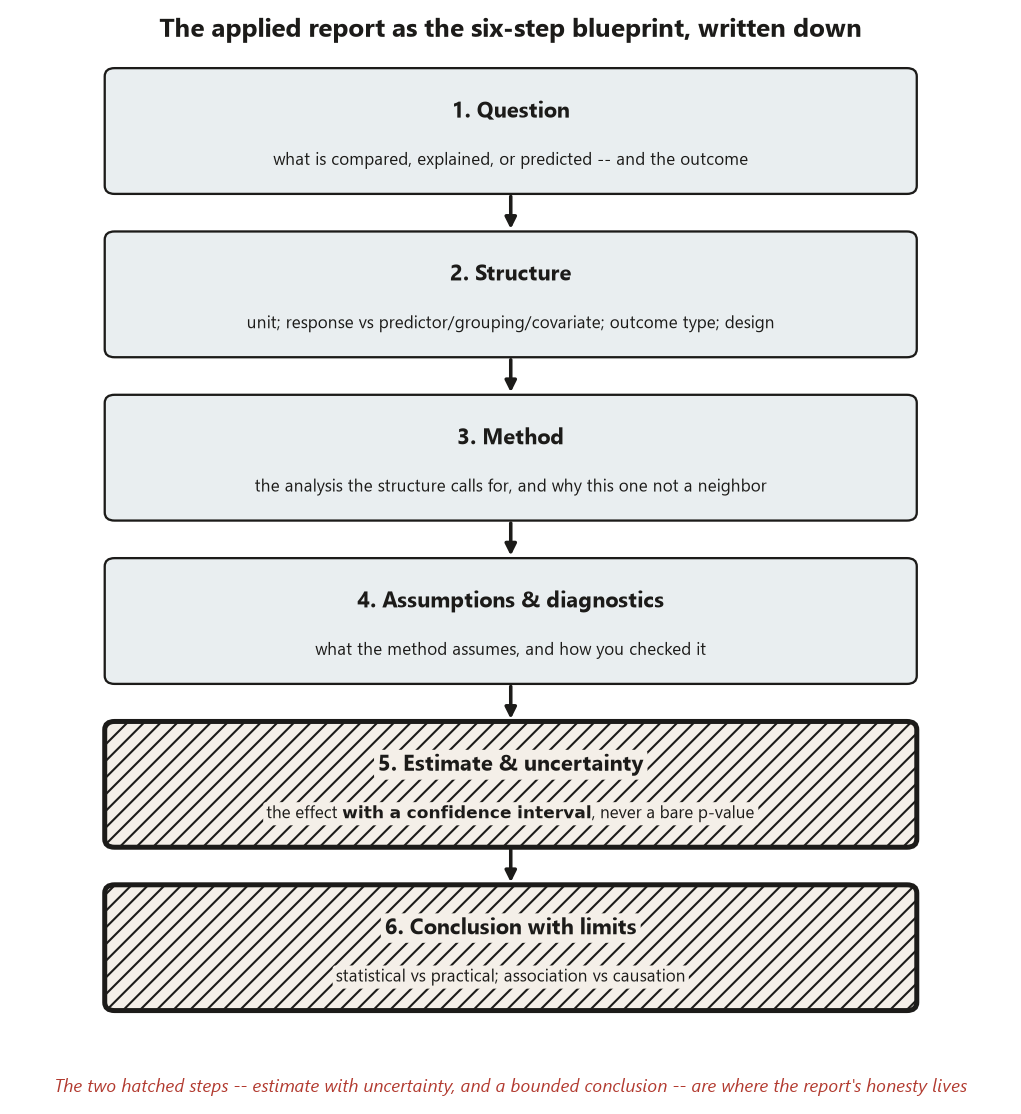
A good applied analysis report is the blueprint, written up. It is not a new structure — it is the six steps you already know, made legible to a reader and bounded by what the data and design license. Every report you write this week — and every report you will write in the applied methods project — should move through these stages, in order, and a reader should be able to find each one:
- Question. State the question in one sentence, naming what is compared, explained, or predicted, and the outcome. Not “is studying good?” but “how does final exam score move with weekly study hours, and by how much?”
- Structure. Name the unit of analysis, the response versus the explanatory / grouping / covariate variables, the outcome type (quantitative, categorical, binary), and the design (paired vs independent, one factor vs two, observational vs experimental). The structure is what decides which method is even reasonable, so it comes before any fit.
- Method. Name the analysis that matches that structure, and say why this one and not a neighbor. A quantitative outcome with one numeric predictor is a regression; a binary outcome is logistic regression. The method follows from the structure, not from habit.
- Assumptions & diagnostics. State what the method assumes and show how you checked — a residual plot, a QQ plot, leverage, linearity on the right scale. A fit you did not diagnose is a fit you cannot defend.
- Estimate & uncertainty. Report what the model estimates — a slope, a mean difference, an odds ratio — with a confidence interval, never a bare p-value. The interval is the honesty: it shows how much the estimate could plausibly move.
- Conclusion. State what the data support, in the language of the method, and then state the bounds: statistical versus practical significance, association versus causation, and what the analysis cannot support. Observational data buy association, not causation — name it every time.
That last stage is where the week’s discipline lives. The signature error of an applied report is overgeneralizing — writing a conclusion the design and the method do not license. The two throughline disciplines of this whole course converge here: report the estimate with its uncertainty, not just a verdict, and keep statistical significance, practical significance, and causation distinct. A report that quietly slides a significant slope into “studying causes higher scores,” or that prints a \(p\)-value and calls it a finding, throws away exactly the reasoning the course was built to teach. So every report ends by naming its own limits, and every report reports an interval, not a verdict.
This is a software_note_lab week — a workshop. The deliverable is not a new statistic but a reproducible report file, and most of the page below is about how to build, run, and bound that file. Your dataset numbers stay the locked synthetic ones from the course world (Dataset R from the Cypress Ridge study); the new skill is how you write them up, not what they are.
What a good applied analysis report is
A report is not a transcript of everything you ran. It is a selected, ordered argument that takes a reader from a question to a bounded conclusion, with the estimate and its uncertainty in the middle and the diagnostics in plain view. The backbone above is what makes it an argument rather than a printout.
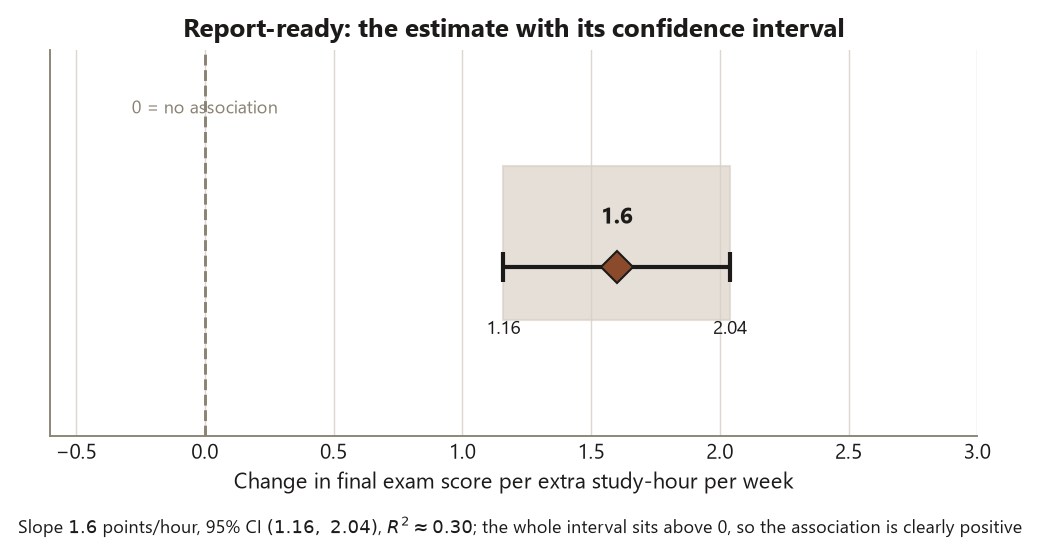
Concretely, on Dataset R: the question is “how does final exam score move with weekly study hours?”; the structure is one quantitative response (final score) and one quantitative explanatory variable (hours), measured on \(n = 120\) students, observational (nobody was assigned a study-hours dose); the method is simple linear regression, because the outcome is quantitative and the predictor is a number, not a label. The locked fit is
\[\widehat{\text{final}} = 55 + 1.6\cdot\text{hours},\]
with \(R^2 \approx 0.30\), residual SD \(\approx 10\), slope standard error \(\approx 0.22\), so \(t = 1.6 / 0.22 \approx 7.3\), \(p < 0.001\), and a 95% confidence interval for the slope of \((1.16,\ 2.04)\). The report does not stop at “\(p < 0.001\).” It says: each extra study-hour per week is associated with about \(+1.6\) final points on average, and we are 95% confident the true slope is between \(1.16\) and \(2.04\) points per hour. That is an estimate with its uncertainty — the blueprint’s step 5, written for a reader.
A shown report-build sequence
The report is built, not narrated. Below (in the next section) is a numbered sequence that takes Dataset R through all six steps inside a single reproducible .qmd: set the seed, read the data, look at the shape, fit the model, read the estimate with its interval, check a diagnostic, and write the bounded conclusion. The same sequence works whether the outcome is quantitative (regression) or binary (logistic) — only step 3’s method and step 5’s estimate change. For the quantitative final score it is an lm() and a slope; for the binary pass = (final >= 70) outcome it is a glm(..., family = binomial) and an odds ratio.
The reason to fix the sequence is the same reason to fix the report template: when the structure is constant, the reader spends their attention on your reasoning — which method, which assumption, which bound — instead of decoding your layout. A predictable report is a checkable report.
The report template sections and the reproducible-file convention
Inside the .qmd, write the six blueprint steps as headed sections, every time, so the Assumptions and Conclusion sections are always present and always findable — those are the two a hurried reader skips and a careful reader checks. The reproducible-file convention (detailed two sections down) is one self-contained Quarto file per analysis, opened with set.seed(35203), with named files, so a reader can re-run it and get your exact numbers. A result you cannot reproduce is a result you cannot defend, and a report whose data are synthetic must say so — every report this week flags its data as synthetic, seed set.
Setup and practice sequence
You will work one full report this week on Dataset R — taking the final-score regression and the pass/fail logistic model end-to-end through the blueprint — and then one report on a dataset you choose. Each report follows the six-step backbone. Here is the practice sequence; the static R/Quarto idioms are shown as teaching, not executed on this site (R is not run here).
Step 1 — Set up the report file. Create one .qmd file for the report, open it with set.seed(35203) so any synthetic draw is reproducible, and read in the (synthetic) Dataset R. One file, one analysis, one seed — that is the unit of work. Write the Question sentence first, before any code, so the analysis serves the question rather than the other way around.
Step 2 — Name the structure before choosing a method. Look at the data. Dataset R has \(120\) students, a quantitative response (final score) for the regression and a binary response (pass) for the logistic model, study hours as a numeric predictor, and a program factor — and the design is observational (students chose their study hours and their support program). Write the structure down in a sentence, because the structure is your justification for the method that follows, and because “observational” is what will bound the conclusion.
Step 3 — Choose the method from the structure. Quantitative outcome, numeric predictor → simple linear regression (lm(final ~ hours)). Binary outcome → logistic regression (glm(pass ~ hours + program, family = binomial)). The method is read off the structure, not chosen from preference.
Step 4 — Fit, and read each estimate in a sentence with its uncertainty. Do not just print numbers. Report the regression slope \(1.6\) with its 95% CI \((1.16,\ 2.04)\); report the logistic coefficients as odds ratios — \(e^{0.22} \approx 1.25\) per study-hour, \(e^{1.0} \approx 2.72\) for Structured versus None — never as bare log-odds. This is where the static R below lives.
Step 5 — Check a diagnostic. Plot the regression residuals against the fitted values and a QQ plot: for Dataset R they are roughly normal with mild heteroscedasticity, and one high-leverage student (investigate, do not drop). For the logistic fit, the issue is reading the coefficients on the right scale — a log-odds is not a probability. A fit you did not check is not yet a result.
Step 6 — Compare the raw and adjusted estimates, and let the gap carry the lesson. The simple-hours slope \(1.6\) drops to \(1.1\) in the multiple regression that adds attendance and pretest (multiple \(R^2 \approx 0.46\)); the raw odds ratio for Structured versus None (\(\approx 3.67\) from the contingency table) shrinks to \(\approx 2.72\) once the logistic model adjusts for hours and pretest. The shrinkage is confounding made visible — students who study more also attend more and start higher — and it is the single most important thing the report has to communicate honestly.
Step 7 — Write the bounded conclusion. State the supported claim in the method’s language — a slope, an odds ratio, each with its interval — then the limits: statistical versus practical significance, and association, not causation, because the data are observational. Your turn comes at the end of the sequence: repeat all seven steps on a dataset of your own choosing (see the your turn prompt below).
Here is the worked report core as static, non-executed R — a single .qmd’s analysis chunk. The numbers in the comments are the course’s locked synthetic values.
set.seed(35203)

# ============================================================
# APPLIED ANALYSIS REPORT — Dataset R (Cypress Ridge Student-Success)
# n = 120 students: study hours/week, attendance %, pretest,
#   support program {None, Drop-in, Structured}, final score,
#   pass = (final >= 70). Observational. Synthetic; seed set.
# ============================================================

# --- Question: how does final score move with study hours, and
#     does the support program raise the odds of passing? ---
# --- Structure: quantitative response (final) + binary response (pass);
#     numeric predictor (hours) + factor (program); observational. ---

# --- Method 1: simple linear regression (quantitative outcome) ---
fit_simple <- lm(final ~ hours, data = R)
summary(fit_simple)
# (Intercept)  55.0
# hours         1.60   SE 0.22   t 7.3   p < 0.001
# Multiple R-squared: 0.30   Residual SE ~ 10
confint(fit_simple)["hours", ]      # 95% CI for slope: (1.16, 2.04)

# --- Method 1b: multiple regression — adjust for attendance + pretest ---
fit_multi <- lm(final ~ hours + attendance + pretest, data = R)
summary(fit_multi)
# hours slope drops 1.6 -> 1.1 after adjustment (confounding)
# Multiple R-squared: 0.46

# --- Diagnostics: residuals vs fitted + QQ (shown as the idea) ---
# plot(fit_multi)   # roughly normal, mild heteroscedasticity,
#                   # one high-leverage student -> investigate, do NOT drop

# --- Method 2: logistic regression (binary outcome pass) ---
fit_logit <- glm(pass ~ hours + pretest + program,
                 family = binomial, data = R)
exp(coef(fit_logit))
# hours              exp(0.22) ~= 1.25   (OR per study-hour)
# programStructured  exp(1.0)  ~= 2.72   (adjusted OR vs None)
# raw OR from the 3x2 pass-by-program table was ~3.67
#   -> shrinks to 2.72 after adjusting for hours + pretest

# slope = 1.6 (CI 1.16,2.04)   adjusted slope = 1.1   R^2 0.30 -> 0.46
# OR/hour ~ 1.25   OR Structured ~ 2.72 (raw 3.67)
Read each result and name its blueprint move. The regression slope \(1.6\) with 95% CI \((1.16,\ 2.04)\) estimates how final score moves with study hours — about \(+1.6\) points per extra hour per week — reported with its interval, not as a bare \(p\); it assumes roughly linear, constant-variance, independent errors, which the residual and QQ plots check; and because the data are observational, it cannot prove that studying more causes a higher score (motivated students study more, attend more, and start higher). The adjusted slope \(1.1\) in the multiple regression is the same estimate “with attendance and pretest held fixed” — the drop from \(1.6\) to \(1.1\) is confounding, not an error. The logistic odds ratios live on the odds scale: \(e^{0.22} \approx 1.25\) means each extra study-hour multiplies the odds of passing by about \(1.25\), and \(e^{1.0} \approx 2.72\) means a Structured student’s odds of passing are about \(2.72\) times a None student’s, adjusting for hours and pretest — and that it shrank from the raw \(3.67\) is the same confounding story the regression told. None of these is a probability, and none is a causal effect; an odds ratio is read with its bound attached.
Your turn — draft a report outline (ungraded practice)
Pick a different dataset — one of the other Cypress Ridge slices (Dataset P paired pre/post, Dataset G two-group final scores, Dataset F format ANOVA, Dataset X two-way) or a small dataset of your own — and draft the six-section report outline before you fit anything. For each section write one or two sentences: the Question (what is compared/explained/predicted, and the outcome); the Structure (unit, response vs explanatory/grouping/covariate, outcome type, paired vs independent, observational vs experimental); the Method you would use and why that one; the assumption you would most need to check and how; the estimate you would report and the interval you would attach to it; and the bound — statistical vs practical, association vs causation — you would have to state. This is self-check practice only: you are rehearsing the blueprint, not producing a graded memo.
Reproducible-file convention
A report is only as trustworthy as it is reproducible. The convention for this workshop, and for the applied methods project, is one self-contained Quarto report file that someone else can re-run and get your exact numbers.
One
.qmdper analysis. Each report is a single Quarto document that holds the question, the code, the output, and the prose conclusion together — no loose scripts whose output you pasted in by hand. (The R is shown as non-executedrfences so the page renders without R; run the chunks yourself in your own R session.)set.seed(35203)at the top. Every report that draws randomness — a synthetic-data report always does — fixes the seed once, near the top, so any simulated values and any resampled interval are reproducible to the digit. A result you cannot reproduce is a result you cannot defend.Named files, clear structure. Use descriptive names —
report-R-regression.qmd,report-R-logistic.qmd, and adata/folder for the (synthetic) inputs — so a reader can tell what each file does without opening it. One question per file.The report template sections. Inside the
.qmd, write the same six blueprint steps every time, as headed sections, so any reader knows where to look:--- title: "Study hours, support program, and final outcomes — an applied report" --- ## Question # one sentence: what is compared/explained/predicted, and the outcome ## Structure # unit; response vs explanatory/grouping/covariate; outcome type; design ## Method # the analysis that matches the structure, and WHY this one ## Diagnostics # what the method assumes and how you checked (residuals, QQ, leverage) ## Estimate # the slope / odds ratio WITH its confidence interval (never a bare p) ## Conclusion # supported claim in method language + explicit bounds (stat vs practical; # association vs causation, because the data are observational)
Keep the same skeleton across reports. When the structure is fixed, the reader spends their attention on your reasoning — the part that actually varies — instead of decoding your layout. The template is not bureaucracy; it is what makes the honesty checkable, because the Estimate section always shows an interval, and the Conclusion section always names what the analysis cannot support.
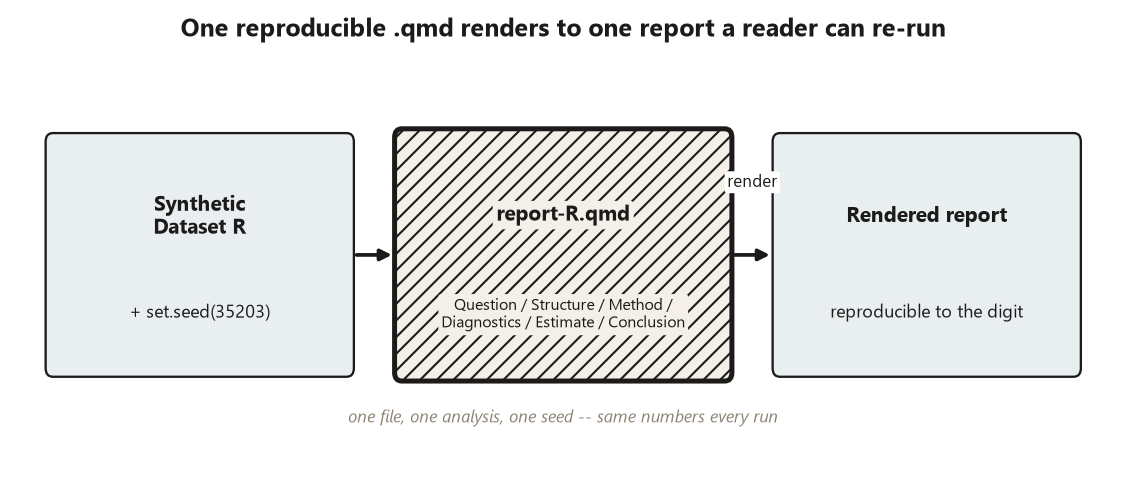
.qmd — opened with set.seed(35203), holding the six blueprint sections (Question, Structure, Method, Diagnostics, Estimate, Conclusion) — that renders to one report file a reader can re-run and get your exact numbers. One file, one analysis, one seed: a result you cannot reproduce is a result you cannot defend. A structural diagram; no synthetic data are shown.
Debugging
The failures in this week are not syntax errors — the code runs fine. They are analysis-and-report failures, where a clean model fit produces a misleading report. Here are the common ones and the fix.
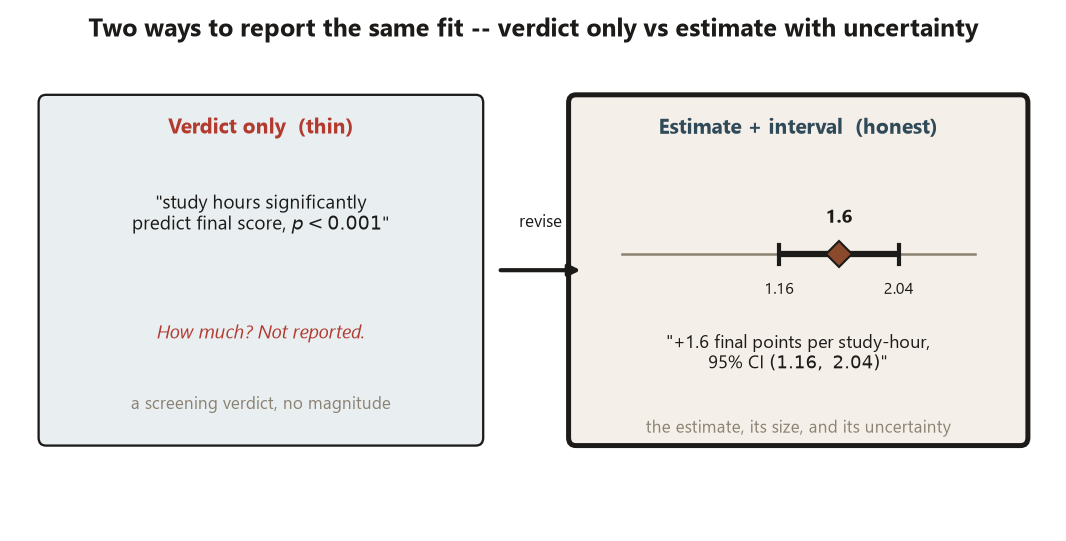
Failure 1 — reporting a bare p-value instead of an estimate with its uncertainty. The report writes “study hours significantly predict final score (\(p < 0.001\))” and stops. A \(p\)-value is a screening verdict; it says nothing about how much. Fix: report the estimate with its interval — the slope \(1.6\) points per study-hour, 95% CI \((1.16,\ 2.04)\) — and interpret it in a sentence. The interval is the honesty; the \(p\)-value alone is a verdict the course explicitly refuses.
Failure 2 — sliding into causal language from observational data (this week’s classic mistake). The report writes “studying more raises final scores,” or “the Structured program causes more students to pass.” Dataset R is observational — students chose their hours and their program — so a significant slope or odds ratio is association, not causation. The confounding is even visible in the numbers: the hours slope drops \(1.6 \to 1.1\) once attendance and pretest are adjusted for, and the Structured odds ratio shrinks \(3.67 \to 2.72\) — motivated students self-select into more studying and into Structured support. Fix: write the conclusion as association (“students who studied more tended to score higher”), name the design as observational, and say explicitly that the analysis cannot support a causal claim without a randomized assignment.
Failure 3 — confusing statistical with practical significance. With \(n = 120\) a small effect can be statistically significant; the report then treats “significant” as “important.” Fix: read the estimate on its real scale and judge it practically: \(+1.6\) final points per study-hour, or an adjusted odds ratio of \(2.72\), is a meaningful change worth acting on — but a tiny significant slope would not be, no matter how small its \(p\)-value. Statistical \(\ne\) practical; say which you mean.
Failure 4 — misreading a logistic coefficient as a probability. The report says “Structured raises the chance of passing by \(1.0\)” (reading the raw log-odds as a probability) or “by \(2.72\)” (reading an odds ratio as a probability). Fix: coefficients are log-odds; exponentiate to an odds ratio (\(e^{1.0} \approx 2.72\)); to talk about chance, report a predicted probability from the S-curve. And \(\mathrm{OR} \ne \mathrm{RR}\) — do not call an odds ratio a relative risk.
Failure 5 — deleting an influential point silently. On Dataset R a tempting “fix” is to drop the one high-leverage student so the line “behaves,” and report the cleaned slope without saying so. That is data manipulation, not analysis. Fix: never auto-delete. Investigate the point, report the fit with and without it as a sensitivity note, and keep every observation unless you have a documented reason to exclude it.
Failure 6 — an unreproducible report. The seed is missing, so re-running gives different synthetic values, or numbers were pasted in by hand and no longer match the code. Fix: set.seed(35203) once, near the top, and let the .qmd produce every number it reports — no hand-pasting.
AI Use Note
AI tools may help you draft and check a report, but they cannot be the analyst — every number and every bounded claim is yours to verify. Treat AI output as a draft to audit, not an answer to trust, and disclose its use. The course discipline is unchanged: you own the blueprint reasoning, the estimate, its interval, and the bound.
| Tool | Purpose | Verification |
|---|---|---|
| LLM chat assistant | Draft the prose of the Conclusion and tighten the Question sentence | Re-read against the actual fit; confirm the claim is bounded (association, not causation, on observational data) and reports the estimate with its interval, not a bare \(p\) — rewrite any sentence the data do not support |
| AI coding assistant | Scaffold the .qmd report template and the lm() / glm() fit and confint() idioms |
Run it yourself with set.seed(35203); confirm it fits the right model for the structure and reproduces the locked numbers (\(1.6\) slope, OR \(\approx 2.72\)); never paste code you cannot read |
| Grammar / style checker | Polish wording and wrapping in the report prose | Confirm it changed no number, statistic, or hedge; an edit that drops a confidence interval or a “for these observational data” is a content change, not a style fix |
| Plot / figure helper | Suggest a residuals-vs-fitted or QQ plot for the Diagnostics section | Check the plot shows the real shape (mild heteroscedasticity, the high-leverage point) and is not smoothed into looking clean; the diagnostic must justify trusting the estimate |
Reading and source pointer
This week is grounded in the instructor notes (the primary course materials) on assembling and communicating an applied analysis, with ModernDive (Ismay, Kim & Valdivia) on reproducible reporting with R/Quarto for the report workflow — the reproducible Quarto posture and the discipline of letting the data structure drive the method choice and the write-up. These notes are the course’s own synthesis, grounded in but not copied from the sources. No prose, examples, exercises, figures, or solutions are reproduced from any source.
Public vs. graded
These notes, the examples, and the practice here are public and ungraded — study material only. No graded prompts, answer keys, rubrics, point values, or due dates appear on this site. Graded applied-methods checkpoints, weekly quizzes, homework and analysis memos, applied analysis labs, the midterm, the applied methods project, and the final exam live in Blackboard (the LMS), which is authoritative for due dates, submissions, and grades. If this page and Blackboard ever disagree, follow Blackboard.
Portfolio connection
The report file you build this week is the prototype for your applied methods project, and it belongs in your portfolio as evidence that you can take an analysis all the way from a question to a clear, honestly-bounded write-up. Keep your Dataset R report — the regression-and-logistic walk-through — plus the report you draft on a dataset of your own choosing, as portfolio artifacts. Each one should show the same six-step backbone (question → structure → method → diagnostics → estimate with its interval → bounded conclusion), so the portfolio demonstrates not a single result but a repeatable, defensible workflow. When you assemble the portfolio, the reproducible .qmd (with its set.seed(35203)) and the AI Use Note travel with the report — they are part of the evidence that the work is yours, reproducible, and bounded by what the data support. The two recurring disciplines — report the estimate with its uncertainty, and keep statistical, practical, and causal claims distinct — are exactly what a reviewer of your portfolio will look for.
See also
- Week 10 — Simple & multiple regression review — the regression slope and the \(1.6 \to 1.1\) adjustment your report packages.
- Week 13 — Logistic regression for binary outcomes — the odds ratios (\(1.25\) per hour, \(2.72\) for Structured) the report reads on the right scale.
- Week 15 — Applied methods synthesis and review — the whole blueprint across the five datasets, which your report instantiates once.
- Reporting and interpretation guide — effect sizes, confidence intervals, practical vs statistical, and association vs causation for applied writing.
- Lab 10 — Building and checking a regression — the companion lab whose fit-and-diagnose workflow feeds the Method and Diagnostics sections.