Week 13 — Logistic regression for binary outcomes
Modeling a yes/no outcome: odds, odds ratios, and predicted probabilities
The week question
Last week the outcome was a category and the tool was a contingency table: you cross-tabulated pass against support program and read a chi-square, a risk difference, a relative risk, and an odds ratio of about \(3.67\) for Structured versus None. That table answered “is the pass rate associated with the program?” but it could only hold one explanatory variable at a time. This week the outcome stays the same — a yes/no pass — but the question gets greedier. You want to model the probability of passing as it depends on several predictors at once: study hours, pretest, and program, all in one model. That is exactly the move you made in week 10 when you went from a simple regression to a multiple regression, only now the response is binary rather than a final score.
So the week’s question is: how do you build a regression model for a 0/1 outcome, what does each coefficient estimate, and how do you turn those coefficients into something you can actually report — an odds ratio and a predicted probability — without overstating what an observational model can support? The short answer is logistic regression: a regression on the log-odds of the outcome. The coefficients live on a scale you cannot read directly, so the whole craft of the week is translation — from log-odds to odds ratios, and from the linear predictor to a curved, bounded predicted probability. And because the data are observational, the same association-versus-causation discipline that governed weeks 5, 10, 11, and 12 governs this week too: an adjusted odds ratio describes an association better, but it does not turn one into a cause.
Why this matters
Binary outcomes are everywhere in applied work — pass or fail, default or repay, relapse or remain well, click or do not click, survive or not — and the instinct to reach for ordinary linear regression on a 0/1 response is strong and wrong. A line is unbounded; it will happily predict a “probability” of \(1.3\) or \(-0.2\), which is nonsense, and it assumes a constant, additive effect on a quantity (probability) that physically cannot move at a constant rate near its floor of \(0\) or its ceiling of \(1\). Logistic regression exists to respect those two facts: it keeps predicted probabilities inside \((0, 1)\) and it lets a predictor’s effect on probability be larger in the middle and smaller at the extremes, which is how real yes/no outcomes behave. That is the first reason the week matters — it is the standard, defensible model for the most common kind of outcome you will meet.
It matters a second time because the coefficients are not directly interpretable, and most misreadings of logistic regression trace to forgetting that. A logistic coefficient is a change in log-odds per unit of the predictor. Nobody thinks in log-odds. So you must exponentiate it to get an odds ratio, which is interpretable, and you must run the linear predictor back through the S-curve to get a predicted probability, which is what a reader actually wants. Getting that translation right — and refusing to read the raw coefficient as if it were a probability or a slope on probability — is the load-bearing skill of the week.
It matters a third time because logistic regression is where the course’s confounding throughline reaches its last and cleanest expression. In week 12 the unadjusted odds ratio for Structured versus None was about \(3.67\). This week, once you put hours and pretest into the same model, that odds ratio shrinks to about \(2.72\). That shrinkage is the same story you told with the regression slope (\(1.6 \to 1.1\)) and the ANCOVA adjusted means: students who landed in the Structured program also tended to study more and start higher, and some of the apparent program advantage was really those other variables wearing the program’s coat. Adjustment strips part of that away. It buys a better-described association — never a license to say “the program caused passing,” because students self-selected into programs and this is observational data start to finish.
Learning goals
By the end of this week you should be able to:
- Explain why ordinary linear regression is the wrong model for a 0/1 outcome, and state the two facts logistic regression is built to respect: predicted probabilities stay in \((0, 1)\), and a predictor’s effect on probability is nonlinear (an S-curve).
- Write the logistic model on the log-odds scale, \(\operatorname{logit}(p) = \ln\frac{p}{1-p} = b_0 + \sum b_k X_k\), and say in words what each coefficient is — a change in log-odds per one-unit change in its predictor, holding the others fixed.
- Exponentiate a coefficient to an odds ratio (\(e^{b_k}\)) and interpret it — here \(e^{0.22} \approx 1.25\) per study-hour and \(e^{1.0} \approx 2.72\) for Structured versus None — as a multiplicative change in the odds, not in the probability and not in the relative risk.
- Compute a predicted probability for a specific student by running the linear predictor through the inverse logit \(p = 1/(1 + e^{-\eta})\), and read why two students can have the same odds ratio between them yet very different probability gaps depending on where they sit on the curve.
- Connect the adjusted odds ratio (\(\approx 2.72\)) to the unadjusted one (\(\approx 3.67\) from week
- as another instance of confounding → adjustment, and state clearly what the model can support (an adjusted association) and cannot (a causal claim, or a relative risk read off the odds ratio).
Core vocabulary
- Binary (0/1) outcome — a response with exactly two categories coded \(1\) (“success,” here pass) and \(0\) (“failure,” here fail). The model targets \(p = \Pr(Y = 1 \mid X)\), the probability of the \(1\)-coded category given the predictors.
- Odds — the ratio \(\dfrac{p}{1-p}\) of the probability of success to the probability of failure. A probability of \(0.75\) is odds of \(0.75/0.25 = 3\) (“3 to 1”). Odds run from \(0\) to \(\infty\), unlike a probability, which is capped at \(1\).
- Log-odds (logit) — \(\operatorname{logit}(p) = \ln\dfrac{p}{1-p}\), the natural log of the odds. It runs over all real numbers, which is why a linear model can be placed on it without bumping into the \(0\)/\(1\) ceiling.
- Logistic regression — a regression that models the log-odds of a binary outcome as a linear function of the predictors: \(\operatorname{logit}(p) = b_0 + \sum b_k X_k\). Fit by maximum likelihood, not least squares, via
glm(..., family = binomial). - Odds ratio (OR) — \(e^{b_k}\), the multiplicative factor by which the odds of success change for a one-unit increase in \(X_k\), holding the other predictors fixed. \(\mathrm{OR} > 1\) means higher odds; \(\mathrm{OR} = 1\) means no association; \(\mathrm{OR} < 1\) means lower odds.
- Predicted probability — the model’s estimate of \(p\) for a given set of predictor values, obtained by inverting the logit: \(\hat p = 1/(1 + e^{-\hat\eta})\), where \(\hat\eta = b_0 + \sum b_k X_k\) is the linear predictor. It is an S-curve in the predictors — bounded, and nonlinear.
- Adjusted vs unadjusted odds ratio — the OR from a model that controls for other predictors (here hours and pretest) versus the OR from a one-variable table (week 12). The two differ when the other predictors are confounders.
- \(\mathrm{OR} \ne \mathrm{RR}\) — the odds ratio and the relative risk are different numbers and only coincide when the outcome is rare. Reporting an OR as if it were a relative risk overstates the effect when the outcome is common.
Concept development
Why not a line — the logit and the logistic model
Imagine fitting lm(pass ~ hours) to Dataset R, with pass coded \(0/1\). The fit would be a straight line through a cloud of points stacked at \(0\) and \(1\), and you would read its height as a “probability of passing.” Two things go wrong immediately. First, a line is unbounded, so far enough out in hours — or back at zero hours — the fitted “probability” leaves \([0, 1]\) entirely, predicting impossibilities. Second, a line assumes the effect of one more study-hour is the same at every starting point: \(+1.6\) points was fine for a final score, which has room to move in either direction, but probability has a floor and a ceiling, and near them a constant additive bump cannot be right. Moving a student from \(0.95\) to \(1.10\) is meaningless; the effect of an hour has to taper as you approach the edges.
Logistic regression fixes both problems with one change of scale. Instead of modeling \(p\) directly, it models the log-odds,
\[ \operatorname{logit}(p) = \ln\frac{p}{1-p} = b_0 + b_1 X_1 + b_2 X_2 + \cdots + b_k X_k . \]
The log-odds runs from \(-\infty\) to \(+\infty\), so a linear predictor lives on it comfortably with no ceiling to crash into. To get back to a probability, invert the logit:
\[ \hat p = \frac{1}{1 + e^{-\hat\eta}}, \qquad \hat\eta = b_0 + \sum_k b_k X_k . \]
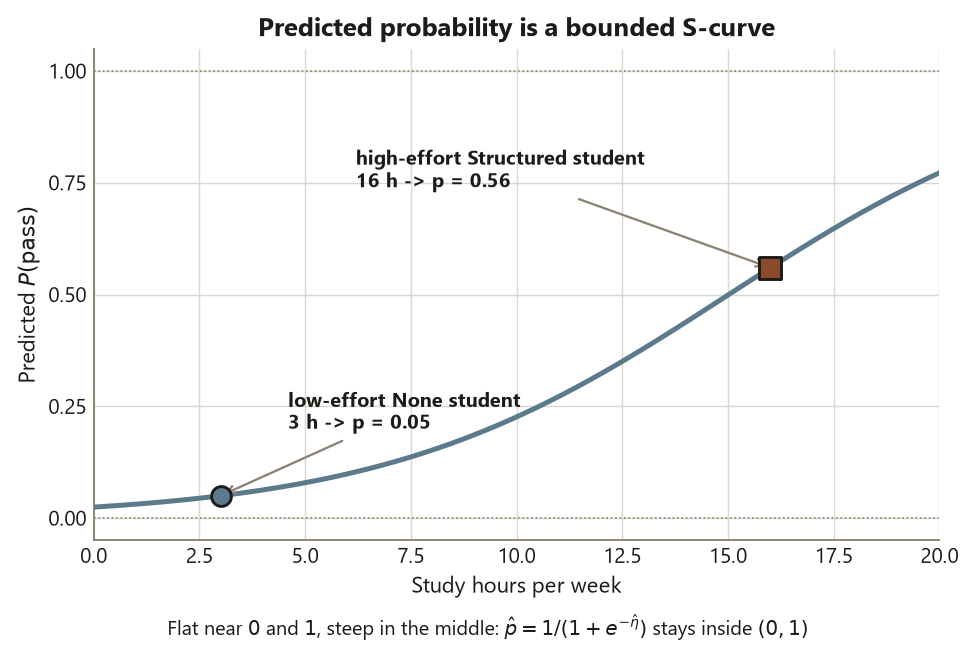
That inverse-logit function is the S-curve (the logistic curve): it is flat near \(0\), flat near \(1\), and steep in the middle, which is exactly the tapering behavior probability needs. The blueprint’s step three — method matching structure — is satisfied here because the structure is a binary response with multiple predictors of mixed type (two quantitative, one categorical), and logistic regression is the model built for precisely that structure. It is not a different universe from week 10’s regression; it is the same “response as a linear function of predictors” idea, moved onto the log-odds scale so it fits a yes/no outcome.
Coefficients are log-odds; exponentiate to odds ratios; the probability is a curve
Here is the locked Dataset R model, with pass as the outcome and None as the reference program:
\[ \operatorname{logit}(\hat p) = b_0 + 0.22\cdot\text{hours} + 0.04\cdot\text{pretest} + 0.6\,[\text{Drop-in}] + 1.0\,[\text{Structured}]. \]
Every coefficient is on the log-odds scale, and that is the trap: \(0.22\) is not “passing goes up \(0.22\) per hour,” and \(1.0\) is not “Structured students pass at probability \(1.0\).” A log-odds change of \(0.22\) means nothing to a human reader until you exponentiate it. So translate. For study hours,
\[ \mathrm{OR}_{\text{hour}} = e^{0.22} \approx 1.25 . \]
Read it as: holding pretest and program fixed, each additional study-hour per week multiplies the odds of passing by about \(1.25\) — a \(25\%\) increase in the odds, not in the probability. For the program indicator,
\[ \mathrm{OR}_{\text{Structured vs None}} = e^{1.0} \approx 2.72 , \]
so, holding hours and pretest fixed, a Structured student has about \(2.72\) times the odds of passing of an otherwise-identical None student. (For Drop-in, \(e^{0.6} \approx 1.82\).) These exponentiated numbers are the estimates you report — an odds ratio is the natural effect measure for a logistic coefficient, the same way a slope was for an ordinary regression.
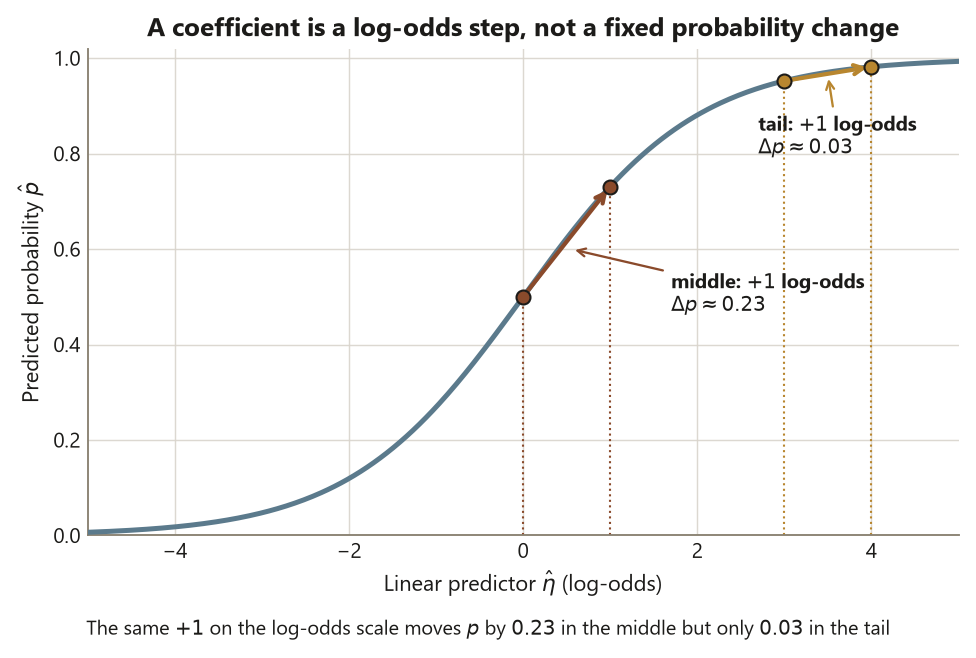
But the odds ratio is constant while the probability change is not, and that is the conceptual heart of the section. Because the model is linear in log-odds, one more hour multiplies the odds by \(1.25\) no matter where you start — but what that does to the probability depends entirely on where you are on the S-curve. Near the steep middle, \(+1\) hour might move probability several points; out near \(0.05\) or near \(0.95\), the same hour barely nudges it. So you can never read a coefficient, or even its odds ratio, as a fixed change in probability. To talk about probability you must pick specific predictor values and run them through the inverse logit — which is the next worked move.
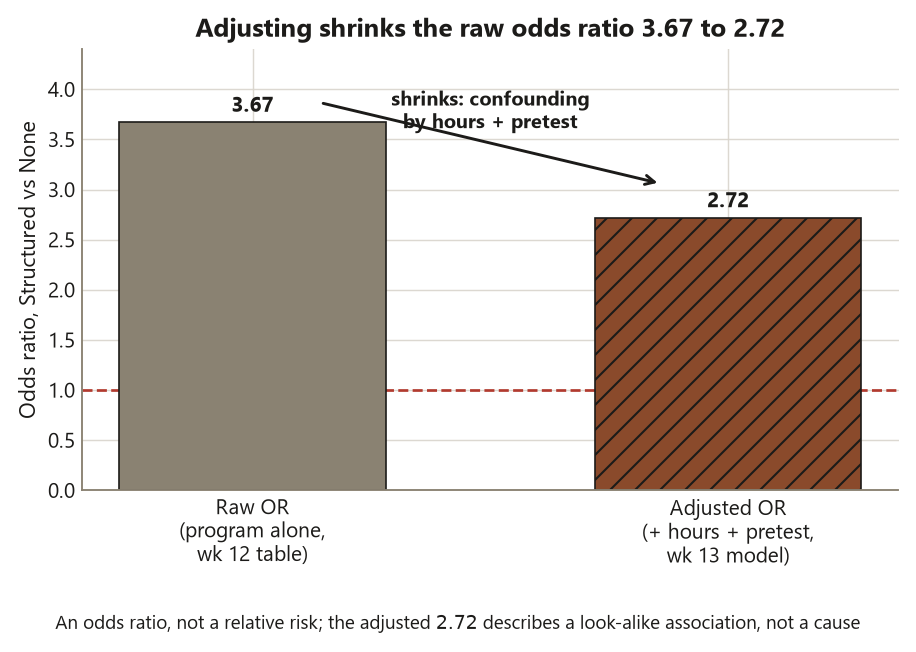
Adjusted vs unadjusted: the raw 3.67 shrinks to 2.72
Now connect this week to last. In week 12 the contingency table gave Structured a \(75\%\) pass rate and None a \(45\%\) pass rate, for an unadjusted odds ratio of
\[ \mathrm{OR}_{\text{raw}} = \frac{0.75/0.25}{0.45/0.55} = \frac{3.0}{0.818} \approx 3.67 . \]
That number used program alone. This week, when you put hours and pretest into the same model, the Structured-versus-None odds ratio shrinks to about \(2.72\). Nothing about the data changed — the same \(120\) students, the same passes — only the question changed, from “what are the odds overall for Structured versus None?” to “what are the odds for Structured versus None among students with the same hours and the same pretest?”
The shrinkage from \(3.67\) to \(2.72\) is confounding, exactly as in weeks 10 and 11. Students who ended up in the Structured program also, on average, studied more hours and walked in with higher pretest scores. In the raw table, those advantages were quietly credited to the program, inflating its odds ratio. Once hours and pretest are in the model, they take back their share of the credit, and what remains attached to the program label is smaller — but more honest. This is the same drop you saw when the regression hours slope fell from \(1.6\) to \(1.1\) after adjustment, and when the ANCOVA format gaps narrowed once the pretest was controlled. The mechanism repeats because the world repeats: in observational data, the groups you compare differ in more than the label you care about.
Two cautions ride along, and both belong in the report. First, \(\mathrm{OR} \ne \mathrm{RR}\). The odds ratio of \(2.72\) is not “Structured students pass \(2.72\) times as often.” Because passing is common here (not a rare event), the relative risk is much closer to \(1\) than the odds ratio is — last week’s relative risk for the raw comparison was only about \(1.67\) even though the raw odds ratio was \(3.67\). Quoting an odds ratio as a relative risk overstates the effect whenever the outcome is common. Second, association is still not causation. Adjusting for hours and pretest narrows the comparison but does not randomize it; students chose their programs, unmeasured differences remain, and the adjusted odds ratio describes an association among look-alike students — it does not earn the word “caused.”
Worked examples
Worked example — Dataset R: the logistic model, its odds ratios, and two predicted probabilities (recurring slice)
The question. Does the probability of passing (final \(\ge 70\)) depend on study hours, pretest, and support program once all three are considered together — and by how much? This is a predict/explain question about a binary outcome with multiple predictors.
The structure. The unit of analysis is the student (\(n = 120\)). The response is pass, a binary outcome coded \(1\)/\(0\). The explanatory variables are hours (quantitative), pretest (quantitative), and program (categorical, three levels, reference None). The design is observational — students self-selected into programs — so any association we estimate is adjusted, not causal. Data are synthetic; seed set.
The assumptions and diagnostics. Logistic regression assumes the log-odds is linear in the quantitative predictors, the observations are independent (different students — they are), there is no severe multicollinearity among predictors (hours and attendance were correlated in week 10, but the VIFs were mild), and the binary outcomes are Bernoulli given the predictors. You check linearity-in-logit with grouped or smoothed residual plots and watch for separation (a predictor that perfectly splits pass from fail), influential points, and sparse cells. None of those flags trip here.
The computation. Fit the model and read the coefficients on the log-odds scale, then exponentiate. The static R below shows the idiom; it is teaching code and is not executed on this site.
set.seed(35203)

# Dataset R: n = 120 students. pass = (final >= 70); program reference = "None".
# Synthetic; seed set. Predictors: hours (0-20), pretest (0-100), program {None, Drop-in, Structured}.
fit <- glm(pass ~ hours + pretest + program,
           data = students, family = binomial)

summary(fit)
# Coefficients (log-odds scale):
#   (Intercept)         b0
#   hours             0.22
#   pretest           0.04
#   programDrop-in    0.60
#   programStructured 1.00

# Exponentiate the coefficients to ODDS RATIOS:
exp(coef(fit))
#   hours             ~ 1.25   # each extra study-hour multiplies pass-odds by ~1.25
#   programDrop-in    ~ 1.82   # e^0.6
#   programStructured ~ 2.72   # adjusted OR Structured vs None (raw table OR was ~3.67)

# Predicted PROBABILITIES for two specific student profiles:
newdata <- data.frame(
  hours   = c(16,  3),                 # high-effort vs low-effort
  pretest = c(80, 50),
  program = c("Structured", "None")
)
predict(fit, newdata, type = "response")
#   1 -> ~ 0.56   high-effort Structured student
#   2 -> ~ 0.05   low-effort None student
The estimate with its uncertainty. Report the odds ratios with confidence intervals, never the bare coefficients and never a lone p-value: \(\mathrm{OR}_{\text{hour}} \approx 1.25\) (each extra study-hour multiplies the odds of passing by about \(1.25\), holding pretest and program fixed) and \(\mathrm{OR}_{\text{Structured vs None}} \approx 2.72\) (a Structured student has about \(2.72\) times the odds of an otherwise-identical None student). In a real fit you would attach exp(confint(fit)) intervals around each odds ratio; that interval, not the p-value, is the honest summary. Then translate to probability for two concrete students. A high-effort Structured student (\(16\) hours, pretest \(80\)) has predicted probability \(\hat p \approx 0.56\); a low-effort None student (\(3\) hours, pretest \(50\)) has \(\hat p
\approx 0.05\). Those two probabilities — far apart, and both safely inside \((0, 1)\) — are the conclusion a reader can actually use, far more than the raw logit ever could be.
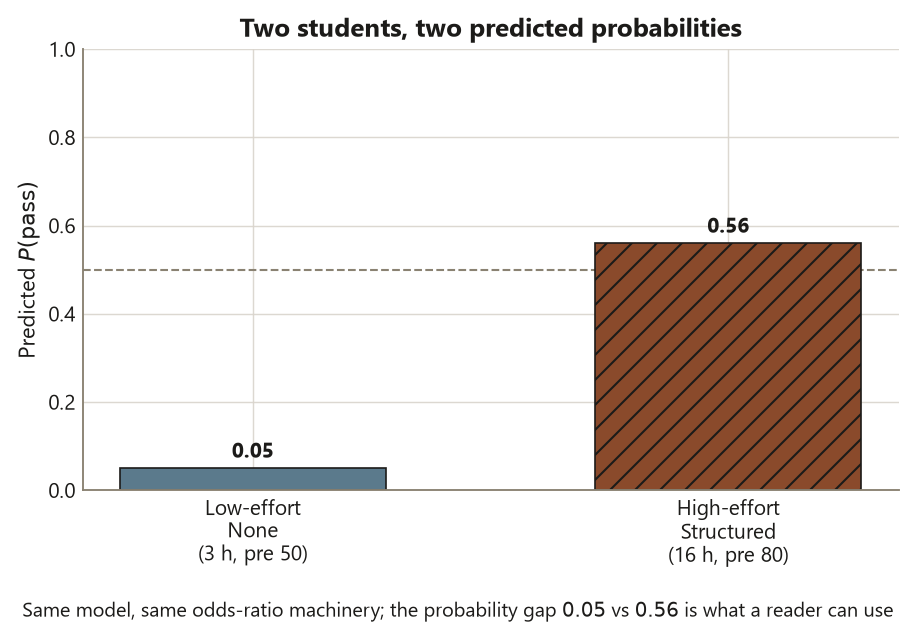
The interpretation and what it cannot support. The model says effort and program both move the odds of passing in the expected direction, and the predicted-probability gap (\(0.56\) vs \(0.05\)) makes the combined effect vivid. But name the limits. The adjusted Structured odds ratio of \(2.72\) is smaller than the raw \(3.67\) from week 12 — confounding by hours and pretest, the same \(1.6 \to 1.1\) shrinkage story in new clothes. The odds ratio is not a relative risk (passing is common, so the relative risk is much nearer \(1\)). And because students chose their programs, the model buys an adjusted association, not a causal claim: it cannot tell you that enrolling a None student in the Structured program would raise their odds by \(2.72\).
Worked example — loan default on income and credit score (transfer, new context)
The question. For a consumer-lending portfolio, does the probability that a borrower defaults (yes/no) on a small loan depend on their income and their credit score — and how would you report it? This is a binary-outcome prediction question in a brand-new context. The numbers below are illustrative and clearly distinct from Dataset R; data are synthetic; seed set.
The structure. The unit is the borrower; the response is default (binary, \(1 =\) defaulted); the predictors are income (in \(\$10\text{k}\) units) and credit score (per \(50\)-point increment). The design is observational. Suppose the fitted model is
\[ \operatorname{logit}(\hat p_{\text{default}}) = 1.20 - 0.40\cdot\text{income}_{10k} - 0.50\cdot\text{score}_{50} . \]
The computation and the estimates. Exponentiate each coefficient to an odds ratio:
\[ \mathrm{OR}_{\text{income}} = e^{-0.40} \approx 0.67, \qquad \mathrm{OR}_{\text{score}} = e^{-0.50} \approx 0.61 . \]
Read the income one: holding credit score fixed, each extra \(\$10\text{k}\) of income multiplies the odds of default by about \(0.67\) — a \(33\%\) reduction in the odds, because the coefficient is negative and the odds ratio is below \(1\). Now a predicted probability. For a borrower with income \(5\) (i.e. \(\$50\text{k}\)) and score \(12\) (i.e. a \(600\)-point score in \(50\)-point units), the linear predictor is
\[ \hat\eta = 1.20 - 0.40(5) - 0.50(12) = 1.20 - 2.0 - 6.0 = -6.8 , \qquad \hat p = \frac{1}{1 + e^{6.8}} \approx 0.001 . \]
set.seed(35203)

# Lending portfolio: default = (borrower defaulted, 1/0). Synthetic; illustrative.
fit_default <- glm(default ~ income10k + score50,
                   data = loans, family = binomial)

exp(coef(fit_default))
#   income10k ~ 0.67   # each +$10k income -> ~33% lower odds of default
#   score50   ~ 0.61   # each +50 credit points -> ~39% lower odds of default

predict(fit_default,
        data.frame(income10k = 5, score50 = 12),
        type = "response")
#   -> ~ 0.001   a comfortable borrower's predicted default probability
The interpretation. The design move is identical to Dataset R — model the log-odds linearly, exponentiate coefficients to odds ratios, and run a specific profile through the inverse logit for a predicted probability — only the context and the numbers changed. An income odds ratio of \(0.67\) says higher income is associated with lower default odds; the predicted probability of about \(0.001\) says this particular borrower is very unlikely to default. And the same two cautions transfer: \(0.67\) is an odds ratio, not a relative risk (and default is rare here, so the two are actually close — the mirror image of the common-outcome warning), and because the portfolio data are observational, the model describes association, not a causal effect of raising someone’s income. Same engine, new road.
A common mistake
This week’s classic applied-methods error is mis-reading the log-odds scale, and it shows up in three recurring flavors — all of which the worked examples were built to prevent.
The first flavor is interpreting a logit coefficient as a probability or as a linear effect on probability. A student reads “\(0.22\) for hours” and writes “each hour raises the chance of passing by \(0.22\),” or reads “\(1.0\) for Structured” and concludes Structured students pass with probability near \(1\). Both are wrong because the coefficient lives on the log-odds scale. The honest readings are: exponentiate (\(e^{0.22} \approx 1.25\)) to talk about a multiplicative change in odds, or run the linear predictor through the S-curve to talk about a probability at a specific profile. You can never assign a single fixed probability change to a predictor, because the same odds ratio moves probability a lot in the steep middle of the curve and almost nothing near \(0\) or \(1\).
The second flavor is reporting the odds ratio as if it were a relative risk. Someone reads “\(\mathrm{OR} \approx 2.72\)” and writes “Structured students are \(2.72\) times as likely to pass.” That sentence describes a relative risk, not an odds ratio, and the two diverge whenever the outcome is common — which passing is, at \(60\%\) overall. Week 12 already showed the gap: the raw relative risk was about \(1.67\) while the raw odds ratio was \(3.67\). Quote the odds ratio as an odds ratio (“about \(2.72\) times the odds”), and if your audience really needs a risk statement, compute predicted probabilities and report their difference or ratio directly.
The third flavor is drawing a causal conclusion from the observational model. The adjusted odds ratio of \(2.72\) is genuinely informative — it survived controlling for hours and pretest — and that survival tempts a causal sentence like “the Structured program makes students \(2.72\) times more likely to pass.” But adjustment is not randomization. Students chose their programs; unmeasured differences (motivation, schedule, prior coursework) remain; the model compares look-alike students on the variables you measured, not identical students on everything. So the warranted sentence is “associated with about \(2.72\) times the odds, adjusting for hours and pretest,” and the unwarranted one swaps in “causes” or “makes.” Keep statistical significance, practical significance, and causation in three separate boxes — the same discipline you have carried since week 3.
Low-stakes self-checks (ungraded)
These are for your own practice — ungraded, no submission.
- In one sentence, explain why you would not fit
lm(pass ~ hours)to a \(0/1\) outcome, naming both things that go wrong (the unbounded fit and the constant-effect assumption). - The hours coefficient is \(0.22\) on the log-odds scale. Convert it to an odds ratio and write one sentence interpreting that odds ratio that uses the word odds and does not use the word probability.
- The Structured coefficient is \(1.0\), so the adjusted odds ratio is about \(2.72\), while the week-12 raw table gave about \(3.67\). Explain in two sentences why the adjusted number is smaller, naming the confounders and connecting it to the regression \(1.6 \to 1.1\) story.
- A classmate writes “the odds ratio of \(2.72\) means Structured students pass \(2.72\) times as often as None students.” Name the error and say in one sentence why it overstates the effect when passing is common.
- Two students have predicted pass probabilities of \(0.56\) and \(0.05\). Explain why one more study-hour would change the first student’s probability more than the second’s, even though it multiplies both students’ odds by the same \(1.25\).
- Write the one sentence you would actually put in a report about the Structured odds ratio — including its adjusted status and the association-not-causation caveat — given that students self-selected into programs.
Reading and source pointer
This week is grounded in the instructor notes (the primary course materials) for the logistic-regression workflow and the odds / odds-ratio / predicted-probability interpretation, with the IMS (Çetinkaya-Rundel & Hardin) treatment of logistic regression for the concept sequence — modeling a binary outcome on the log-odds scale and reading exponentiated coefficients — and the ModernDive (Ismay, Kim & Valdivia) material on generalized linear models in R for the glm(..., family = binomial) fitting and reporting workflow shown in the static code. These notes are the course’s own synthesis, grounded in but not copied from the sources. No prose, examples, exercises, figures, or solutions are reproduced from any source.
Public vs. graded
These notes, the examples, and the practice here are public and ungraded — study material only. No graded prompts, answer keys, rubrics, point values, or due dates appear on this site. Graded applied-methods checkpoints, weekly quizzes, homework and analysis memos, applied analysis labs, the midterm, the applied methods project, and the final exam live in Blackboard (the LMS), which is authoritative for due dates, submissions, and grades. If this page and Blackboard ever disagree, follow Blackboard.
Looking ahead
Next week we stop adding new methods and put the whole blueprint to work end-to-end in an applied analysis report workshop: take one dataset from question through structure, method, assumptions, an estimate with its uncertainty, diagnostics, and an honestly-bounded conclusion, and write the report. Logistic regression’s discipline — translate off the log-odds scale, report the odds ratio with its interval, show a predicted probability, and keep association distinct from causation — is exactly the kind of careful reporting that workshop is built to practice, so come in having internalized the logistic translation moves and ready to apply the full blueprint to a single dataset from question to bounded conclusion.
See also
- Week 12 — Categorical outcomes & contingency tables — the pass × program table, the chi-square, and the raw \(3.67\) odds ratio this week adjusts.
- Week 10 — Simple & multiple regression review — the \(1.6 \to 1.1\) adjustment story that the \(3.67 \to 2.72\) shrinkage mirrors.
- Lab 13 — Logistic regression and odds ratios — fit the model, exponentiate coefficients, and compute predicted probabilities in R.
- Reporting and interpretation guide — odds ratios, predicted probabilities, OR vs RR, and association vs causation in applied reporting.
- Method chooser — the question → structure → method decision guide that routes a binary outcome to logistic regression.