Week 10 — Simple & multiple regression review
Lines as applied tools: relationship, prediction, and adjustment
The week question
For nine weeks you have compared groups — two means, four format means, a \(2\times 2\) table of cell means. This week the explanatory variable stops being a label and becomes a number. In Dataset R you have \(120\) students with their weekly study hours, their attendance, a pretest score, and their final exam score, and the question is no longer “which group is higher?” but “how does final score move with study hours, and by how much?” A line answers that, and the slope of the line is the answer.
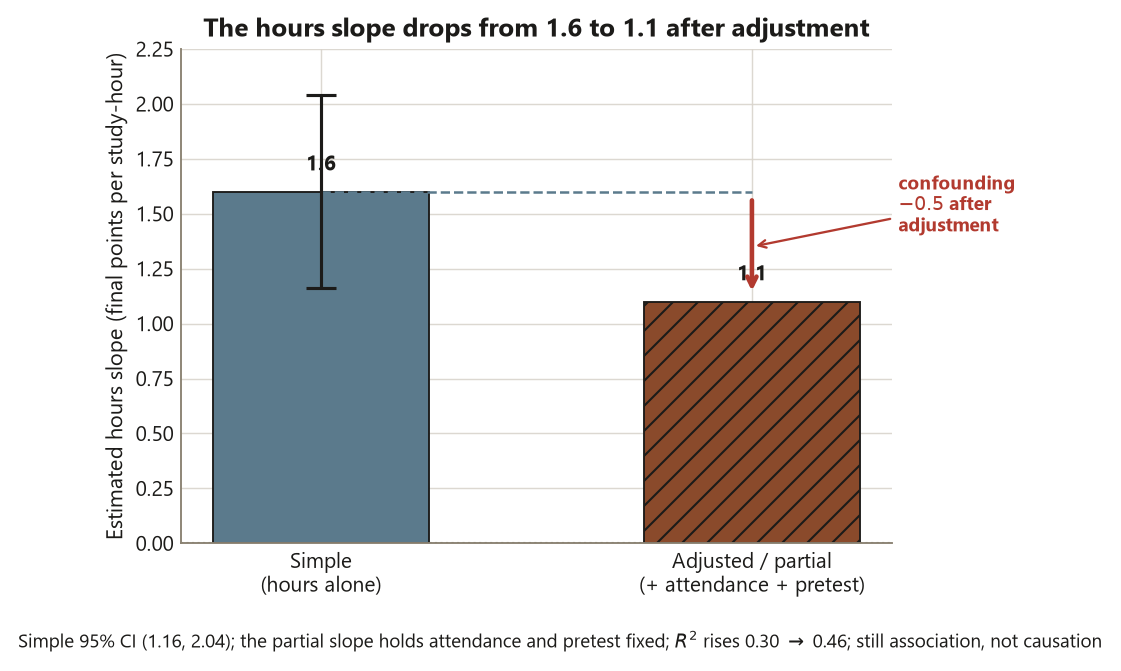
But the week’s real question is sharper than fitting one line. You will fit two. First a simple regression of final on study hours alone, which tells you how final and hours move together in the raw data. Then a multiple regression that adds attendance and pretest, which tells you how final moves with hours once attendance and pretest are held fixed. Those two slopes will not be the same — the hours slope drops from \(1.6\) to \(1.1\) — and the gap between them is the lesson. The week’s question is: what does a regression slope estimate, how do you report it with its uncertainty, and why does that estimate change when you adjust for other variables? Answering it well is the bridge from “comparing groups” to next week’s ANCOVA, where the same adjustment logic is applied to a group comparison.
Why this matters
Regression is the workhorse of applied statistics because it does three jobs at once, and confusing them is the most common way to misread it. It describes a relationship (how does final move with hours?), it can be used for prediction (what final would I expect for a student who studies \(10\) hours?), and — when you add more variables — it performs adjustment (what is the hours effect after accounting for attendance and pretest?). The same lm() call serves all three, which is convenient and dangerous: the convenience hides the fact that a slope means different things depending on what else is in the model.
It matters most because of confounding. In the raw data, students who study more also tend to attend more and to have started with a higher pretest. So the simple slope of \(1.6\) points per hour is not “the effect of an hour of study” — it bundles in the fact that heavy studiers differ in other ways too. The multiple-regression slope of \(1.1\) tries to strip those bundled differences out: it asks how final moves with hours among students who have the same attendance and the same pretest. That drop from \(1.6\) to \(1.1\) is a confounding story told in numbers, and learning to read it is the heart of the blueprint’s step six — separating what the data show (an association) from what you wish they showed (a clean causal effect). This is observational data; it buys association, not causation, and the slope, however carefully adjusted, does not change that. What adjustment buys is a better-described association, not a license to say “caused.”
And it matters because regression is where the discipline “report the estimate with its uncertainty, not just a verdict” is most concrete. A slope is an estimate; it comes with a standard error and a confidence interval; the interval is the honest summary, not the lone \(p < 0.001\). The whole week is an exercise in reporting a slope the right way.
Learning goals
By the end of this week you should be able to:
- Fit and interpret a simple regression slope and intercept in context — for Dataset R, \(\widehat{\text{final}} = 55 + 1.6\cdot\text{hours}\), reading the \(1.6\) as “each extra study-hour per week is associated with about \(1.6\) more final points, on average.”
- Read \(R^2\) as the fraction of response variance the model explains — here \(R^2 \approx 0.30\), so study hours alone account for about \(30\%\) of the variation in final score — without over-trusting it as a measure of a good or causal model.
- Do inference on a slope: report its standard error, its \(t\) statistic, and — the headline — its 95% confidence interval, \((1.16, 2.04)\) for the Dataset R hours slope, rather than a bare \(p\)-value.
- Fit a multiple regression and interpret a partial (adjusted) slope as “holding the other predictors fixed,” and explain why the hours slope drops from \(1.6\) to \(1.1\) when attendance and pretest enter the model — a confounding-and-adjustment story.
- Run the basic diagnostics — residual plots, leverage and influence, and multicollinearity via the VIF (\(\approx 1.3\) for hours and attendance here) — and distinguish prediction from explanation, including the danger of extrapolating beyond the observed range.
Core vocabulary
- Response and explanatory variable — the response \(Y\) (here
final) is what you model; an explanatory variable \(X\) (herehours, plusattendanceandpretest) is what you model it on. In a simple regression there is one \(X\); in a multiple regression there are several. - Fitted line / fitted model — \(\widehat{Y} = b_0 + b_1 X_1 + \dots\), the equation least squares chooses to make the residuals small. \(\widehat{Y}\) is the model’s predicted value; the hat marks it as an estimate, not a data point.
- Intercept (\(b_0\)) — the fitted value when every \(X = 0\). Interpret it only if “all \(X = 0\)” is a meaningful, in-range scenario; often it is just where the line crosses the axis.
- Slope (\(b_1\)) — the estimated change in \(\widehat{Y}\) per one-unit change in \(X\). In a simple model it is the marginal slope; in a multiple model it is the partial (adjusted) slope, “per unit of \(X\), holding the other predictors fixed.”
- \(R^2\) (coefficient of determination) — the fraction of the response’s variance the model explains, between \(0\) and \(1\). A bigger \(R^2\) means the line tracks the cloud more tightly; it does not mean the model is correct, useful, or causal.
- Standard error of a slope — the estimated standard deviation of the slope estimate across hypothetical repeated samples; it sets the width of the slope’s confidence interval and the size of its \(t\) statistic.
- Confidence interval for a slope — a range of plausible values for the true slope, e.g. \((1.16, 2.04)\) points per hour; the estimate with its uncertainty, and the thing you report instead of a bare \(p\)-value.
- Partial slope / adjustment — the slope of one predictor in a multiple model, interpreted with the other predictors held fixed; the mechanism by which regression “controls for” confounders.
- Residual — the gap \(Y - \widehat{Y}\) between an observed response and its fitted value; residual patterns are the raw material of diagnostics.
- Leverage and influence — leverage measures how unusual a point’s \(X\) values are; an influential point is one whose presence noticeably moves the fitted line. A high-leverage point deserves investigation, not automatic deletion.
- Multicollinearity / VIF — predictors that are correlated with each other inflate the standard errors of their slopes; the variance inflation factor quantifies it. A VIF near \(1\) is fine; large VIFs make individual slopes unstable.
- Extrapolation — using the fitted line to predict outside the range of the observed \(X\) values, where the linear pattern has no evidence to stand on.
Concept development
Simple regression: a slope, an intercept, and the variance it explains
Walk the blueprint. The question is “how does final score move with study hours?” — a relationship/prediction question, not a group comparison. The structure: the unit is a student; the response final is quantitative; the explanatory variable hours is quantitative; the design is observational (nobody assigned study hours). That structure — one quantitative response, one quantitative explanatory variable — is exactly what simple linear regression is for, so it is the method.
Least squares fits the line that minimizes the sum of squared residuals. For Dataset R the fitted line is
\[ \widehat{\text{final}} = 55 + 1.6\cdot\text{hours}. \]
Read the two coefficients in context. The slope \(b_1 = 1.6\) says that each additional study-hour per week is associated with about \(1.6\) more final points, on average — that is the estimate, and the words “on average” and “associated with” are doing honest work, because this is observational. The intercept \(b_0 = 55\) is the fitted final score at hours = 0; here a student who studies zero hours is near the edge of but inside the observed range, so \(55\) is a plausible-to-borderline reading rather than a wild extrapolation — flag it as such.
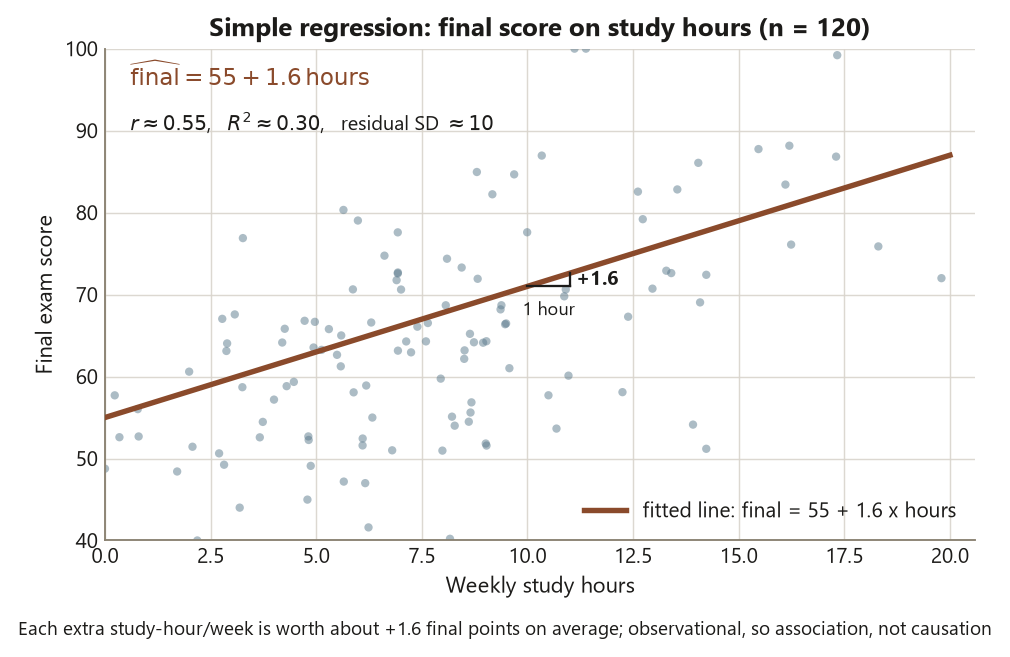
How well does the line track the cloud? The correlation is \(r \approx 0.55\), and \(R^2 = r^2 \approx 0.30\). Read \(R^2\) as variance explained: study hours alone account for about \(30\%\) of the variation in final scores, leaving \(70\%\) to everything else — attendance, prior preparation, test-day luck. That is a real but partial relationship. Resist two temptations: \(R^2 = 0.30\) is not small enough to dismiss the relationship, and it is not large enough to call the model “good” or to forget the other \(70\%\). The residual SD is about \(10\) points, which is the typical size of a prediction miss — a more useful “how good” number than \(R^2\) for a student asking “how far off will my predicted final be?”
Now the inference, which is where the week’s discipline lives. The slope is an estimate from one sample of \(120\) students, so it has a standard error: \(\mathrm{SE}(b_1) \approx 0.22\) points per hour. The \(t\) statistic for “is the slope zero?” is
\[ t = \frac{b_1}{\mathrm{SE}(b_1)} = \frac{1.6}{0.22} \approx 7.3, \]
on \(118\) degrees of freedom, with \(p < 0.001\). But the headline is not the \(p\)-value — it is the 95% confidence interval for the slope,
\[ 1.6 \pm t_{118,.975}\,(0.22) \approx 1.6 \pm 0.44 = (1.16, 2.04). \]
Report it that way: “each extra study-hour per week is associated with about \(1.6\) more final points (95% CI \(1.16\) to \(2.04\)).” The interval excludes zero, so the relationship is statistically significant; but more usefully, it tells a reader the slope is plausibly anywhere from about \(1.2\) to about \(2.0\) — a band of estimates, the estimate with its uncertainty. That sentence is the blueprint’s step five done right.
Multiple regression and partial (adjusted) slopes: a confounding story
The simple slope bundles a problem. Students who study more also tend to attend more and to have arrived with a higher pretest — the explanatory variables travel together. So the \(1.6\) is not “the effect of an extra study hour”; it is “the difference in final score between students who study an extra hour, who also differ in attendance and pretest because heavy studiers tend to.” To separate study hours from its travelling companions, you put them all in one model.
The multiple regression for Dataset R is
\[ \widehat{\text{final}} = 30 + 1.1\cdot\text{hours} + 0.25\cdot\text{attendance} + 0.30\cdot\text{pretest}, \]
with \(R^2 \approx 0.46\). Two things changed, and both are the lesson. First, \(R^2\) rose from \(0.30\) to \(0.46\): adding attendance and pretest explains more of the variation in final, as you would expect from relevant predictors. Second — and this is the headline — the hours slope dropped from \(1.6\) to \(1.1\).
Read that drop carefully, because it is the confounding-and-adjustment story in one number. The partial slope \(1.1\) is interpreted “each extra study-hour per week is associated with about \(1.1\) more final points, holding attendance and pretest fixed.” Compare two students with the same attendance and the same pretest who differ by one study-hour: the model expects about \(1.1\) points between them, not \(1.6\). The extra \(0.5\) points in the simple slope was never really about study hours — it was attendance and pretest riding along, because heavy studiers also attend more and started higher. Adjustment removed that ride-along. The simple slope answers “how do final and hours move together in the world as it is?”; the partial slope answers “how do final and hours move together among students otherwise alike in attendance and pretest?” Both are legitimate estimates of different things; the error is to read one as if it were the other.
This is the same adjustment idea you will meet next week as ANCOVA, where the thing being adjusted is a set of group means rather than a slope, and the covariate is a baseline pretest. Hold that parallel: multiple regression adjusts a slope for covariates; ANCOVA adjusts group means for a covariate. Same machinery, different question. And note the throughline: even after adjustment, this is observational data. The partial slope is a better-described association, not a demonstrated cause. Unmeasured confounders — motivation, prior math background — could still be riding along inside the \(1.1\).
Diagnostics: residuals, leverage, multicollinearity, and the limits of prediction
A fitted line is only as trustworthy as its assumptions, and regression makes four you should check: the relationship is roughly linear, the residuals are roughly constant in spread (homoscedastic), the residuals are roughly normal, and the observations are independent. You check the first three by looking at residuals, not by staring at the line.
For Dataset R the residuals are roughly normal with mild heteroscedasticity — the spread of residuals grows a little for higher fitted values, which is common and usually tolerable, but worth a note in the report. A residuals-vs-fitted plot should show a shapeless band around zero; a curved band would signal a missing nonlinear term, and a fanning band signals the mild heteroscedasticity you see here.
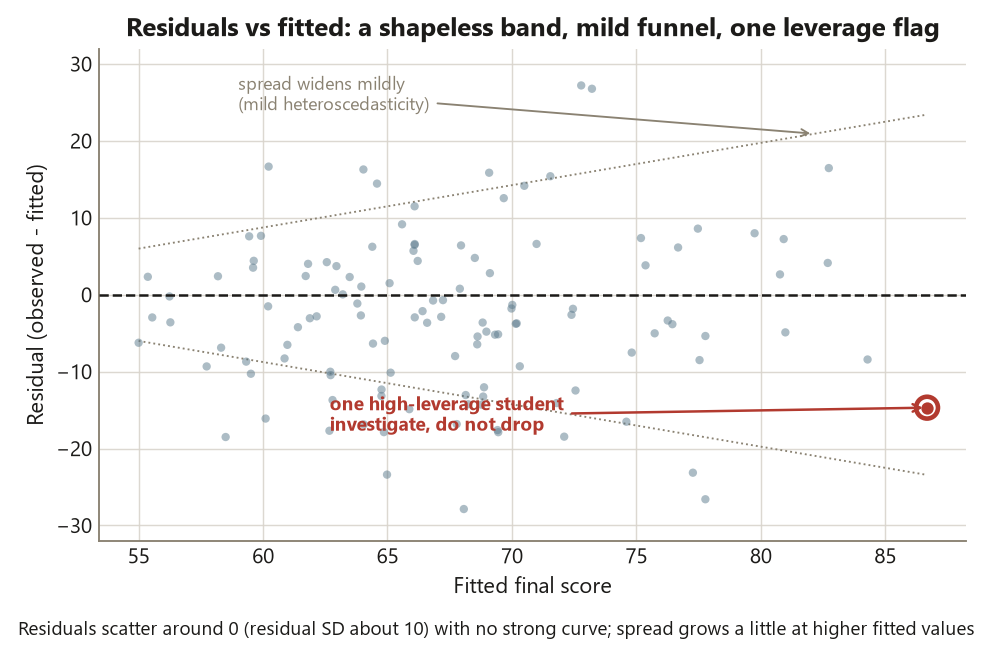
Two more diagnostics matter once you have several predictors. Leverage and influence: there is one high-leverage student in Dataset R — someone with an unusual combination of hours, attendance, and pretest. High leverage means the point could move the line a lot; whether it does is influence. The discipline is to investigate, not auto-delete: check whether it is a data-entry error or a real, informative student. Deleting an inconvenient point to tidy the fit is one of the classic ways to lie with regression. Multicollinearity: hours and attendance are correlated, \(r \approx 0.45\), which inflates the standard errors of their slopes. The variance inflation factor quantifies it; here \(\mathrm{VIF} \approx 1.3\), which is small — the predictors are correlated enough to notice but not enough to destabilize the individual slopes. (A rough rule of thumb flags VIFs above \(5\)–\(10\).) So you can interpret the hours and attendance slopes separately with confidence; if the VIF were large, you could not.
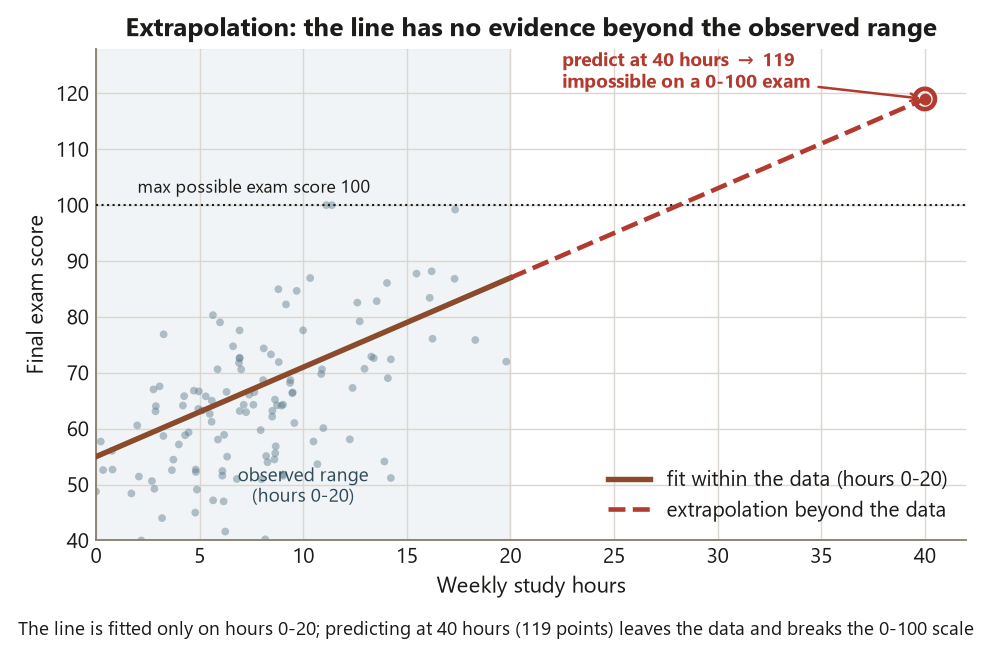
Finally, separate prediction from explanation, and beware extrapolation. The model predicts well within the observed range of \(0\)–\(20\) study hours; it says nothing trustworthy about a student studying \(40\) hours, because there is no data out there to anchor the line. Predicting at hours = 40 is extrapolation — the linear pattern is an assumption beyond the data, not a finding. And a model built for prediction (squeeze out the best \(\widehat{\text{final}}\)) is judged differently from one built for explanation (interpret the slopes): the same lm(), two different jobs, two different standards.
Worked examples
Worked example — Dataset R: the simple model, then the adjustment (recurring slice)
The question and structure. How does final score move with study hours, and does that relationship survive adjustment for attendance and pretest? The unit is a student (\(n = 120\)); the response final is quantitative; the explanatory variables are quantitative; the design is observational. Data are synthetic; seed set (set.seed(35203)).
The assumptions. Roughly linear relationship, residuals roughly constant in spread and roughly normal, independent students. Checked below via residual plots and VIF; one high-leverage point flagged for investigation, not deletion.
The computation. Fit the simple model, read the slope with its interval, then fit the multiple model and watch the hours slope move. The static R below shows the idiom; it is teaching code and is not executed here.
set.seed(35203)

# Dataset R: n = 120 students. Synthetic.
# study hours (0-20, mean ~8), attendance (%, mean ~85), pretest (0-100, mean ~62),
# final score, pass = (final >= 70).

# --- Simple regression: final on study hours alone -------------------------
fit_simple <- lm(final ~ hours, data = R)
summary(fit_simple)
#   (Intercept)   55.0
#   hours          1.6     SE 0.22   t 7.3   p < 0.001
#   Multiple R-squared: 0.30   (r ~ 0.55)   residual SD ~ 10

confint(fit_simple)
#   hours  2.5 %  1.16   97.5 %  2.04        # the 95% CI for the slope

# --- Multiple regression: adjust for attendance and pretest ----------------
fit_multi <- lm(final ~ hours + attendance + pretest, data = R)
summary(fit_multi)
#   (Intercept)   30.0
#   hours          1.1                       # <-- dropped from 1.6 after adjustment
#   attendance     0.25
#   pretest        0.30
#   Multiple R-squared: 0.46

# --- Diagnostics ------------------------------------------------------------
plot(fit_multi, which = 1)                   # residuals vs fitted: mild heteroscedasticity
plot(fit_multi, which = 5)                   # leverage: one high-leverage student to investigate
car::vif(fit_multi)
#   hours attendance pretest
#   ~1.3      ~1.3     ~1.1                   # hours-attendance r ~ 0.45; VIF small, slopes stable

# Key numbers:
#   simple  slope 1.6  (95% CI 1.16, 2.04)  R^2 ~ 0.30
#   multiple hours slope 1.1                 R^2 ~ 0.46
The estimate with its uncertainty. The simple model estimates a slope of \(1.6\) final points per study-hour, 95% CI \((1.16, 2.04)\), with \(R^2 \approx 0.30\). The multiple model estimates a partial hours slope of \(1.1\) (holding attendance and pretest fixed), with \(R^2 \approx 0.46\).
The interpretation. Report the simple result as “each extra study-hour per week is associated with about \(1.6\) more final points (95% CI \(1.16\) to \(2.04\)); study hours alone explain about \(30\%\) of the variation in final score.” Then narrate the adjustment: when you hold attendance and pretest fixed, the hours slope falls to \(1.1\) — about a third of the apparent hours effect was actually attendance and pretest riding along, because heavier studiers also attend more and start higher. That is confounding controlled by adjustment. On the blueprint’s last step: the relationship is statistically significant (the interval excludes zero) and practically meaningful (an extra hour buys roughly a point), but it is association, not causation — students chose their study hours, and unmeasured traits like motivation could still sit inside the \(1.1\). The one high-leverage student is investigated, not dropped, and the small VIF means the hours and attendance slopes can be read separately.
Worked example — house price on size, then adjusting for neighborhood (transfer, new context)
The question and structure. A realtor asks how a home’s sale price moves with its size (square feet), and whether that relationship holds up after accounting for neighborhood. The unit is a house; the response price (in thousands of dollars) is quantitative; size is quantitative; neighborhood is a grouping covariate. Observational data. These numbers are illustrative and distinct from Dataset R.
The assumptions. Roughly linear price–size relationship, residuals roughly constant in spread and roughly normal, independent homes. In practice price residuals often fan out for large homes — a heteroscedasticity flag to check.
The computation. Fit the simple model, then add the neighborhood covariate and watch the size slope shrink.
set.seed(35203)

# Illustrative housing data (NOT Dataset R). price in $1000s, size in sq ft (/100).
# --- Simple: price on size --------------------------------------------------
fit_size <- lm(price ~ size, data = homes)
summary(fit_size)
#   (Intercept)  120
#   size          15        # +$15k per +100 sq ft, marginally
#   Multiple R-squared: 0.55

confint(fit_size)
#   size  2.5 %  12   97.5 %  18           # 95% CI for the marginal size slope

# --- Multiple: adjust for neighborhood -------------------------------------
fit_adj <- lm(price ~ size + neighborhood, data = homes)
summary(fit_adj)
#   size          9         # <-- shrank from 15 after adjusting for neighborhood
#   Multiple R-squared: 0.71

# Key numbers (illustrative):
#   simple size slope 15 (95% CI 12, 18)  R^2 ~ 0.55
#   adjusted size slope 9                 R^2 ~ 0.71
The estimate with its uncertainty. The simple model estimates a marginal size slope of about \(\$15\)k per \(100\) square feet (95% CI \(\$12\)k to \(\$18\)k); after adjusting for neighborhood, the partial size slope shrinks to about \(\$9\)k per \(100\) square feet, while \(R^2\) rises from \(0.55\) to \(0.71\).
The interpretation. The design move is identical to Dataset R — fit the marginal slope, then add a covariate and watch the slope of interest shrink — and only the context and the numbers changed. Bigger homes sell for more partly because they are bigger and partly because bigger homes cluster in pricier neighborhoods; the simple \(\$15\)k slope bundles both, and adjusting for neighborhood strips out the neighborhood ride-along, leaving a partial \(\$9\)k slope for “same neighborhood, more size.” Report the interval, not a bare \(p\)-value; read the partial slope as “holding neighborhood fixed”; and keep it association, not causation — this is observational, and you cannot conclude that adding square footage to a fixed house would raise its price by exactly \(\$9\)k. Same logic, new market.
A common mistake
This week’s classic applied-methods error comes in three closely related flavors, and all three turn a careful regression into an overclaim.
The first and most common is reading the simple slope as the partial slope, or vice versa. A reader sees “the hours slope is \(1.1\)” in the multiple model and reports it as “studying an extra hour raises final by \(1.1\) points” with no mention that it means “holding attendance and pretest fixed” — or sees the simple \(1.6\) and treats it as a clean hours effect when it is bundled with confounders. The two slopes answer different questions: the marginal slope (\(1.6\)) describes the world as it is, with heavy studiers also attending more and starting higher; the partial slope (\(1.1\)) describes a comparison among students otherwise alike. Always say which one you mean, and attach the “holding … fixed” phrase to every partial slope. The drop from \(1.6\) to \(1.1\) is not an error to be reconciled away — it is the finding.
The second flavor is extrapolating beyond the data and over-trusting \(R^2\). The Dataset R line is fitted on study hours from \(0\) to \(20\); using it to predict a student who studies \(40\) hours per week is extrapolation, and the line’s \(1.6\)-points-per-hour pattern has no evidence out there. Likewise, students sometimes treat \(R^2 \approx 0.30\) (or even \(0.46\)) as a verdict on whether the model is “good” or “true.” \(R^2\) measures variance explained, nothing more: a high \(R^2\) can come from a badly mis-specified model, and a modest \(R^2\) can describe a real, useful relationship. Report the residual SD (about \(10\) points here) alongside \(R^2\) so a reader knows the typical size of a prediction miss, and never predict outside the observed range without flagging it.
The third flavor is using causal language for an observational regression. Because regression “controls for” attendance and pretest, it is tempting to write “studying an extra hour causes \(1.1\) more final points, controlling for the others.” But adjustment only removes the confounders you measured and included; motivation, prior background, and a dozen unmeasured traits still ride along inside the partial slope. Observational data buy association, even after adjustment — a better-described association, but an association. Keep the three things distinct: statistical significance (the interval excludes zero), practical significance (a point per hour is meaningful), and causation (not licensed here). Write “is associated with, holding … fixed,” not “causes.”
Low-stakes self-checks (ungraded)
These are for your own practice — ungraded, no submission.
- Write the Dataset R simple model in words, including the units of the slope and a one-sentence reading of the intercept \(55\). Then state in one sentence what \(R^2 \approx 0.30\) means.
- The slope is \(1.6\) with 95% CI \((1.16, 2.04)\). Write one reporting sentence that leads with the estimate and its interval rather than the \(p\)-value, and explain in one sentence what the interval tells a reader that “\(p < 0.001\)” does not.
- The hours slope drops from \(1.6\) to \(1.1\) when attendance and pretest enter the model. Explain why, in terms of confounding, and write the correct one-sentence interpretation of the partial slope \(1.1\).
- A classmate predicts the final score for a student who studies \(40\) hours per week using the Dataset R line. Name what is wrong and what they should say instead.
- The VIF for hours is about \(1.3\). Say in one sentence what that number is measuring and why \(1.3\) is reassuring rather than alarming.
- There is one high-leverage student in Dataset R. State what high leverage means, and explain in one sentence why the right move is to investigate the point rather than delete it.
- Rewrite the sentence “studying an extra hour causes \(1.1\) more final points, controlling for attendance and pretest” so it is honest about what observational data and adjustment can and cannot support.
Reading and source pointer
This week is grounded in the instructor notes (the primary course materials) for the regression review and the simple-versus-partial-slope framing, with the IMS (Çetinkaya-Rundel & Hardin) treatment of linear regression and multiple regression for the concept sequence — fitting a line, reading \(R^2\), interpreting partial slopes, and checking diagnostics — and the ModernDive (Ismay, Kim & Valdivia) treatment of inference for regression for the R workflow and the slope’s standard error, \(t\) statistic, and confidence interval. These notes are the course’s own synthesis, grounded in but not copied from the sources. No prose, examples, exercises, figures, or solutions are reproduced from any source.
Public vs. graded
These notes, the examples, and the practice here are public and ungraded — study material only. No graded prompts, answer keys, rubrics, point values, or due dates appear on this site. Graded applied-methods checkpoints, weekly quizzes, homework and analysis memos, applied analysis labs, the midterm, the applied methods project, and the final exam live in Blackboard (the LMS), which is authoritative for due dates, submissions, and grades. If this page and Blackboard ever disagree, follow Blackboard.
Looking ahead
Next week ANCOVA makes the adjustment idea explicit for a group comparison. This week you adjusted a slope for covariates and watched it drop from \(1.6\) to \(1.1\); next week you adjust a set of format means for a baseline pretest covariate and watch the group gaps shrink — comparing the four instructional formats as if every group had started at the same baseline readiness. The machinery is the same regression adjustment you just learned; the question changes from “how does final move with hours?” to “do the formats differ once you hold the starting point fixed?” The throughline — confounding, adjustment, association-not-causation — carries straight through.
See also
- Week 9 — Two-way ANOVA and interaction — the last group-comparison week before the explanatory variable became a number.
- Week 11 — ANCOVA and adjustment — the same adjustment logic applied to comparing group means with a covariate held fixed.
- Week 13 — Logistic regression for binary outcomes — regression when the response is pass/fail rather than a score, where adjustment again shrinks an effect.
- Lab 10 — Building and checking a regression — the hands-on companion: fit, interpret, and diagnose the Dataset R models in R.
- Assumptions and diagnostics guide — residuals, leverage and influence, and multicollinearity in one place.