Week 15 — Applied methods synthesis & review
The whole blueprint, one picture, across the five datasets
The week question
You have spent a semester learning a dozen named analyses — the paired \(t\), the two-sample (Welch) \(t\), one-way ANOVA, Tukey HSD and planned contrasts, two-way ANOVA and interaction, simple and multiple regression, ANCOVA, chi-square, and logistic regression. The final week’s question is the one that ties them together: given a particular data structure and a particular question, which analysis does the structure call for, and what exactly does that analysis let you claim? This is not a new topic — it is the one picture the whole course was building toward. There is no new machinery here, only the discipline of choosing, estimating with uncertainty, and bounding the claim by the design. We walk the same six-step analysis blueprint one last time, across all five datasets of the Cypress Ridge world, with no new numbers — every figure below is one you already met.
Why this matters
A course that ends as a list of named tests has failed at its real job. The point of this course was never “memorize the Welch correction” or “know how to call aov().” It was to make one habit automatic: for every applied question, walk the analysis blueprint —
- Question — are you comparing, explaining, or predicting?
- Structure — the unit of analysis; the response versus the explanatory / grouping / covariate variables; the outcome type (quantitative, categorical, binary); the design (paired vs independent, one factor vs two, observational vs experimental).
- Method — the analysis that matches that structure, and why this one and not a neighbor.
- Assumptions & diagnostics — what the method assumes, and how you check it.
- Estimate & uncertainty — what the model estimates (a mean difference, an effect size, a slope, an odds ratio), reported with a confidence interval, not a bare p-value.
- Conclusion — statistical versus practical significance; association versus causation; what the analysis can and cannot support.
That matters because real data arrive shaped — paired, grouped, factorial, with a covariate, or with a categorical outcome — and the structure, not a memorized rule, is what should drive your method choice. Two disciplines run inside the blueprint and recur on every page of this course: report the estimate with its uncertainty, not just a verdict (an effect size and a confidence interval, never a lone p-value), and keep statistical significance, practical significance, and a causal claim distinct (observational data buy you association, not causation). The skill you are being asked to leave with is reading a structure and a question, naming the right analysis, stating what it estimates and how uncertain that estimate is, and saying out loud what the design will and will not let you conclude. If you can do that every time, you have the course.
Learning goals
By the end of this week you should be able to:
- Map a data structure to a method. Given a description (paired measurements, two independent groups, several groups, a two-factor design, a quantitative predictor, a group comparison with a covariate, a categorical outcome, a binary outcome), name the analysis the structure calls for and say why — by reading the structure, not by reaching for a remembered test name.
- Walk the six-step blueprint on any analysis in the course. For a chosen analysis, state the question, the structure, the method, the key assumption and its diagnostic, the estimate with its confidence interval, and the design-bounded conclusion.
- Report an estimate with its uncertainty, never a bare verdict. Pair every result with an effect size (Cohen’s \(d\), \(\eta^2\), \(R^2\), a risk difference, a relative risk, an odds ratio) and an interval, and say what the number means in the units of the question.
- Separate statistical, practical, and causal claims. Say why a small p-value is not a large effect, why a large effect is not a cause, and why the design (observational vs experimental) is what governs whether you may say “caused.”
- Read the structure-driven warnings. Read an interaction before the main effects; report odds ratios and predicted probabilities (not raw logits) for a binary outcome; recognize when adjustment for a covariate changes the estimate.
Core vocabulary
This week introduces no new terms; it consolidates the ones that recur. Hold the six blueprint steps and these organizing ideas in front of every method:
- The analysis blueprint — Question → Structure → Method → Assumptions & diagnostics → Estimate & uncertainty → Conclusion. The spine the whole course returns to.
- Structure vocabulary — the unit of analysis; the response \(Y\) versus the explanatory \(X\) / grouping factor / covariate; the outcome type (quantitative, categorical, binary); the design (paired vs independent; one factor vs two; observational vs experimental).
- Estimate with uncertainty — a point estimate (\(\bar d\), \(\bar x_1 - \bar x_2\), \(\hat\beta\), \(\widehat{\mathrm{OR}}\)), a standard error, a confidence interval, and an effect size (\(d\), \(\eta^2\), \(R^2\), risk difference, relative risk, odds ratio) — reported instead of, or alongside, a bare p-value.
- Statistical vs practical vs causal — a small \(p\) means “unlikely under the null,” not “big”; an effect size answers “how big”; and only the design answers “did it cause this.”
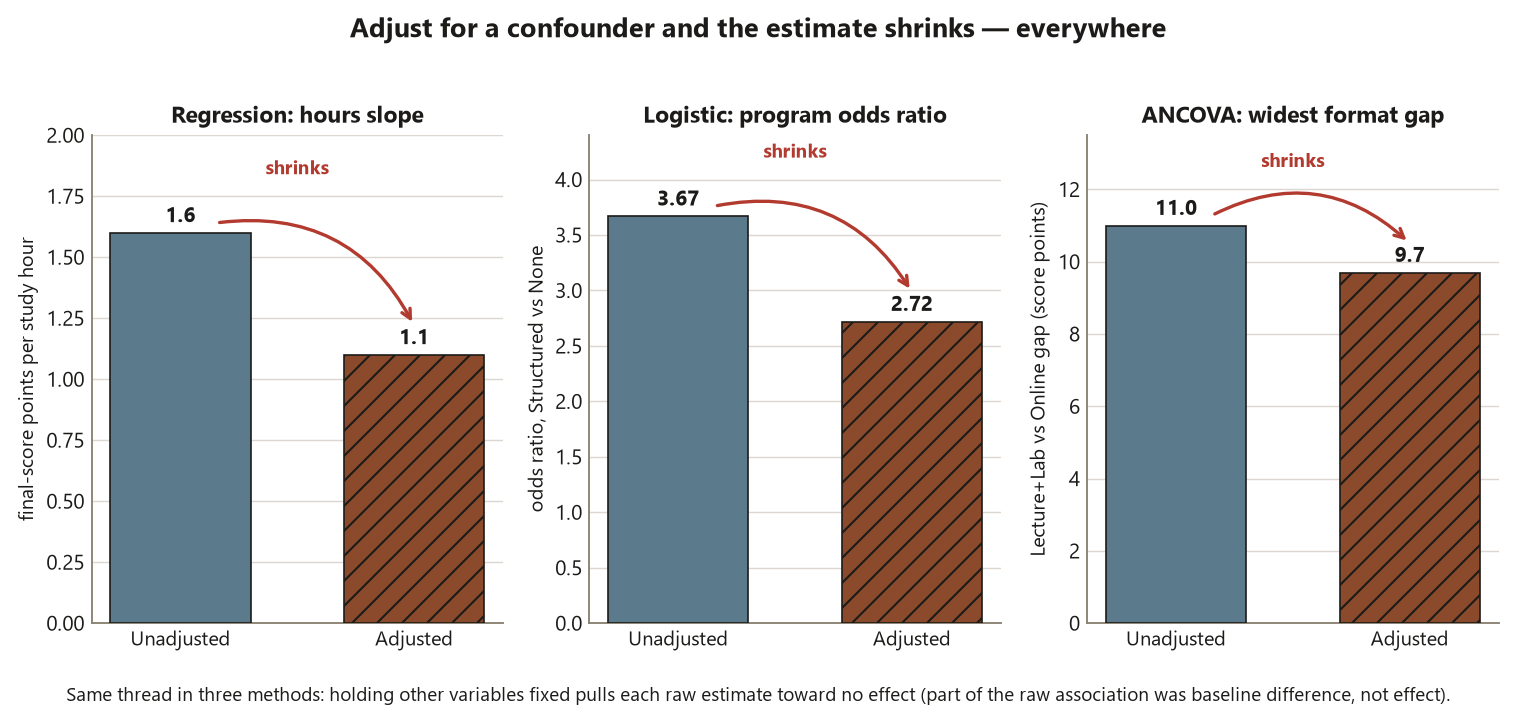
- Confounding → adjustment — a covariate or extra predictor can shift an estimate (the hours slope \(1.6 \to 1.1\); the program odds ratio \(3.67 \to 2.72\)), revealing that part of a raw association was baseline difference, not effect.
- Interaction — when an effect depends on the level of another factor; read it before the main effects, because the main effects are then conditional.
Concept development
The semester ran through one synthetic world — the Cypress Ridge College Student-Success Study — realized as five datasets of different structures, so each method was seen exactly where its structure called for it. The review is one pass over those structures. For each, the move is the same: name the structure, name the method the structure calls for, re-state the locked numeric instance you already saw, and say what the design lets you conclude. No new numbers appear in this review; every figure below is one you met earlier in the course. All data are synthetic; seed set (set.seed(35203)).
The blueprint as one through-line across the five datasets
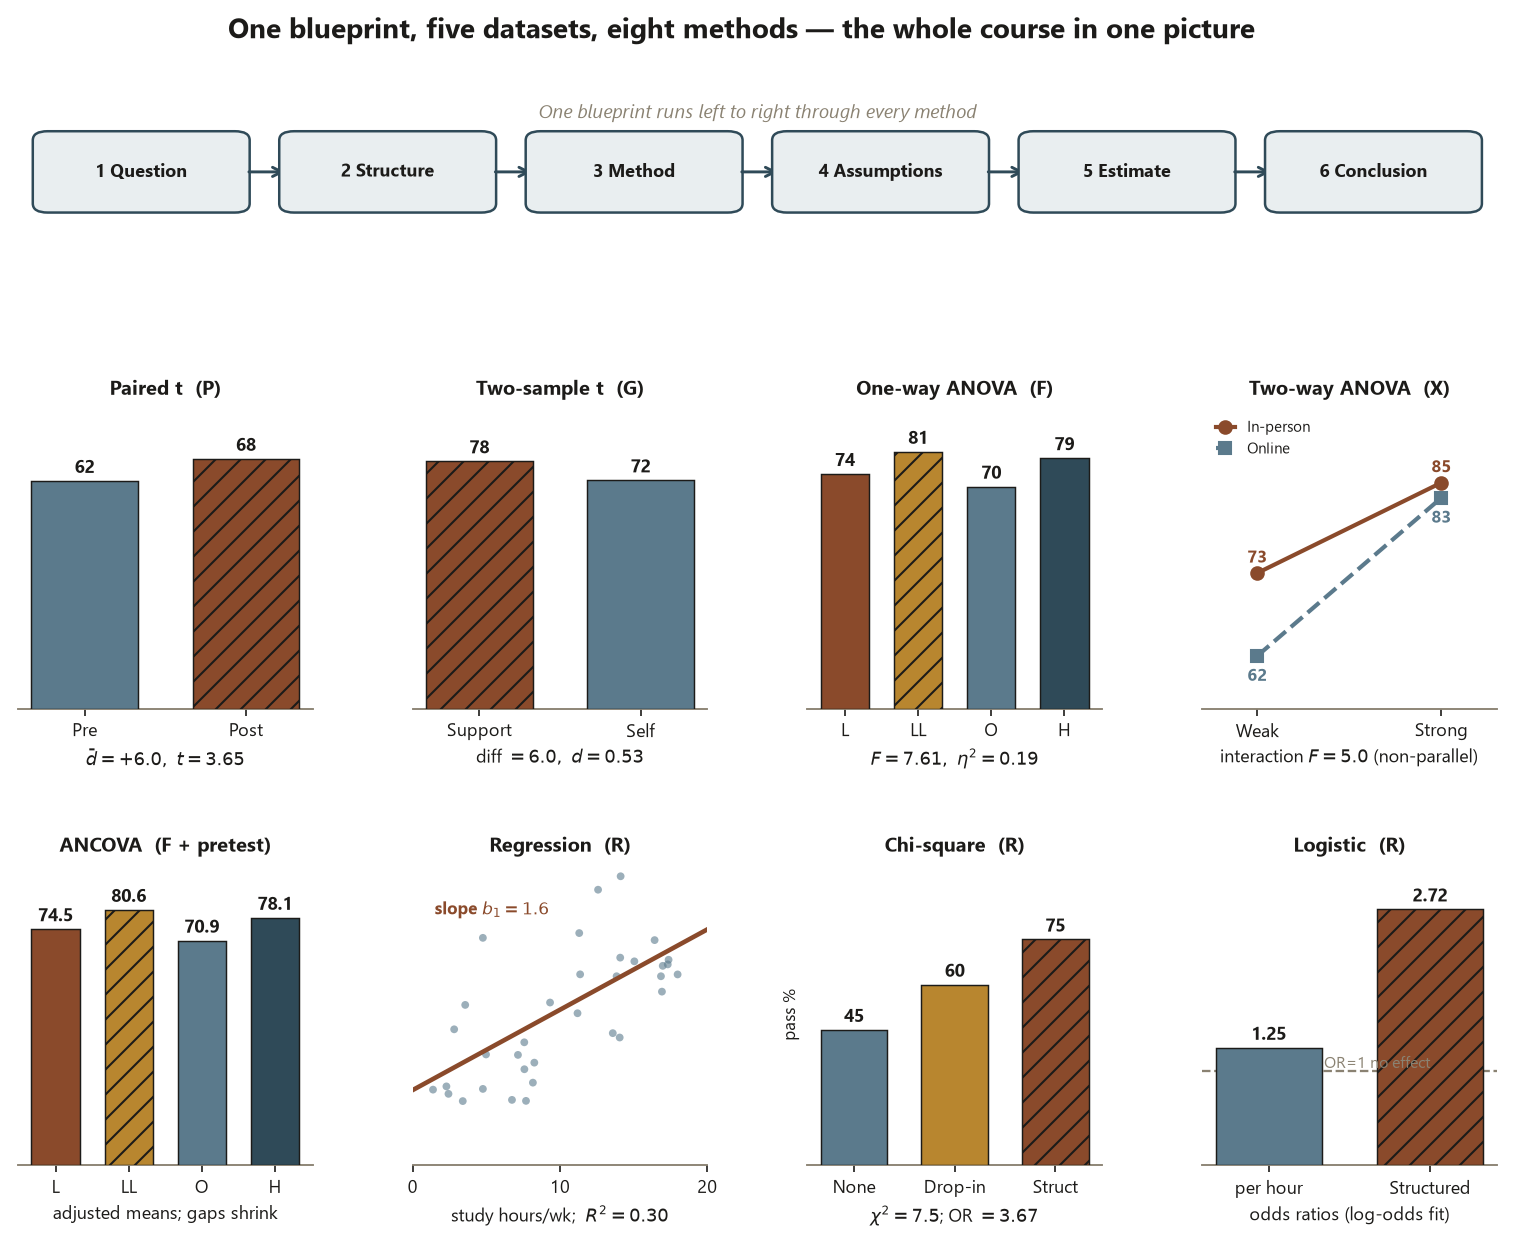
The idea. Every analysis in this course is one instance of the same six steps. The structure — the outcome type and the design — is what changed from method to method; the reasoning did not. Below, each dataset enters at step 2 (structure) and is carried through to step 6 (conclusion), and you can see the eight methods fall out of the structures.
Dataset P — paired pre/post readiness. Structure: one quantitative outcome (readiness, 0–100) measured twice on the same \(n = 30\) students; the design is paired. Method: the paired \(t\)-test on the within-student differences, because pairing removes between-student variation. Estimate & uncertainty: mean difference \(\bar d = +6.0\) points, SE \(\approx 1.64\), paired \(t \approx 3.65\) on \(29\) df (\(p \approx 0.001\)), 95% CI \((2.6, 9.4)\) points, effect size \(d_z = 6/9 \approx 0.67\). Conclusion: a real and meaningful gain — but because the same students were measured before and after with no control group, the design supports “scores rose,” not “the module caused the rise.”
Dataset G — two independent groups (Support vs Self-guided). Structure: one quantitative outcome (final score) across two independent groups (\(n_1 = n_2 = 45\)), observational (students self-selected). Method: the two-sample (Welch) \(t\)-test — different students, so independent, not paired. Estimate & uncertainty: difference \(= 6.0\) points, SE \(\approx 2.38\), Welch \(t \approx 2.53\), \(p \approx 0.013\), 95% CI \((1.3, 10.7)\) points, Cohen’s \(d \approx 0.53\) (medium). Conclusion: a real, medium-sized difference — but students chose the support center, so this is association, not causation.
Dataset F — final score by instructional Format (four groups). Structure: one quantitative outcome across four groups (\(n = 25\) each, \(N = 100\)), one factor. Method: one-way ANOVA, then Tukey HSD and a planned contrast. Estimate & uncertainty: \(F \approx 7.61\) on \((3, 96)\), \(p \approx 0.0001\), \(\eta^2 \approx 0.19\) (format explains \(\approx 19\%\) of variance); Tukey flags \(LL-O = 11\), \(H-O = 9\), \(LL-L = 7\); the planned “hands-on vs delivered-only” contrast \(\hat\psi = 8\) points, \(t \approx 4.44\), \(p < 0.001\). Conclusion: format matters, and multiplicity control keeps the family-wise error in check; still observational at the student level.
Dataset X — two-way factorial (Delivery × Background). Structure: one quantitative outcome in a \(2 \times 2\) design (\(n = 20\) per cell). Method: two-way ANOVA, reading the interaction first. Estimate & uncertainty: Delivery \(F \approx 10.4\), Background \(F \approx 67.2\), Interaction \(F \approx 5.0\) on \((1, 76)\), \(p \approx 0.028\). The In-person advantage is \(11\) points for weak-background students but only \(2\) for strong-background students (interaction contrast \(11 - 2 = 9\)). Conclusion: because the interaction is real, the main effects are conditional — do not report “Online is \(6.5\) points worse” uniformly.
Dataset R — predictors → final score & pass/fail. Structure: a quantitative outcome (final score) with quantitative predictors, and a binary outcome (pass), \(n = 120\). Methods, in turn: simple and multiple regression, ANCOVA (with Dataset F + pretest), chi-square on a contingency table, and logistic regression. Estimates & uncertainty: simple slope \(1.6\) points/hour (\(R^2 \approx 0.30\), 95% CI \((1.16, 2.04)\)); multiple-regression hours slope drops to \(1.1\) after adjustment (\(R^2 \approx 0.46\)); ANCOVA shrinks the format gaps to adjusted means \(L\,74.5, LL\,80.6, O\,70.9, H\,78.1\); \(\chi^2 \approx 7.5\) on \(2\) df (\(p \approx 0.024\)), risk difference \(0.30\), relative risk \(\approx 1.67\), odds ratio \(\approx 3.67\); logistic OR per study-hour \(\approx 1.25\) and OR Structured vs None \(\approx 2.72\) (adjusted, down from \(3.67\)). Conclusion: adjustment changes the estimate (confounding), and because students self-select into programs, even a significant association is not proof the program caused passing.
A method-chooser recap: structure → method, walked across the datasets
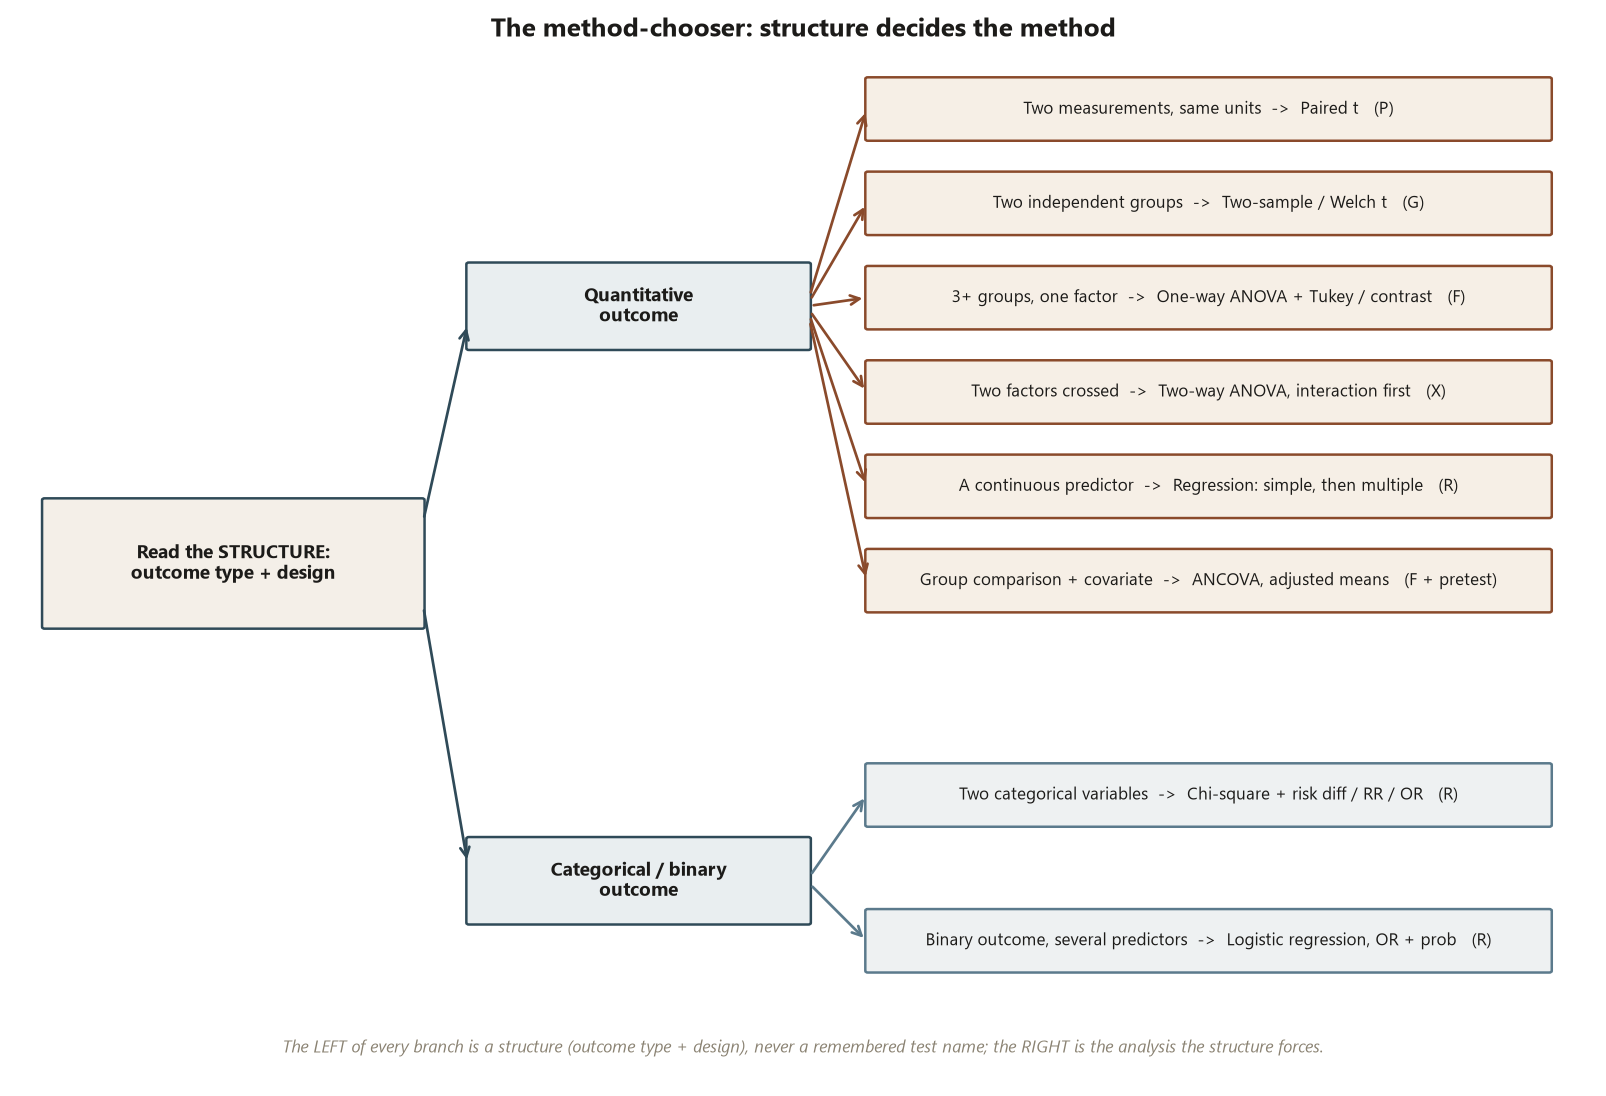
The idea. You should never choose a method by recall. You read the structure — the outcome type and the design — and the method follows. Here is the same decision walked across the five datasets.
- Quantitative outcome, two measurements on the same units (paired) → paired \(t\) (Dataset P).
- Quantitative outcome, two independent groups → two-sample / Welch \(t\) with Cohen’s \(d\) (Dataset G).
- Quantitative outcome, three or more groups, one factor → one-way ANOVA, then Tukey or a planned contrast with \(\eta^2\) (Dataset F).
- Quantitative outcome, two factors crossed → two-way ANOVA, interaction read first (Dataset X).
- Quantitative outcome, a continuous predictor → regression (simple, then multiple for adjustment), reporting slopes with intervals and \(R^2\) (Dataset R).
- Quantitative outcome, group comparison adjusted for a quantitative covariate → ANCOVA, reporting adjusted means (Dataset F + pretest).
- Categorical outcome, association between two categorical variables → chi-square with a risk difference / relative risk / odds ratio (Dataset R, pass × program).
- Binary outcome, several predictors → logistic regression, reporting odds ratios and predicted probabilities (Dataset R, pass).
Read down that list and notice the rule: the left side is always a structure (outcome type + design), never a remembered test name; the right side is the analysis the structure forces. That is the whole method-chooser.
The recurring disciplines: estimate-with-uncertainty, design-bounded claims, read the interaction, report ORs
The idea. Four disciplines recur on every page; the synthesis is the place to name them as a set.
- Estimate with uncertainty, not a verdict. Every result above is reported as a point estimate and an interval and an effect size — \(\bar d = 6\) with CI \((2.6, 9.4)\) and \(d_z = 0.67\); the Welch difference \(6\) with CI \((1.3, 10.7)\) and \(d = 0.53\); the slope \(1.6\) with CI \((1.16, 2.04)\) and \(R^2 = 0.30\). A bare “\(p < 0.05\)” answers almost nothing; “how big, and how sure?” is the question.
- The design drives the claim. Dataset G is observational, so its \(6\)-point difference is association; the same \(6\) points from a randomized experiment would license cause. The number does not tell you which — the design does.
- Confounding → adjustment. The hours slope falls \(1.6 \to 1.1\) and the program odds ratio falls \(3.67 \to 2.72\) once you hold other variables fixed. Adjustment reveals that part of each raw association was baseline difference, not effect — the central thread of “models, groups, and categorical data.”
- Read the interaction first; report ORs / predicted probabilities for a binary outcome. When an interaction is significant (Dataset X), the main effects are conditional. And for the binary outcome (Dataset R), a logistic coefficient lives on the log-odds scale: exponentiate to an odds ratio, and report a predicted probability as the conclusion — never the raw logit, and never confusing the odds ratio with the relative risk (\(\mathrm{OR} \ne \mathrm{RR}\)).
Worked examples
Worked example — two contrasting datasets through all six steps (recurring)
Take two datasets that sit at opposite ends of the course — the paired, quantitative Dataset P and the categorical/binary Dataset R — and walk each through the full six-step blueprint, side by side, so you can see the same reasoning produce two very different analyses. No new numbers; these are the locked results.
The static R below maps each structure to its method and shows the locked output as # comment. It is teaching code, shown, not executed (R is not run on this site).
set.seed(35203)

# ---- Dataset P: paired pre/post readiness (same n = 30 students) -------------
# Structure: ONE quantitative outcome, measured twice, PAIRED design.
# Method:    paired t-test on the within-student differences d = post - pre.
t.test(post, pre, paired = TRUE)
#  mean d = +6.0 pts   SE = 1.64   t = 3.65 on 29 df   p ~= 0.001
#  95% CI for the mean difference = (2.6, 9.4) pts   effect size d_z = 6/9 ~= 0.67

# ---- Dataset R: pass/fail by support program & predictors (n = 120) ----------
# Structure: a CATEGORICAL outcome (chi-square) and a BINARY outcome (logistic).
chisq.test(table(pass, program))
#  chi-square = 7.5 on 2 df   p ~= 0.024
#  Structured vs None: risk diff = 0.30   RR ~= 1.67   OR ~= 3.67  (raw)
glm(pass ~ hours + pretest + program, family = binomial)
#  OR per study-hour = exp(0.22) ~= 1.25
#  OR Structured vs None (adjusted) = exp(1.0) ~= 2.72   (shrinks from 3.67)

# P: paired t = 3.65, CI (2.6, 9.4)   R: chi2 = 7.5, OR raw 3.67 -> adj 2.72
Dataset P, the six steps. (1) Question: did readiness change from before to after? — a comparison. (2) Structure: one quantitative outcome on the same \(30\) students, paired. (3) Method: the paired \(t\)-test, because pairing removes between-student variation (treating the columns as independent would inflate the SE to \(\approx 2.97\), nearly double). (4) Assumptions & diagnostics: the within-pair differences are roughly normal — check a histogram or QQ plot of \(d_i\), not of the raw columns. (5) Estimate & uncertainty: \(\bar d = +6.0\) points, 95% CI \((2.6, 9.4)\), \(d_z \approx 0.67\). (6) Conclusion: a statistically clear, practically modest-to-meaningful gain on a 100-point scale — but with no control group the design supports “scores rose,” not “the module caused it.”
Dataset R, the six steps. (1) Question: is passing associated with the support program, and how do predictors move the odds of passing? — explaining a categorical/binary outcome. (2) Structure: a categorical outcome (pass/fail × program) and a binary outcome (pass) with several predictors, observational. (3) Method: chi-square for the table association, then logistic regression for the adjusted binary model. (4) Assumptions & diagnostics: all expected counts \(\ge 5\) (they are, each \(= 24\)); independence of students; for the logistic model, check the linearity of the logit and influential points. (5) Estimate & uncertainty: \(\chi^2 \approx 7.5\), \(p \approx 0.024\); effect sizes risk difference \(0.30\), RR \(\approx 1.67\), OR \(\approx 3.67\); the adjusted OR Structured vs None \(\approx 2.72\), and OR per study-hour \(\approx 1.25\). (6) Conclusion: a real association, weakened after adjustment (confounding by hours and pretest); and because students self-select into programs, this is association, not causation — report the odds ratio and a predicted probability, never the raw logit.
What the side-by-side shows. Two outcomes that could not look more different — a paired mean difference in points and an adjusted odds ratio for a binary outcome — came out of the same six steps. The structure changed; the reasoning did not. That portability is the course.
Worked example — transfer: “name the structure, name the method” (new context)
This is the drill the final exam will ask for. For each new mini-scenario, read the structure (outcome type + design), then name the analysis and say what it estimates. These are brand-new contexts, distinct from the Cypress Ridge world; the numbers below are clearly-distinct illustrative values, not the locked ones.
Scenario A — a clinic’s wait-time redesign. A clinic measures patient wait time in minutes for the same \(40\) patients’ typical visit before and after a scheduling redesign, and asks whether wait time fell. Name the structure: one quantitative outcome, measured twice on the same units — paired. Name the method: the paired \(t\)-test on the within-patient differences. What it estimates: the mean change in wait time, reported with a confidence interval and an effect size \(d_z\) — illustratively, a mean drop of \(\approx 4.5\) minutes, 95% CI roughly \((1.8, 7.2)\). What it cannot support: unless other clinic conditions were held fixed, the before/after design alone does not prove the redesign caused the drop — a seasonal lull could confound it.
Scenario B — three fertilizer blends and a soil covariate. An agronomist compares crop yield (bushels/acre) across three fertilizer blends on \(30\) plots, \(10\) per blend, and also records each plot’s baseline soil-nitrogen (a covariate that differs by chance across the blend groups). Name the structure: one quantitative outcome, three groups (one factor), with a quantitative covariate. Name the method: ANCOVA — one-way ANOVA adjusted for soil nitrogen — after checking the parallel-slopes assumption. What it estimates: the adjusted blend means (yields at a common baseline nitrogen) with their intervals; illustratively, the raw blend gaps shrink once you adjust, because part of the apparent blend advantage was richer starting soil. What it cannot support: if plots were not randomly assigned to blends, even the adjusted comparison is association — adjustment controls measured confounders, not unmeasured ones.
Why the drill matters. In both scenarios you chose the method without naming a test from memory — you read the structure (paired quantitative; grouped quantitative with a covariate) and the analysis followed. That is exactly the move under the time pressure of the final: structure first, method second, estimate-with-uncertainty third, design-bounded conclusion last.
A common mistake
The week’s classic applied-methods error is to collapse a semester of reasoning back into a catalog — “if I have two groups, run a \(t\)-test; if I have a table, run chi-square” — memorizing tests as a menu instead of recognizing structures. The catalog habit fails in two predictable ways. First, it picks the wrong analysis when the structure is subtle: it treats paired data (Dataset P) as two independent groups, inflating the SE and throwing away power; it ignores the covariate that ANCOVA exists to handle; it reports a two-way main effect as if it were unconditional when the interaction (Dataset X) says otherwise. Second — and worse — it forgets that the strength of the conclusion is bounded by the design. A catalog gives you a p-value and stops; the blueprint asks “what does this estimate mean, how uncertain is it, and what does the design let me claim?” Dataset G’s \(6\)-point difference and Dataset R’s odds ratios are observational — they buy association, not causation, no matter how small the p-value. Confusing a small \(p\) with a large effect, or a large effect with a cause, is the same mistake wearing different clothes. Run the antidote on any analysis you are about to call finished: name the structure, name the estimate with its interval, and name the design that bounds the claim. If you can do all three, you have used the blueprint, not the catalog.
Low-stakes self-checks (ungraded)
These are for your own practice — ungraded, no submission.
- For each structure — paired quantitative, two independent groups, several groups, a two-factor design, a continuous predictor, a group comparison with a covariate, a categorical outcome, a binary outcome — name in one phrase the analysis it calls for and the effect size you would report with it.
- A classmate reports the Dataset G result as “the support center raises scores by \(6\) points.” Name the two errors (a missing interval; a causal claim from observational data) and restate the result correctly.
- Walk Dataset P through all six blueprint steps from memory, and explain in one sentence why treating the pre and post columns as independent would be wrong.
- The Dataset X interaction is significant (\(F \approx 5.0\), \(p \approx 0.028\)). Explain why “Online is \(6.5\) points worse” is a misleading summary, and give the correct conditional statement.
- The Dataset R hours slope is \(1.6\) simple but \(1.1\) adjusted, and the program odds ratio is \(3.67\) raw but \(2.72\) adjusted. Say in your own words what adjustment revealed, and why neither figure licenses a causal claim.
- For the logistic result, explain why you report OR \(\approx 2.72\) and a predicted probability rather than the raw logit coefficient, and state the difference between an odds ratio and a relative risk.
Reading and source pointer
This synthesis is grounded in the instructor notes (the primary course materials) — the source for the analysis-blueprint logic, the method-chooser, and the throughline disciplines (estimate-with- uncertainty; statistical vs practical vs causal) — and it draws the concepts and sequence of the whole modeling arc, from comparing means through ANOVA, regression, two-way tables, and logistic regression, from IMS (Çetinkaya-Rundel & Hardin), the main open-text anchor read across the course. These notes are the course’s own synthesis, grounded in but not copied from the sources. No prose, examples, exercises, figures, or solutions are reproduced from any source.
Public vs. graded
These notes, the examples, and the practice here are public and ungraded — study material only. No graded prompts, answer keys, rubrics, point values, or due dates appear on this site. Graded applied-methods checkpoints, weekly quizzes, homework and analysis memos, applied analysis labs, the midterm, the applied methods project, and the final exam live in Blackboard (the LMS), which is authoritative for due dates, submissions, and grades. If this page and Blackboard ever disagree, follow Blackboard.
Looking ahead
Next week there is no next week of new material — this is the last class meeting (Mon Dec 7), with the consultation day (Dec 8) and the final-exam window Dec 9–15 (exact block via Blackboard) to follow. The final is cumulative, and it emphasizes exactly what this review consolidated: method choice (read the structure, name the analysis) and interpretation (estimate with its uncertainty, statistical vs practical vs causal, the design that bounds the claim). So “looking ahead” means walking into the exam holding the one picture from this review — a data structure on the left, an analysis on the right, and the six-step blueprint running between them. Beyond the course, the habit is what lasts. The next time real data arrive paired, grouped, factorial, or categorical, you will not ask “which test did we memorize for this?” You will ask “what is the structure, what analysis does it call for, what does the model estimate and how sure am I, and what does the design let me claim?” — and you will report the estimate with its uncertainty, and keep association and causation apart, every time.
See also
- Method chooser (decision guide) — the question → structure → method walk this review consolidates.
- Reporting and interpretation guide — effect sizes, CIs, practical vs statistical, association vs causation.
- Assumptions and diagnostics guide — what each method assumes and how to check it.
- Methods glossary — the recurring vocabulary in one place.
- Week 14 — Applied analysis report workshop — one dataset end-to-end through the blueprint.