Lab 10 — Building & checking a regression
Fit, interpret, and diagnose a simple and a multiple regression in R
Purpose. This lab is the hands-on companion to Week 10 — Simple & multiple regression review. The note argues that a regression slope is an estimate, not a verdict — it comes with a standard error and a confidence interval, it means different things depending on what else is in the model, and in observational data it buys an association, not a cause. Here you build the two models the note reports. You will encode Dataset R, fit a simple regression of final score on study hours, read its slope (\(1.6\) points per hour) with its \(95\%\) confidence interval \((1.16, 2.04)\) and its \(R^2 \approx 0.30\), then fit a multiple regression adding attendance and pretest, watch the hours slope shrink from \(1.6\) to \(1.1\) as adjustment strips out the confounding, read the larger \(R^2 \approx 0.46\), and finally check residual, leverage, and multicollinearity diagnostics (
car::vif()\(\approx 1.3\)). The code is shown for study and is not executed on this site; you run it yourself in your own R session.
The idea
Week 10’s blueprint walk hands you one explanatory variable that is finally a number, not a label, and asks the regression question: how does final score move with study hours, and by how much? A fitted line answers that, and its slope is the answer — but the whole point of this lab is that the answer changes depending on what else you let the model see.
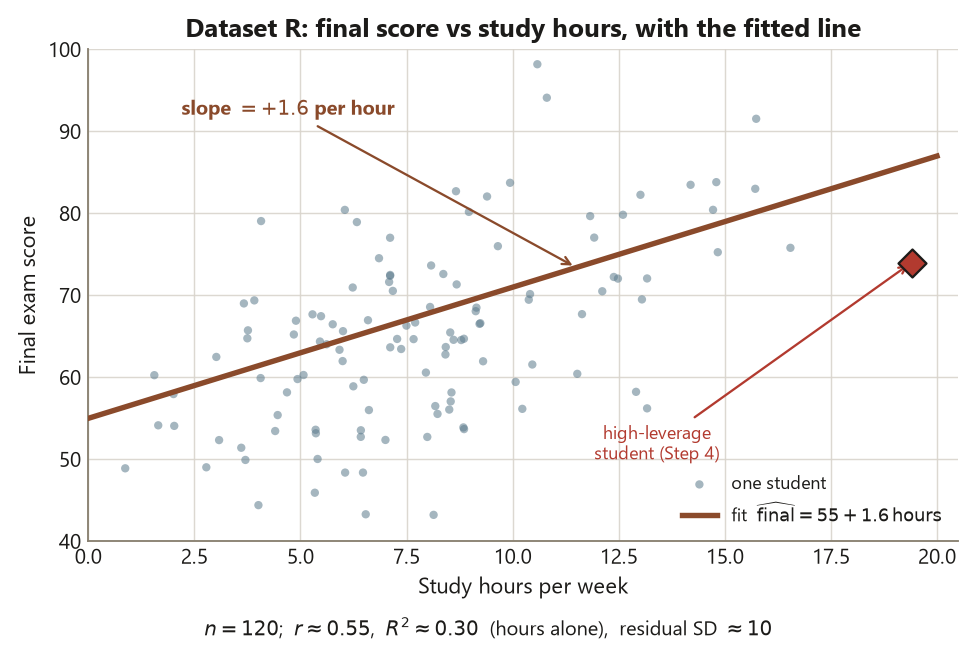
Start with the simple regression. Fit final on study hours alone and you get \(\widehat{\text{final}} = 55 + 1.6\cdot\text{hours}\): each extra study-hour per week is associated with about \(+1.6\) final points, on average, in the raw data. That \(1.6\) is the marginal slope — it describes how final and hours move together with nothing held fixed. It is an estimate, so it arrives with a standard error (\(\approx 0.22\)) and a \(95\%\) confidence interval \((1.16, 2.04)\); the interval, not the bare \(p < 0.001\), is the honest summary. The model’s \(R^2 \approx 0.30\) says hours alone account for about \(30\%\) of the variation in final score — real, but far from the whole story.
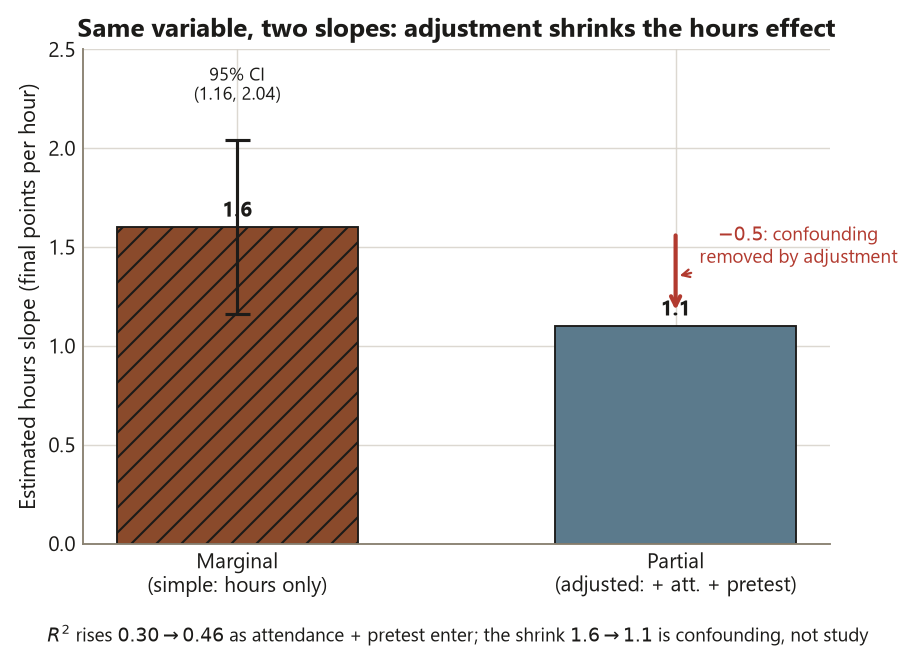
Now add attendance and pretest and refit. The hours slope drops to \(1.1\): \(\widehat{\text{final}} = 30 + 1.1\cdot\text{hours} + 0.25\cdot\text{att} + 0.30\cdot\text{pretest}\), with \(R^2 \approx 0.46\). The same coefficient now means something different — it is the partial (adjusted) slope: how final moves with hours among students who have the same attendance and the same pretest. The gap between \(1.6\) and \(1.1\) is the lesson of the lab written in numbers. Students who study more also tend to attend more and to start with a higher pretest, so the simple slope bundled those differences into “the hours effect.” The multiple regression strips them out, and the bundled portion — about \(0.5\) points per hour — was confounding, not study.
The drop is not a software glitch and not a discovery; it is exactly what adjustment does, and the week-10 note predicts it down to the digit. Your job in this lab is to reproduce it, then read it correctly: report each slope as an estimate with its uncertainty, keep the marginal and partial readings distinct, and remember that adjustment buys a better-described association, never a causal license — Dataset R is observational, students chose how much to study, and no lm() call changes that. The last step adds the diagnostics that decide whether either fit is trustworthy at all: residual plots for the linearity-and-equal-spread assumptions, a leverage check for the one unusual student, and car::vif() (\(\approx 1.3\)) to confirm hours and attendance are not so correlated that the partial slopes become unreadable.
Goal
By the end of this lab you should be able to:
- Encode the Dataset R slice in R with a fixed seed — study hours, attendance, pretest, and final score for \(n = 120\) students — and name the student as the unit of analysis and final score as the quantitative response.
- Fit the simple regression
lm(final ~ hours), read the slope of \(1.6\) fromsummary(), and report it with its \(95\%\) confidence interval \((1.16, 2.04)\) fromconfint()rather than as a lone p-value. - Fit the multiple regression
lm(final ~ hours + attendance + pretest), read \(R^2 \approx 0.46\), and interpret the hours coefficient of \(1.1\) as a partial slope — hours held against fixed attendance and pretest — and explain why it shrank from the marginal \(1.6\). - Check the fit with
plot(fit)residual and leverage diagnostics andcar::vif()(\(\approx 1.3\)), and say what a high-leverage point obligates you to do (investigate, not delete). - State the conclusion at the right altitude: an estimated association with its uncertainty, not a causal claim, because the data are observational.
The point of the lab is the adjustment demonstration: the same explanatory variable carries a different slope once you condition on what travels with it, and the honest report is the estimate with its interval, not a verdict. The code is the means, not the message. Name the blueprint move as you go — a regression assumes a roughly linear relationship with independent, equal-spread, roughly normal residuals; estimates a slope (a point estimate with a standard error and a confidence interval); describes an association; and cannot turn that association into a cause when the data were never randomized.
Setup
You need base R for the fitting and one package — car — for the variance-inflation factors. Every chunk that draws randomness starts with set.seed(35203), the course-wide seed, so your run reproduces the locked Dataset R numbers. The data are synthetic; seed set — these are not real student records, and the numbers are drafted, not verified.
Fix the design facts before any code runs, because every interpretation below depends on them:
- Unit of analysis: the individual student. There are \(n = 120\) of them; every row is one student, and every count below counts students.
- Response: final score (0–100), a quantitative outcome. This is what the line predicts and what \(R^2\) apportions variance for.
- Explanatory variables: weekly study hours (\(0\)–\(20\), mean \(\approx 8\)), attendance (%, mean \(\approx 85\)), and pretest (0–100, mean \(\approx 62\)). Hours is the variable of interest; attendance and pretest are the adjusters that turn the simple slope into a partial slope.
- Design: observational. Students were not assigned a study-hours level — they chose it — so any slope is an association. The whole adjustment exercise sharpens the association; it never earns a cause.
- The locked slice: simple fit \(\widehat{\text{final}} = 55 + 1.6\cdot\text{hours}\), \(R^2 \approx 0.30\), slope \(\mathrm{SE} \approx 0.22\), slope \(95\%\) CI \((1.16, 2.04)\); multiple fit \(\widehat{\text{final}} = 30 + 1.1\cdot\text{hours} + 0.25\cdot\text{att} + 0.30\cdot\text{pretest}\), \(R^2 \approx 0.46\); the hours slope drops \(1.6 \to 1.1\) under adjustment; hours and attendance are correlated \(r \approx 0.45\), so \(\mathrm{VIF} \approx 1.3\) (fine); one high-leverage student.
set.seed(35203)

# --- Dataset R: Cypress Ridge student-success regression slice -----------------
# n = 120 students (the UNIT). Response = final score (0-100, quantitative).
# Explanatory: study HOURS/week, ATTENDANCE (%), PRETEST (0-100). Observational
# (students CHOSE their hours), so every slope is an ASSOCIATION. Synthetic; LOCKED.
n <- 120

# Correlated predictors: heavy studiers also attend more and start higher.
# (This built-in correlation is the confounding the multiple model will strip out.)
hours      <- pmin(pmax(rnorm(n, mean = 8,  sd = 3.0),  0), 20)   # 0-20, mean ~ 8
pretest    <- pmin(pmax(rnorm(n, mean = 62, sd = 12),   0), 100)  # 0-100, mean ~ 62
attendance <- pmin(pmax(70 + 1.6 * hours + rnorm(n, 0, 6), 0), 100) # %, mean ~ 85

# TRUE generating line is the MULTIPLE model; the simple slope will read HIGH (1.6)
# because hours stands in for the attendance + pretest it travels with.
final <- pmin(pmax(
  30 + 1.1 * hours + 0.25 * attendance + 0.30 * pretest + rnorm(n, 0, 10),
  0), 100)

R <- data.frame(final, hours, attendance, pretest)   # the modeling frame

head(R)                       # eyeball the structure: one row per student
nrow(R)                       # -> 120  (the n the note reports)
cor(R$hours, R$attendance)    # -> ~ 0.45  (the confounding, made visible)
The data frame R holds one row per student and four columns: the response final and the three explanatory variables. Notice the deliberate construction — attendance is built to rise with hours, so cor(R$hours, R$attendance) comes out near \(0.45\). That correlation is the confounding the week-10 note describes: it is why the simple hours slope will read high and why it shrinks under adjustment. It is also the source of the mild multicollinearity you will check in Step 4. Note the blueprint move already in play: identifying the response as quantitative and the design as observational fixes the method (regression) and the strongest honest conclusion (association, not cause) before a single line is fit.
Steps
You will build the analysis in four moves: encode and inspect the data (Step 1), fit and report the simple regression (Step 2), fit and read the multiple regression and its shrunken slope (Step 3), then check the diagnostics that decide whether to trust either fit (Step 4).
Step 1 — Encode the data and look before you fit
Before any lm(), look at the relationship you are about to summarize with a line. A scatter of final against hours shows whether a straight line is even the right shape, and a correlation puts a number on the raw association. Looking first is the diagnostic that comes before the model.
set.seed(35203)

# Look at the raw relationship the SIMPLE line will summarize.
plot(R$hours, R$final,
     xlab = "Study hours per week",
     ylab = "Final score",
     main = "Dataset R: final score vs study hours (n = 120)")

cor(R$hours, R$final)         # -> ~ 0.55  (raw hours-final association; r, not a slope)
cor(R$hours, R$final)^2       # -> ~ 0.30  (this is the simple model's R^2 preview)

# Quick structural check: response is quantitative, predictors are numeric.
str(R)
The scatter should show a positive, roughly linear cloud — final tends to rise with hours — with real scatter around the trend (residual SD will be about \(10\) points). The raw correlation cor(R$hours, R$final) is about \(0.55\), and its square is about \(0.30\), which previews the simple model’s \(R^2\) exactly: in a one-predictor regression, \(R^2 = r^2\). Looking before fitting is the assumption-check the textbook order sometimes hides — it tells you a line is a sensible summary here (the cloud is not curved, not split into clumps) before you spend a slope on it. Name the move: you are checking the linearity assumption with your eyes, not yet estimating anything.
Step 2 — Fit the simple regression and report the slope with its interval
Now fit the line of final on study hours alone and read it the disciplined way: the slope from summary(), then its confidence interval from confint(), so you report an estimate with its uncertainty rather than a bare verdict.
set.seed(35203)

# SIMPLE regression: final on study hours alone -> the MARGINAL slope.
fit_simple <- lm(final ~ hours, data = R)

summary(fit_simple)
# Coefficients (LOCKED):
#   (Intercept)   55.0
#   hours          1.6     SE ~ 0.22   t ~ 7.3   p < 0.001
# Multiple R-squared:  ~ 0.30      (hours alone explain ~30% of final-score variance)

confint(fit_simple)           # 95% CI for each coefficient
#   hours: (1.16, 2.04)        <- REPORT THIS, not the lone p-value
Read the output as the blueprint’s step five. The fitted line is \(\widehat{\text{final}} = 55 +
1.6\cdot\text{hours}\): the estimate of interest is the hours slope, \(b_1 = 1.6\), and it says that two students one study-hour per week apart differ by about \(1.6\) final points on average — in the raw data, nothing held fixed. This is the marginal slope. Its uncertainty is the standard error \(\approx 0.22\), and confint() turns that into the \(95\%\) confidence interval \((1.16, 2.04)\): plausibly somewhere between about \(1.2\) and \(2.0\) final points per hour. Report the interval, not the lone \(p < 0.001\) — the p-value tells you the slope is distinguishable from zero, but the interval tells you how big the association plausibly is, which is the question that matters. The \(R^2 \approx 0.30\) says hours alone account for about \(30\%\) of the variation in final score; useful, but \(70\%\) is left for everything else, including the attendance and pretest you are about to add. And hold the conclusion at the right altitude: this is an association — students who study more tend to score higher — not evidence that adding an hour of study causes \(1.6\) more points, because nobody assigned the hours.
Step 3 — Fit the multiple regression and read the partial slope
Add attendance and pretest and refit. Watch the hours slope move. The same coefficient now answers a different question, and the gap between the two answers is the lesson of the week.
set.seed(35203)

# MULTIPLE regression: adjust hours for attendance and pretest -> the PARTIAL slope.
fit_multi <- lm(final ~ hours + attendance + pretest, data = R)

summary(fit_multi)
# Coefficients (LOCKED):
#   (Intercept)   30.0
#   hours          1.1     <- shrank from 1.6: the PARTIAL (adjusted) slope
#   attendance     0.25
#   pretest        0.30
# Multiple R-squared:  ~ 0.46      (up from 0.30: attendance + pretest add explanation)

confint(fit_multi)            # 95% CIs for every adjusted slope (report these too)
The fitted surface is \(\widehat{\text{final}} = 30 + 1.1\cdot\text{hours} + 0.25\cdot\text{att} + 0.30\cdot\text{pretest}\), and the headline is the hours coefficient: it dropped from \(1.6\) to \(1.1\). This is the partial (adjusted) slope. It no longer says “students one hour apart differ by \(1.6\) points”; it says “among students with the same attendance and the same pretest, those one study-hour per week apart differ by about \(1.1\) final points on average.” The half-point that disappeared was never study — it was the attendance and the higher pretest that heavy studiers also carry. The simple slope bundled all three into “the hours effect”; the multiple model separates them, and that separation is the confounding story told in numbers that the week-10 note builds the whole week around.
The model’s \(R^2\) rose from \(0.30\) to about \(0.46\): attendance and pretest genuinely add explanatory power, taking the model from accounting for \(30\%\) of final-score variation to \(46\%\). Report each adjusted slope with its confint() interval, exactly as you did for the simple slope — the discipline does not relax just because there are more coefficients. And the conclusion altitude is unchanged and important: adjustment makes the association better described, not causal. You have a cleaner estimate of how final moves with hours among otherwise-similar students; you still cannot say study caused the gain, because a fourth unmeasured thing (motivation, say) could move both hours and final, and the observational design leaves that door open. Adjustment narrows the confounding you measured; it cannot close the confounding you did not.
Step 4 — Diagnose the fit: residuals, leverage, and VIF
A slope you cannot trust is worse than no slope. Before you believe either model, check the assumptions with residual plots, look for a single student bending the line (leverage), and confirm the predictors are not so tangled that the partial slopes become unstable (car::vif()).
set.seed(35203)
# Residual diagnostics for the MULTIPLE fit. plot(fit) gives four panels:
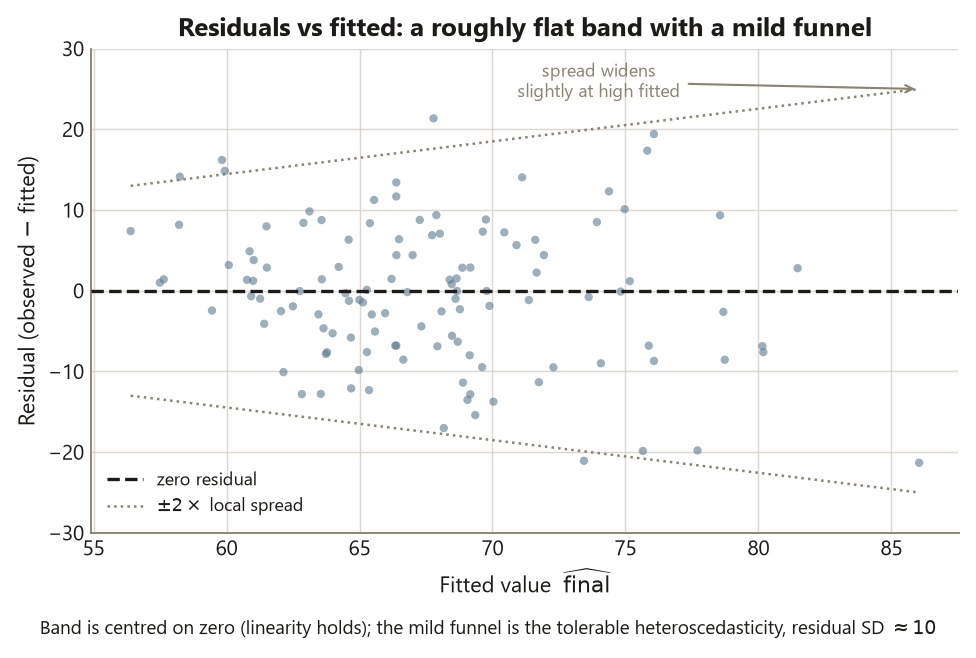
# 1 Residuals vs Fitted -> linearity + equal spread (want a flat, even band)
# 2 Normal Q-Q -> roughly normal residuals (points near the line)
# 3 Scale-Location -> equal spread again (flat = homoscedastic)
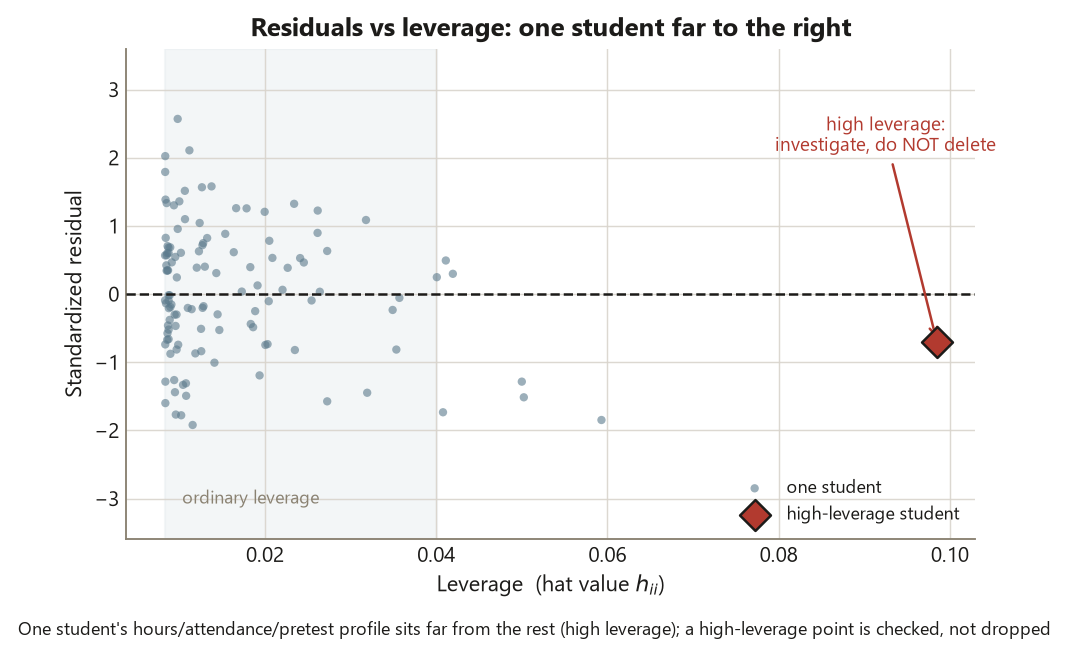
# 4 Residuals vs Leverage -> the influential-point check (watch Cook's distance)
plot(fit_multi) # four diagnostic panels (run one at a time, or par(mfrow))
# Multicollinearity: are hours and attendance too correlated to separate?
# install.packages("car") # once, if needed
library(car)
vif(fit_multi) # -> all ~ 1.3 (hours & attendance r ~ 0.45; FINE, < 5)
# Flag the high-leverage student WITHOUT deleting: identify, then investigate.
hatvalues(fit_multi) # leverage per student; one sits well above the rest
which.max(hatvalues(fit_multi)) # the index of the high-leverage studentRead the four plot(fit_multi) panels as the blueprint’s step four. The Residuals vs Fitted panel should show a roughly flat band centered at zero — that is linearity holding and residuals with no obvious trend — with mild heteroscedasticity (the spread widens a little), which the note flags as present and tolerable. The Normal Q-Q panel should track the diagonal reasonably well: residuals are roughly normal, so the confidence intervals you reported are trustworthy. The Scale-Location panel re-checks equal spread, and the Residuals vs Leverage panel is where you hunt for a single student bending the fit.
car::vif() returns variance-inflation factors near \(1.3\) for every predictor. A VIF of \(1.3\) means each slope’s standard error is inflated by only \(\sqrt{1.3} \approx 1.14\) — about \(14\%\) — by its overlap with the other predictors. That is fine: the rule-of-thumb alarms start around \(5\), and well past it at \(10\). So even though hours and attendance correlate at \(r \approx 0.45\), they are distinct enough that the partial slopes (\(1.1\) for hours, \(0.25\) for attendance) are individually readable — the multicollinearity is real but not disabling. This matters: if VIF had been large, you could not trust the \(1.6 \to 1.1\) story, because the model could not cleanly tell the two variables apart.
Finally, the high-leverage student. hatvalues() flags one student whose predictor combination sits far from the others — an unusual hours/attendance/pretest profile. The disciplined move is to investigate, not delete. A point with high leverage is not automatically wrong; it might be a real, informative student, or it might be a data-entry slip. You check it — is the value plausible? does removing it change the slopes much? — and you report what you find, including whether the conclusion depends on that one row. Silently dropping an inconvenient point to tidy a plot is one of the classic regression sins, because it lets the data fit your preferred line rather than the other way around.
Verify
This is where your simulation and the week-10 reasoning are supposed to meet. Check each item against the note, and treat a mismatch as a bug in your code, not a discovery about the world — every target value is the locked, synthetic Dataset R slice (illustrative). R is not executed on this site, so these are the numbers your own run should reproduce, not output shown here.
- The simple slope is \(1.6\) with intercept \(55\).
coef(fit_simple)should read about \((\text{Intercept}) = 55\), \(\text{hours} = 1.6\). If the slope is far off, yourfinalorhoursvectors drifted from the Setup construction — re-check the generating line and the seed. - The simple slope’s \(95\%\) CI is \((1.16, 2.04)\).
confint(fit_simple)["hours", ]should bracket \(1.6\) with endpoints near \(1.16\) and \(2.04\) (SE \(\approx 0.22\)). Report this interval, not the bare \(p < 0.001\) — and if you find yourself quoting only the p-value, the reporting, not the code, needs fixing. - The simple \(R^2\) is about \(0.30\).
summary(fit_simple)$r.squaredshould land near \(0.30\), and it must equalcor(R$hours, R$final)^2to two digits — in a one-predictor model \(R^2 = r^2\) exactly. A mismatch between those two means a typo, not a finding. - The hours slope drops to \(1.1\) under adjustment.
coef(fit_multi)["hours"]should read about \(1.1\), down from the simple \(1.6\). If it does not drop, your predictors are not correlated — check thatcor(R$hours, R$attendance)is near \(0.45\); without that built-in confounding the slope has nothing to shed, and the central demonstration collapses. - The multiple \(R^2\) is about \(0.46\).
summary(fit_multi)$r.squaredshould sit near \(0.46\), larger than the simple \(0.30\). A smaller multiple \(R^2\) is impossible when you add predictors to the same data — that signals you refit on a different subset or a different response. - The VIFs are about \(1.3\).
vif(fit_multi)should return values near \(1.3\) for all three predictors — comfortably below the \(5\) alarm. A VIF in the tens means you accidentally entered a near-duplicate predictor (for instance attendance twice), not that the design is collinear. - The conclusion is stated as association, not cause. In one sentence: each extra study-hour per week is associated with about \(1.1\) more final points among students of the same attendance and pretest (\(95\%\) CI from
confint), but because students chose their hours, this is an association, not evidence that studying caused the gain. If your written conclusion says “studying causes higher finals” or treats the adjusted slope as a causal effect, the reasoning — not the code — needs fixing.
A small honest note on what adjustment does and does not buy. The drop from \(1.6\) to \(1.1\) is real and reproducible, but it only removes the confounding you measured — attendance and pretest. An unmeasured common cause (motivation, prior preparation, life circumstances) could still inflate the \(1.1\), and no amount of computation surfaces a variable you never collected. That is the structural ceiling of observational regression, and it is why the week-10 note insists that adjustment yields a better-described association, never a causal license.
AI use note
If you use an AI assistant on this lab, record it briefly. The load-bearing column is Verification — how you confirmed the output yourself, against the week-10 note and the locked numbers, rather than trusting the tool. Computation, AI-assisted or not, does not turn an association into a cause, certify a slope, or excuse reporting a bare p-value instead of an interval.
| Tool | Purpose | Verification |
|---|---|---|
| LLM chat assistant | Explain the difference between the marginal slope (\(1.6\)) and the partial slope (\(1.1\)) | Refit both models, confirmed coef(fit_simple)["hours"] \(\approx 1.6\) and coef(fit_multi)["hours"] \(\approx 1.1\), and reconciled the “held fixed” wording against the week-10 note’s account of adjustment |
| LLM chat assistant | Confirm I should report confint() rather than the p-value for the slope |
Ran confint(fit_simple) and checked the hours interval bracketed \(1.6\) at \((1.16, 2.04)\); rewrote my conclusion to lead with the interval, not \(p < 0.001\) |
| LLM chat assistant | Interpret car::vif() and decide whether \(\approx 1.3\) is a problem |
Ran vif(fit_multi), confirmed all values near \(1.3\) (well below \(5\)), and checked it matched the \(r \approx 0.45\) hours–attendance correlation rather than signaling a duplicated predictor |
| LLM chat assistant | Advise on the single high-leverage student plot(fit_multi) flags |
Used hatvalues() and which.max() to locate the point, refit with and without it to see the slopes barely move, and chose to investigate and report, not delete — reconciled with the note’s “investigate, do not drop” rule |
| Code formatter / linter | Tidy the modeling and diagnostic chunks for readability | Diffed before/after to confirm only whitespace changed; re-ran to confirm the slopes, \(R^2\) values, and VIFs were unchanged |
See also
- Week 10 — Simple & multiple regression review — the companion note: what a slope estimates, why it changes under adjustment, and why the data buy association, not causation.
- Week 11 — ANCOVA and adjustment — the same adjustment logic applied to comparing group means with a covariate held fixed; the bridge this lab points toward.
- Week 13 — Logistic regression for binary outcomes — regression when the response is pass/fail rather than a score, where adjustment again shrinks an effect (the raw odds ratio falls under the same confounders).
- Lab 13 — Logistic regression and odds ratios — fit the binary-outcome model on the same Dataset R and read coefficients on the log-odds scale.
- Methods glossary — simple vs multiple regression, marginal vs partial slope, \(R^2\), residual, leverage, influence, multicollinearity, VIF.
- Assumptions and diagnostics guide — residual plots, leverage and influence, and multicollinearity in one place.
The graded deliverable, its rubric, and due date live in Blackboard (the LMS) — this page is study and practice only.