Week 11 — ANCOVA & adjustment
Comparing groups fairly by holding a covariate constant
The week question
Back in week 6 you compared four instructional formats — Lecture (L), Lecture+Lab (LL), Online (O), and Hybrid (H) — on final exam score, and the one-way ANOVA flagged a real format effect (\(F \approx 7.61\), \(\eta^2 \approx 0.19\)). But that comparison quietly assumed the four groups of students were otherwise alike at the start. They were not. Each format’s students walked in with a slightly different pretest score — a baseline readiness measured before the formats began — and those baselines differ across formats. So part of what week 6 read as a “format effect” may just be a “who-started-higher effect” leaking through. This week’s question is: how do you compare the four formats fairly when their students did not start at the same baseline — and what is left of the format difference once you put everyone on the same starting line?
The tool is analysis of covariance (ANCOVA): one-way ANOVA with a quantitative covariate added so the group comparison is made as if every group had the same baseline. The payoff is a set of adjusted means — the format means you would expect at a common pretest — and a format \(F\)-test that has the baseline difference taken out of it. The blueprint runs exactly as it always has: a question, a data structure, a method that matches it, assumptions to check, an estimate with its uncertainty, and a conclusion that keeps statistical, practical, and causal claims apart.
Why this matters
Adjustment is the single most useful idea standing between an honest applied comparison and a misleading one, and it is the throughline that connects this week to the regression you reviewed last week and to the contingency tables and logistic models still ahead. The recurring worry in this whole course — Support-vs-Self-guided in week 5, the regression slope that dropped from \(1.6\) to \(1.1\) in week 10, the program effect that will shrink in weeks 12 and 13 — is confounding: a third variable that travels with both the grouping and the outcome and inflates (or hides) the comparison you care about. ANCOVA is the cleanest place to watch a comparison change when you control for that third variable, because here the confounder is a single, well-measured, pre-treatment number.
It matters because the raw group means and the adjusted group means can tell different stories, and the difference between them is not a rounding error — it is the part of the gap that was never about the formats at all. If LL students simply arrived more ready, then crediting LL with their whole final-score lead overstates what the format did. Adjusting for the pretest hands that borrowed advantage back to the baseline where it belongs, and reports the format effect that survives. Equally, the method matters because it is easy to misuse: adjust for the wrong covariate (one measured after the formats acted), or skip the assumption that makes the adjustment legitimate, and you can manufacture a cleaner-looking answer that is actually more biased than the raw one. The discipline of this week is to adjust honestly — for a pre-treatment covariate, after checking that one slope fits all groups — and to report the adjusted estimate with its uncertainty rather than a bare verdict.
Learning goals
By the end of this week you should be able to:
- State what ANCOVA is — one-way ANOVA plus a quantitative covariate — and say in plain words why you would add the covariate: to compare the groups at the same baseline rather than at the baselines they happened to have.
- Distinguish raw (unadjusted) group means from adjusted (covariate-controlled) group means, and read an adjusted mean as “the format mean predicted at the common pretest.”
- Explain how a difference in baseline confounds the raw comparison, and describe how adjustment removes it — including the direction the gaps move when the higher-scoring groups also started higher.
- Check the parallel-slopes (homogeneity-of-regression) assumption by testing the format\(\times\)pretest interaction, and explain why ANCOVA is only valid when that interaction is negligible.
- Name the rule that you may adjust only for a pre-treatment covariate, and explain why adjusting for a post-treatment variable can bias the very comparison you are trying to make.
- Report the format effect after adjustment as an estimate with uncertainty — the adjusted means, the format \(F\) with its degrees of freedom and \(p\)-value, and a partial effect size — and keep statistical, practical, and causal claims separate.
Core vocabulary
- Covariate — a quantitative variable, measured before the grouping factor takes effect, that is related to the outcome and used to adjust the group comparison. Here it is the pretest (baseline readiness, \(0\)–\(100\), mean \(\approx 62\), correlated with final at \(r \approx 0.50\) within group).
- ANCOVA (analysis of covariance) — a model with a categorical factor (Format) and a quantitative covariate (pretest) predicting a quantitative outcome (final score); equivalently, a regression with one grouping factor and one continuous predictor, \(\text{final} = \beta_0 + (\text{format terms}) + b\cdot\text{pretest}\).
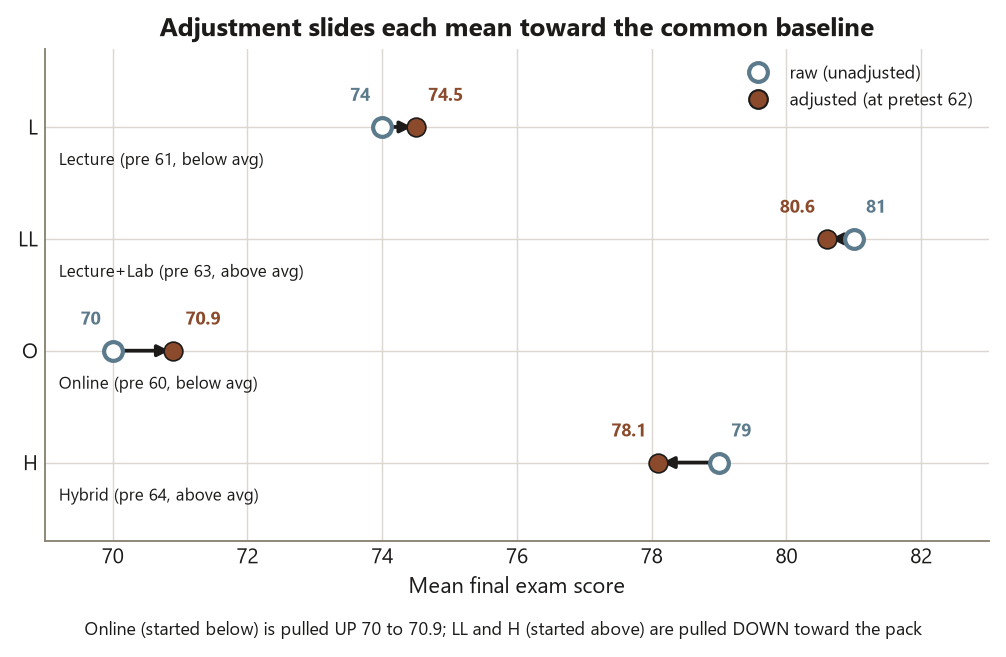
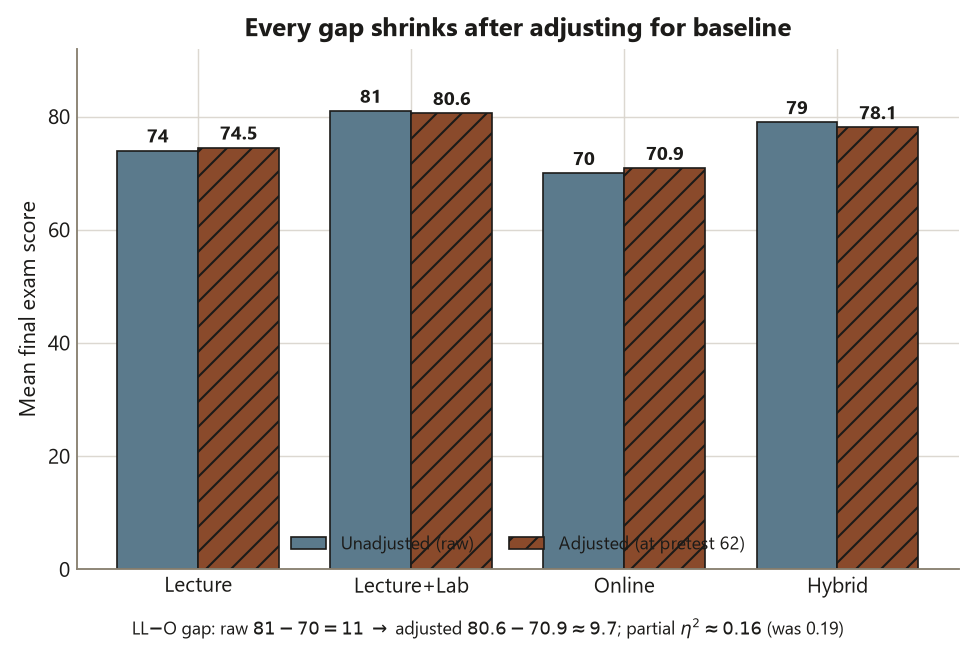
- Raw (unadjusted) mean — a group’s observed average outcome, ignoring the covariate — the week-6 format means \(L\,74\), \(LL\,81\), \(O\,70\), \(H\,79\).
- Adjusted (covariate-controlled) mean — the group mean predicted at a common covariate value (the grand pretest mean), holding baseline fixed across groups; what ANCOVA actually compares.
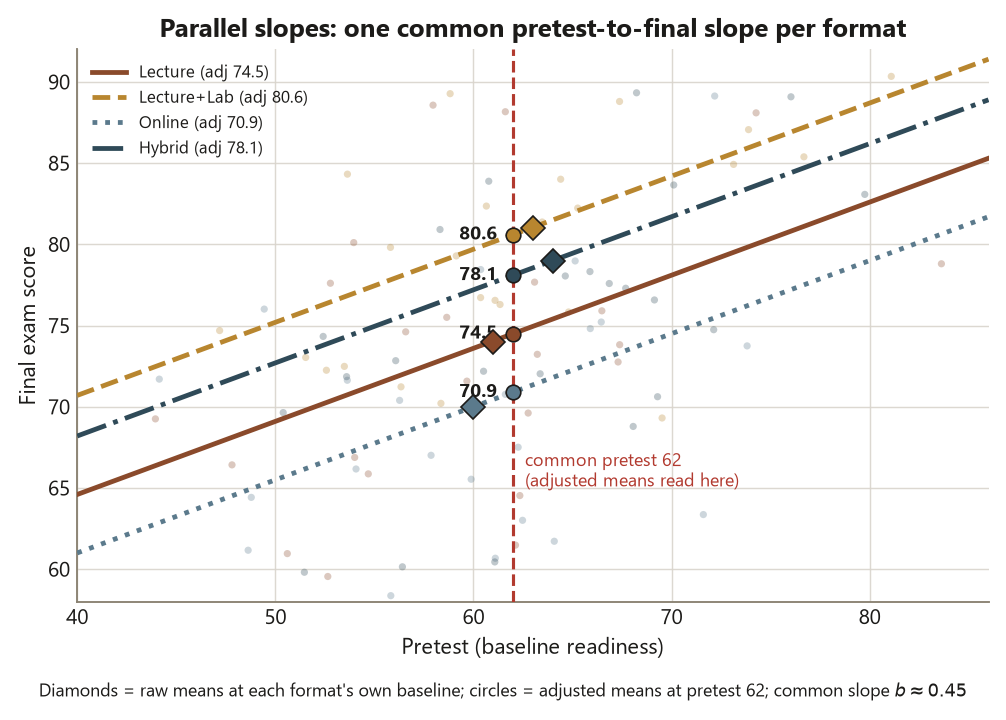
- Common slope \(b\) — the single pretest\(\to\)final slope ANCOVA fits to every group at once (\(b \approx 0.45\)); each extra pretest point is worth about \(0.45\) final points within any format.
- Parallel-slopes (homogeneity-of-regression) assumption — the assumption that the pretest\(\to\)final slope is the same in every format, so one common slope is legitimate; checked by testing the format\(\times\)pretest interaction.
- Partial \(\eta^2\) — the share of outcome variance the factor explains after the covariate is accounted for; the adjusted effect size (\(\eta^2_{\text{partial}} \approx 0.16\) here, down from the raw \(0.19\)).
- Confounding — when a third variable (baseline) is associated with both the grouping and the outcome, so the raw comparison mixes the format effect with the baseline difference.
Concept development
ANCOVA is ANOVA plus a covariate — and it compares adjusted means
Start from what you already have. A one-way ANOVA on Dataset F splits each student’s final score into a format piece and leftover (within-group) variation, and asks whether the format pieces are bigger than chance. ANCOVA keeps that structure but adds one quantitative predictor — the pretest — to the model before it judges the formats. The model is
\[ \text{final}_i = \beta_0 + \tau_{\text{format}[i]} + b\cdot \text{pretest}_i + \varepsilon_i , \]
where the \(\tau\) terms are the format effects and \(b\) is the common pretest slope. Read it as a regression that carries a categorical factor and a continuous covariate side by side — exactly the “categorical-plus-quantitative predictor” model your reading names.
The crucial output is no longer the raw group average. It is the adjusted mean: each format’s predicted final score evaluated at a common pretest value, almost always the grand pretest mean. In words, an adjusted mean answers “what would this format’s average final score have been if its students had started at the typical baseline rather than their own?” That single substitution — evaluate every group at the same covariate value — is the whole engine. Two formats whose raw means differ partly because one started higher will see that part of the gap removed, because the adjusted means hold baseline fixed. The estimate ANCOVA reports is therefore a set of adjusted format means, and the format \(F\)-test asks whether those differ by more than chance.
Why adjust: the formats did not start at the same baseline
Here is the confounding, made concrete. The four formats’ students did not arrive with equal baseline readiness. Their pretest means are \(L\,61\), \(LL\,63\), \(O\,60\), \(H\,64\) — a spread of \(4\) points, small but real, and crucially aligned with the final-score ordering: the formats that finished higher (LL and H) also started higher, and Online, which finished lowest, also started lowest. That alignment is exactly what makes baseline a confounder. Some of LL’s and H’s raw final-score advantage is not the format working — it is their students having walked in more ready.
Adjustment removes that borrowed advantage. With a common slope \(b \approx 0.45\), ANCOVA shifts each group’s mean toward what it would be at the grand pretest mean: a group that started above average gets adjusted down (its lead was partly baseline), and a group that started below average gets adjusted up. The adjusted format means come out to
\[ L \approx 74.5, \qquad LL \approx 80.6, \qquad O \approx 70.9, \qquad H \approx 78.1 . \]
Compare these to the raw means \(L\,74\), \(LL\,81\), \(O\,70\), \(H\,79\). Every gap shrinks: O, which started lowest, is pulled up from \(70\) to \(70.9\); LL and H, which started highest, are pulled down toward the pack. The LL\(-\)O gap, the widest, narrows from a raw \(11\) points to about \(9.7\) adjusted. The adjustment did not erase the format effect — it trimmed the part that was really a baseline difference. What remains is the format-after-adjustment effect, and the test of it is
\[ F \approx 6.2 \ \text{on}\ (3,\,95)\ \text{df}, \qquad p \approx 0.0007, \qquad \eta^2_{\text{partial}} \approx 0.16 . \]
The format effect is still real and still significant, but it is smaller than week 6’s raw effect — the partial \(\eta^2\) of \(0.16\) is down from the raw \(\eta^2 \approx 0.19\), and the residual degrees of freedom dropped from \(96\) to \(95\) because the covariate consumed one. The covariate itself is strongly related to the outcome (\(F \approx 30\), \(p < 0.001\)), which is why adjusting for it matters: a covariate that did nothing would leave the comparison unchanged. The honest conclusion is “formats compared at the same baseline still differ, but by less than the raw means suggested” — an estimate with its uncertainty, not a verdict.
The parallel-slopes assumption, and adjust only for a pre-treatment covariate
Two conditions make this adjustment legitimate, and both are easy to state and easy to skip.
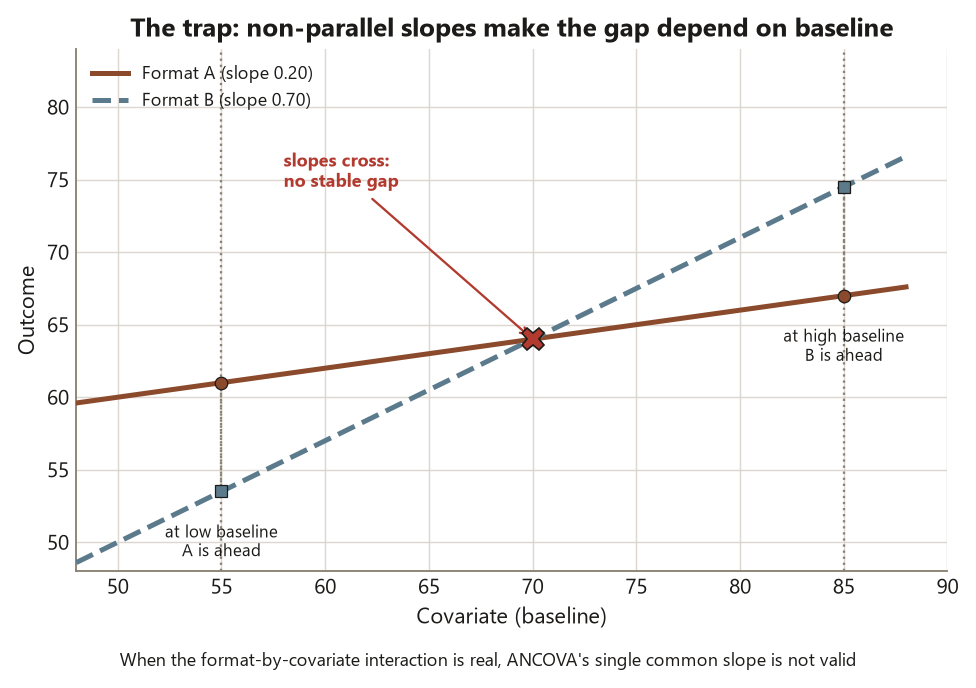
The first is the parallel-slopes (homogeneity-of-regression) assumption. ANCOVA fits one common slope \(b \approx 0.45\) to every format. That is only fair if the pretest\(\to\)final relationship really has the same slope in each group — if a pretest point is worth about the same number of final points whether you are in Lecture or Online. You check it by adding the format\(\times\)pretest interaction to the model and testing it: if the interaction is negligible, one slope fits all and ANCOVA is valid; if the interaction is large, the groups have different slopes, no single adjusted mean summarizes a group, and the very idea of “the format effect at a common baseline” stops being well defined (it would depend on which baseline). For Dataset F the interaction is not significant, \(p \approx 0.5\) — comfortably negligible — so the common-slope model is appropriate and the adjusted means are trustworthy. Report that check; do not assume it.
The second is the rule that you may adjust only for a pre-treatment covariate — one measured before the grouping factor could have acted on it. The pretest qualifies: it was recorded at baseline, before any format was experienced, so it cannot have been changed by the format. That is what licenses treating it as a fixed starting condition. If instead you “adjusted” for something measured after the formats took effect — say, mid-semester quiz performance, which the format itself influences — you would be controlling for a variable that sits on the causal path from format to final score. Removing it would subtract away part of the format’s own effect, biasing the comparison toward “no difference” and producing a cleaner number that is actually more wrong than the raw one. Adjust for what came before; never for what the treatment itself moved.
Worked examples
Worked example — Dataset F ANCOVA: formats at a common baseline (recurring slice)
The question. Do the four instructional formats differ in final score after we account for the fact that their students started at slightly different baselines? The structure. The unit is the student (\(N = 100\), \(n = 25\) per format). The response is final score (quantitative); the explanatory variable is Format (a four-level categorical factor); the covariate is the pretest (quantitative, pre-treatment). The design is observational — students were not randomized to formats — so any conclusion buys association, not causation. Data are synthetic; seed set.
The assumptions. Within each format the pretest\(\to\)final relationship is roughly linear with a common slope (checked below via the interaction); residuals are roughly normal with similar spread; students are independent. The parallel-slopes check is the load-bearing one, so it comes first in the fit.
The computation. Fit the ANCOVA, read the adjusted means, and test format after adjustment. The static R below shows the idiom; it is teaching code and is not executed here.
set.seed(35203)

# Dataset F + pretest: final score under 4 formats (L, LL, O, H), n = 25 each,
# plus a baseline pretest measured BEFORE the formats began. Synthetic.
# Pretest means by format: L 61, LL 63, O 60, H 64 (groups started differently).

# 1) Parallel-slopes CHECK first: does the pretest slope differ by format?
fit_int <- lm(final ~ pretest * format, data = F_data)   # includes pretest:format
anova(fit_int)
#                Df  Sum Sq Mean Sq F value   Pr(>F)
# pretest         1  ...     ...     ~30      <2e-16 ***   covariate strong
# format          3  ...     ...     ~6.2     0.0007 ***
# pretest:format  3  ...     ...     ~0.8     ~0.5         interaction NS -> parallel OK

# 2) Common-slope ANCOVA (drop the interaction once it checks out):
fit <- lm(final ~ pretest + format, data = F_data)
anova(fit)
#            Df  Sum Sq Mean Sq F value   Pr(>F)
# pretest     1   ...    ...     ~30      <0.001 ***   covariate matters
# format      3   ...    ...     ~6.2     0.0007 ***   format effect AFTER adjustment
# Residuals  95   ...    ...                            df = 95 (covariate took one)

coef(fit)["pretest"]          # common slope b ~= 0.45

# 3) Adjusted (covariate-controlled) means at the grand pretest mean:
library(emmeans)
emmeans(fit, ~ format)
#  format emmean   ...     adjusted means:
#  L       74.5
#  LL      80.6
#  O       70.9
#  H       78.1        (raw were 74 / 81 / 70 / 79 -> gaps shrink)
The estimate with its uncertainty. The common slope is \(b \approx 0.45\): within any format, each extra pretest point is associated with about \(0.45\) more final points, and the covariate is strongly related to the outcome (\(F \approx 30\), \(p < 0.001\)). The adjusted format means are \(L\,74.5\), \(LL\,80.6\), \(O\,70.9\), \(H\,78.1\) — each reported, in practice, with a standard error and confidence interval from emmeans, never as a bare point. The format effect after adjustment is \(F \approx 6.2\) on \((3, 95)\), \(p \approx 0.0007\), with \(\eta^2_{\text{partial}} \approx 0.16\). The parallel-slopes check passed: the format\(\times\)pretest interaction is not significant, \(p \approx 0.5\), so one common slope is legitimate.
The interpretation. Compared at the same baseline, the formats still differ (\(p \approx 0.0007\)), but the differences are smaller than the raw week-6 means implied — the gaps shrank (LL\(-\)O fell from \(11\) to about \(9.7\)) and the effect size dropped from \(0.19\) to \(0.16\) because part of the raw “format” gap was really a baseline gap. On the blueprint: the estimate is the set of adjusted means and the format \(F\); the uncertainty is their CIs and the \(p\)-value; the assumption that earns the adjustment is parallel slopes (verified); and the conclusion is bounded — this is observational, so even the adjusted difference is an association between format and final score among students at a common baseline, not proof that switching a student’s format would cause the gap. Adjustment narrows the confounding from one measured baseline; it cannot rule out the unmeasured ones.
Worked example — comparing clinics on outcome, adjusting for patient age (transfer, new context)
The question. Three primary-care clinics — call them North, Central, and South — report average patient blood-pressure improvement (points dropped over six months), and a regional review asks which clinic is doing best. The structure. The unit is the patient; the response is BP improvement (quantitative); the grouping factor is Clinic (three levels); the covariate is patient age at intake (quantitative, pre-treatment — measured before care began). These numbers are illustrative and deliberately distinct from Dataset F.
Why adjustment can change the ranking. Suppose the raw average improvements are North \(= 12\), Central \(= 10\), South \(= 9\) points, so on raw means North looks best and South worst. But the clinics serve very different populations: South’s patients are markedly older on average (intake age \(\approx 68\)) than North’s (age \(\approx 52\)), and older patients improve less on this measure regardless of clinic — age is a confounder, and it is pre-treatment, so it is fair to adjust for. ANCOVA fits a common age slope and re-evaluates each clinic at the grand mean age.
set.seed(35203)

# Illustrative clinic data: BP improvement by clinic, adjusting for intake age.
# Raw means: North 12, Central 10, South 9. South serves OLDER patients (~68)
# than North (~52); older patients improve less -> age confounds the raw ranking.
fit <- lm(improve ~ age + clinic, data = clinic_data)   # ANCOVA: covariate + factor
anova(fit)                                              # test age (strong), then clinic
coef(fit)["age"]                                        # common age slope (negative here)

library(emmeans)
emmeans(fit, ~ clinic)
#  clinic  emmean   adjusted at common age:
#  North    11.0     (was 12 -> nudged down; its patients were younger)
#  Central  10.2
#  South    11.4     (was 9  -> nudged UP; its patients were older)
#  -> adjusted ranking can put South AHEAD of North
The estimate with its uncertainty. Once every clinic is evaluated at the same intake age, South’s adjusted mean rises (its low raw number was partly an older, harder-to-improve panel) and North’s falls slightly (it had an easier, younger panel). The adjusted means can reorder the clinics — South ahead of North — and each would be reported with its confidence interval, with a clinic \(F\)-test for whether the adjusted differences exceed chance.
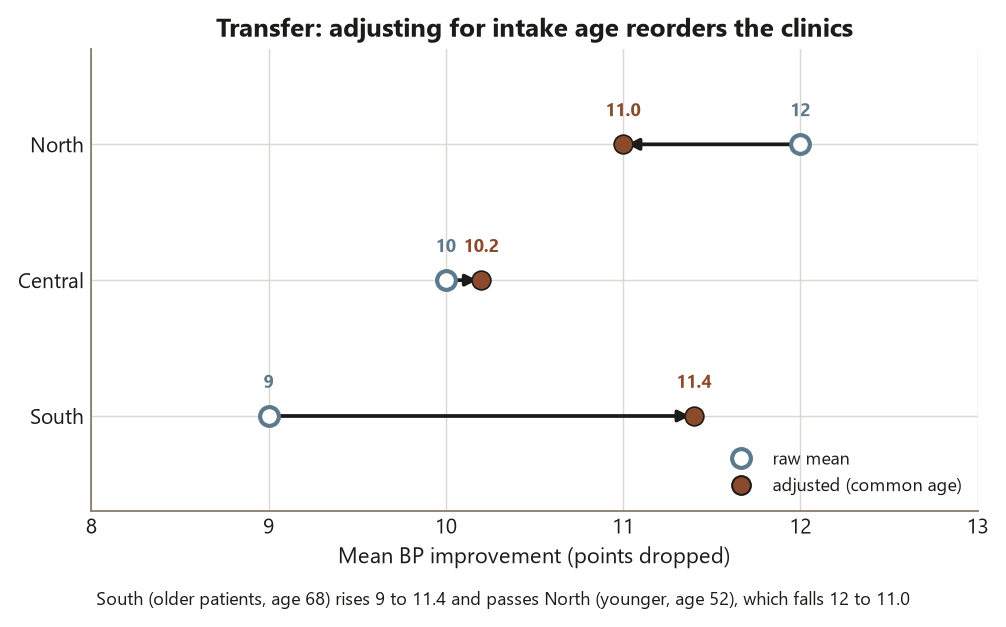
The interpretation. This is the headline transfer lesson: adjustment can reverse a ranking, not just shrink gaps. A raw comparison that ignores who each clinic serves can credit or blame a clinic for its patient mix rather than its care. The same disciplines apply as in Dataset F — check that one age slope fits all clinics (parallel slopes) before trusting a single set of adjusted means, adjust only for the pre-treatment covariate (age at intake, not a post-care measurement), and keep the conclusion at association: even adjusted, this is observational, so it suggests which clinic does better for comparable patients, not that assigning a patient to that clinic would cause a better outcome.
A common mistake
This week’s classic applied-methods error is adjusting carelessly — and it shows up in three closely related ways, each of which quietly breaks the comparison.
The first is skipping the parallel-slopes check. Students fit lm(final ~ pretest + format), read off the adjusted means, and report the format \(F\) — without ever testing the format\(\times\)pretest interaction. If the slopes are not parallel (a pretest point is worth more in one format than another), then no single common slope describes the data, the “adjusted mean at the grand pretest” is not a stable summary of a group, and the format effect genuinely depends on baseline — there is no one answer to report. The fix is to fit the interaction model first (lm(final ~ pretest * format)), test pretest:format, and only proceed to the common-slope ANCOVA if that interaction is negligible. For Dataset F it is (\(p \approx 0.5\)), so we are clear — but the check is what licenses the move, not a hope that the slopes match.
The second, and most damaging, is adjusting for a post-treatment covariate. The whole legitimacy of adjustment rests on the covariate being a fixed starting condition that the treatment could not have changed. The pretest qualifies; a variable measured after the formats acted does not. If you “control for” a mid-semester quiz score — which the format itself influenced — you are conditioning on a step on the causal path from format to final score, subtracting away part of the format’s real effect and biasing the comparison toward zero. The result looks tidy and is more wrong than the raw means. The rule is absolute: adjust only for what was measured before the grouping could act. A cleaner-looking number from the wrong covariate is not an improvement.
The third is confusing adjusted and unadjusted means in the write-up — reporting the raw \(L\,74\), \(LL\,81\), \(O\,70\), \(H\,79\) in a sentence whose claim (“after accounting for baseline…”) only the adjusted \(74.5\), \(80.6\), \(70.9\), \(78.1\) can support, or vice versa. They are different estimates answering different questions: raw means describe the groups as they were; adjusted means describe them at a common baseline. Name which one you are quoting every single time, and never let an “after adjusting for pretest” claim ride on the raw numbers.
Low-stakes self-checks (ungraded)
These are for your own practice — ungraded, no submission.
- In one sentence, say what an adjusted format mean is — using the phrase “at a common pretest” — and how it differs from a raw format mean.
- Dataset F’s pretest means are \(L\,61\), \(LL\,63\), \(O\,60\), \(H\,64\), and its raw final means are \(L\,74\), \(LL\,81\), \(O\,70\), \(H\,79\). Explain in one or two sentences why the baseline difference is a confounder here (what makes it align with the outcome), and predict the direction Online’s mean moves after adjustment.
- The format effect’s \(\eta^2_{\text{partial}} \approx 0.16\) after adjustment, down from the raw \(\eta^2 \approx 0.19\). Write one sentence saying what that drop means about how much of the raw “format effect” was really a baseline effect.
- A classmate reports the adjusted means but never tested the format\(\times\)pretest interaction. Name what they skipped, and say in one sentence what could be wrong with their adjusted means if the slopes are not parallel.
- Someone proposes adjusting the clinic comparison for a post-care satisfaction survey instead of intake age. Explain in one sentence why that is the wrong kind of covariate and which direction it would bias the comparison.
- The format \(F \approx 6.2\) on \((3,95)\), \(p \approx 0.0007\). Write one sentence interpreting this as an association with its uncertainty, and one sentence stating what it cannot conclude about whether a format causes a higher final score, given the observational design.
Reading and source pointer
This week is grounded in the instructor notes (the primary course materials) for the adjustment framing — confounding, adjusted versus raw means, and the discipline of pre-treatment covariates — with the IMS (Çetinkaya-Rundel & Hardin) treatment of regression with a categorical and a quantitative predictor for the model structure and notation, read here as the ANCOVA model that carries a factor and a covariate together. ISLBS (Vu & Harrington) is an optional applied reference for covariate adjustment in a health-flavored setting, useful for the clinic-style transfer example. These notes are the course’s own synthesis, grounded in but not copied from the sources. No prose, examples, exercises, figures, or solutions are reproduced from any source.
Public vs. graded
These notes, the examples, and the practice here are public and ungraded — study material only. No graded prompts, answer keys, rubrics, point values, or due dates appear on this site. Graded applied-methods checkpoints, weekly quizzes, homework and analysis memos, applied analysis labs, the midterm, the applied methods project, and the final exam live in Blackboard (the LMS), which is authoritative for due dates, submissions, and grades. If this page and Blackboard ever disagree, follow Blackboard.
Looking ahead
Next week the outcome itself changes type. So far the response has been a quantitative score — a mean to compare, a slope to estimate, an adjusted mean to report. Next week the outcome becomes categorical: counts and proportions in a contingency table (pass versus fail across support programs), where the estimate is a risk difference, a relative risk, or an odds ratio, and the test is a chi-square. The confounding-and-adjustment thread continues — the program comparison is observational too — but the new discipline is to measure association in a table without overclaiming causation, and to read what a proportion gap can and cannot support.
See also
- Week 10 — Simple & multiple regression review — the partial slope that drops under adjustment (\(1.6 \to 1.1\)); ANCOVA is that same adjustment idea with a grouping factor.
- Week 6 — Many-group comparisons & one-way ANOVA — the raw format means (\(74\) / \(81\) / \(70\) / \(79\)) and the unadjusted format \(F \approx 7.61\) this week adjusts.
- Week 12 — Categorical outcomes & contingency tables — the outcome turns categorical; association in a table, observational again.
- Method chooser — the question\(\to\)structure\(\to\)method decision guide; where a covariate sends you to ANCOVA.
- Reporting & interpretation guide — adjusted versus raw means, effect sizes, practical versus statistical significance, association versus causation.