Week 9 — Two-way ANOVA & interaction
Two factors at once — and why the interaction comes first
The week question
For six weeks you have compared groups defined by one factor at a time: pre versus post, Support versus Self-guided, four instructional Formats. The world rarely arranges itself so neatly. This week the Cypress Ridge study asks a richer question: students were taught under two Delivery modes — In-person and Online — but they also arrived with different prior Background in quantitative reasoning — Weak or Strong. Both things plausibly move the final score, and they are crossed: every combination of Delivery and Background actually occurs. So the week’s question is not just “does Delivery matter?” and not just “does Background matter?” — it is the sharper, three-part question a \(2\times 2\) factorial lets you ask: does Delivery matter, does Background matter, and — the part that changes how you read everything else — does the effect of Delivery depend on Background?
That last piece is the interaction, and the whole discipline of the week is summarized in the subtitle: when you analyze two factors at once, you look at the interaction first. If the effect of one factor changes depending on the level of the other, then any single “main effect” number you report is an average that hides the real story — and reporting it as if it were uniform is the classic two-way error. The blueprint still runs the same six steps; the new wrinkle is that step 6, the conclusion, has to be read in the right order.
Why this matters
Most applied questions are multi-factor questions wearing a single-factor costume. A registrar wants to know whether moving a course online hurts outcomes — but “hurts outcomes” almost never means “hurts every student by the same amount.” It might hurt students who arrive under-prepared a great deal and barely touch students who arrive well-prepared, or the reverse. A one-factor analysis that collapses across background would report a single average penalty and quietly erase exactly the distinction a dean needs to make a decision. Two-way ANOVA is how you keep those two questions — which factor and for whom — visible at the same time.
It matters for a second, more structural reason. Adding a second factor changes what counts as “unexplained” variation. In a one-way ANOVA, everything that is not the Format effect is dumped into the within-group error. The moment you bring Background into the model, the portion of score variation that is really due to background is pulled out of the error term and named. That can sharpen every test on the page — but only if you model the two factors and their interaction honestly. So the week is not just “now there are two boxplots.” It is a genuine modeling step: you are writing a model with main effects and an interaction term, and the order in which you read its pieces is itself a piece of statistical reasoning. Get the order wrong and you will report a true number that tells a false story.
Learning goals
By the end of this week you should be able to:
- Recognize a factorial design — two (or more) crossed categorical factors, every combination present — and state the unit of analysis, the response, and each factor with its levels.
- Define a main effect as a comparison of marginal means (averaging over the other factor), and compute and read the Delivery and Background marginals for Dataset X.
- Define an interaction as non-additivity — the effect of one factor changing across levels of the other — and read it off a cell-means (interaction) plot as non-parallel lines and off an interaction contrast as a single number.
- Read a two-way ANOVA table: the three \(F\)-tests (two main effects and one interaction), each with its \(p\)-value, and say what each row tests.
- Apply the week’s ordering rule — read the interaction first — and explain why a significant interaction makes each main effect conditional, so you must not report a marginal difference as if it applied uniformly.
- Name the blueprint move for a two-way ANOVA: what is assumed (additivity is tested, not assumed; plus the usual ANOVA conditions), what is estimated (cell means, marginal differences, and the interaction contrast, each reportable with uncertainty), and what it cannot establish (a causal reading from an observational crossing).
Core vocabulary
- Factor / level — a categorical explanatory variable (here Delivery, with levels In-person and Online; and Background, with levels Weak and Strong). Each factor partitions the students into groups.
- Factorial (crossed) design — every combination of factor levels appears. A \(2\times 2\) design has \(2\times 2 = 4\) cells; Dataset X has \(n = 20\) students per cell, \(N = 80\).
- Cell mean — the average response in one factor-combination (e.g., the In-person/Weak cell mean is \(73\)). The four cell means are the raw material the whole analysis reads.
- Marginal mean — the average for one level of a factor, averaging over the other factor. The In-person marginal mean averages the In-person/Weak and In-person/Strong cells.
- Main effect — the difference between the marginal means of a factor (Delivery’s main effect compares the In-person and Online marginals). It is a comparison averaged over the other factor.
- Interaction — non-additivity: the effect of one factor differs across levels of the other. Equivalently, the cell means cannot be reconstructed by simply adding a Delivery effect and a Background effect.
- Interaction (cell-means) plot — cell means plotted with one factor on the axis and the other shown as separate lines. Parallel lines \(\Rightarrow\) no interaction (additive); non-parallel lines \(\Rightarrow\) interaction.
- Interaction contrast — a single number measuring non-additivity: a difference of differences. For a \(2\times 2\), it is (In-person advantage for Weak) \(-\) (In-person advantage for Strong).
- Two-way ANOVA table — three rows of interest: the Delivery main-effect \(F\), the Background main-effect \(F\), and the Delivery\(\times\)Background interaction \(F\), each with a \(p\)-value.
Concept development
Factorial designs and main effects (marginal means)
Run the blueprint’s first two steps. The question is comparative and conditional: how does final score differ by Delivery, by Background, and does one depend on the other? The structure: the unit of analysis is the student; the response \(Y\) is the final exam score (quantitative, \(0\)–\(100\)); there are two grouping factors, each with two levels, fully crossed; the design is observational (students were not randomly assigned to be Weak or Strong, and — for this week’s reading — we treat Delivery as a fixed classification of their section). Because both factors are present at once, the natural first summary is the table of four cell means.
For Dataset X the locked cell means are (data synthetic; seed set, set.seed(35203)):
\[ \begin{array}{l|cc} & \text{Weak} & \text{Strong} \\ \hline \text{In-person} & 73 & 85 \\ \text{Online} & 62 & 83 \end{array} \]
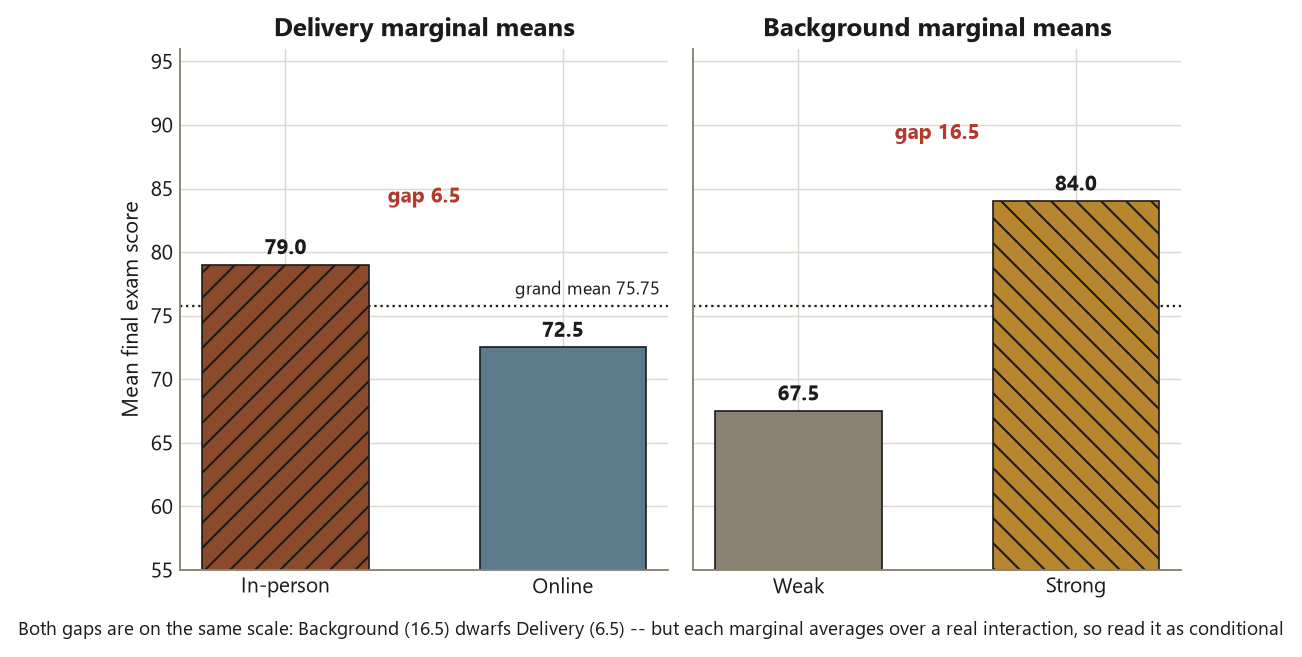
A main effect is read from the marginal means — average each row and each column. Averaging over Background, the Delivery marginals are
\[ \bar Y_{\text{In-person}} = \tfrac{73 + 85}{2} = 79, \qquad \bar Y_{\text{Online}} = \tfrac{62 + 83}{2} = 72.5, \]
a Delivery gap of \(79 - 72.5 = 6.5\) points in favor of In-person. Averaging over Delivery, the Background marginals are
\[ \bar Y_{\text{Weak}} = \tfrac{73 + 62}{2} = 67.5, \qquad \bar Y_{\text{Strong}} = \tfrac{85 + 83}{2} = 84, \]
a Background gap of \(84 - 67.5 = 16.5\) points in favor of Strong. The grand mean is the average of all four cells, \(\tfrac{73 + 85 + 62 + 83}{4} = 75.75\). So far this looks like two one-way comparisons stacked together: Strong students outscore Weak students by a lot, and In-person edges Online by a little. Hold that reading loosely — the next subsection is about whether those marginal numbers can be trusted to mean what they appear to mean.
The interaction: non-additivity and non-parallel lines
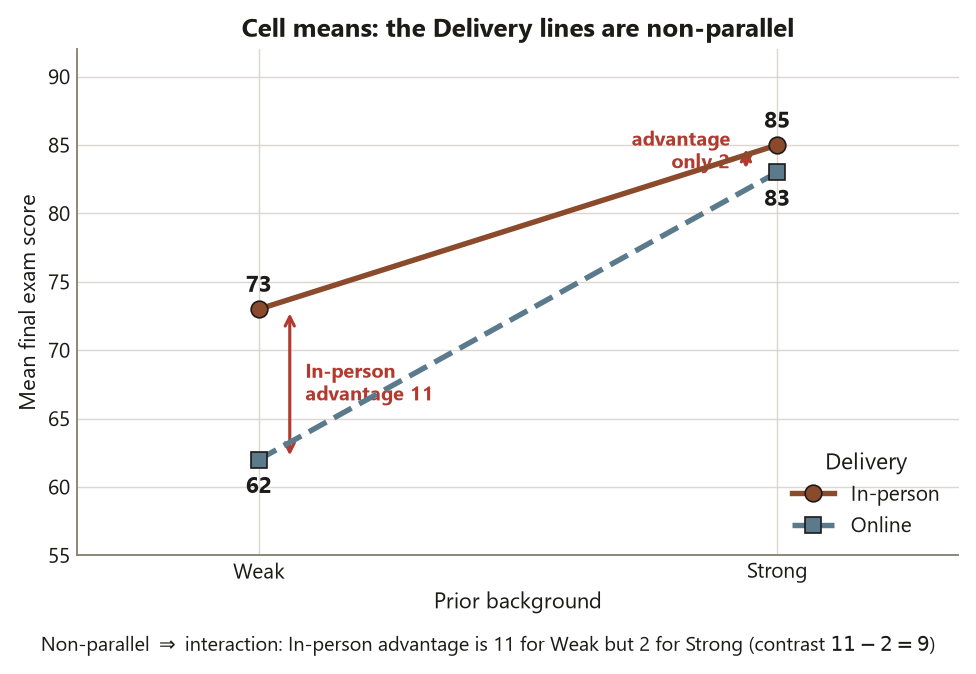
A main-effect-only (“additive”) model claims the four cell means can be rebuilt by adding a Delivery effect and a Background effect to the grand mean — that the Delivery penalty is the same whether a student is Weak or Strong. Test that claim by looking inside the cells rather than at the margins. Compute the In-person advantage separately at each Background level:
\[ \text{In-person advantage} \mid \text{Weak} = 73 - 62 = 11 \text{ points}, \]
\[ \text{In-person advantage} \mid \text{Strong} = 85 - 83 = 2 \text{ points}. \]
These two numbers are not equal — \(11\) versus \(2\) — and that inequality is the interaction. The effect of Delivery depends on Background: moving online costs Weak-background students about \(11\) points but costs Strong-background students only about \(2\). Summarize the non-additivity in one number, the interaction contrast — a difference of differences:
\[ \hat\psi_{\text{int}} = (73 - 62) - (85 - 83) = 11 - 2 = 9 \text{ points}. \]
If the design were perfectly additive, this contrast would be \(0\) (the two within-Background advantages would match). It is \(9\), and that is large relative to the within-cell noise. On the cell-means plot, put Background on the axis and draw one line for In-person and one for Online: the In-person and Online lines fan apart as you move from Strong toward Weak rather than running parallel. Parallel lines mean no interaction; these lines are clearly non-parallel. The picture and the contrast say the same thing in two languages — there is no single “Delivery effect,” there are two, one per Background level.
Reading the interaction first — and why the main effects are conditional
Now the formal test, and the ordering rule that gives the week its name. The two-way ANOVA produces three \(F\)-tests (locked, on a within-cell \(\mathrm{MSE} = 81\) with \(76\) error df):
- Delivery main effect: \(F \approx 10.4\) on \((1, 76)\), \(p \approx 0.002\).
- Background main effect: \(F \approx 67.2\) on \((1, 76)\), \(p < 0.001\).
- Delivery \(\times\) Background interaction: \(F \approx 5.0\) on \((1, 76)\), \(p \approx 0.028\) (its \(\mathrm{SS}_{\text{int}} = 405\)).
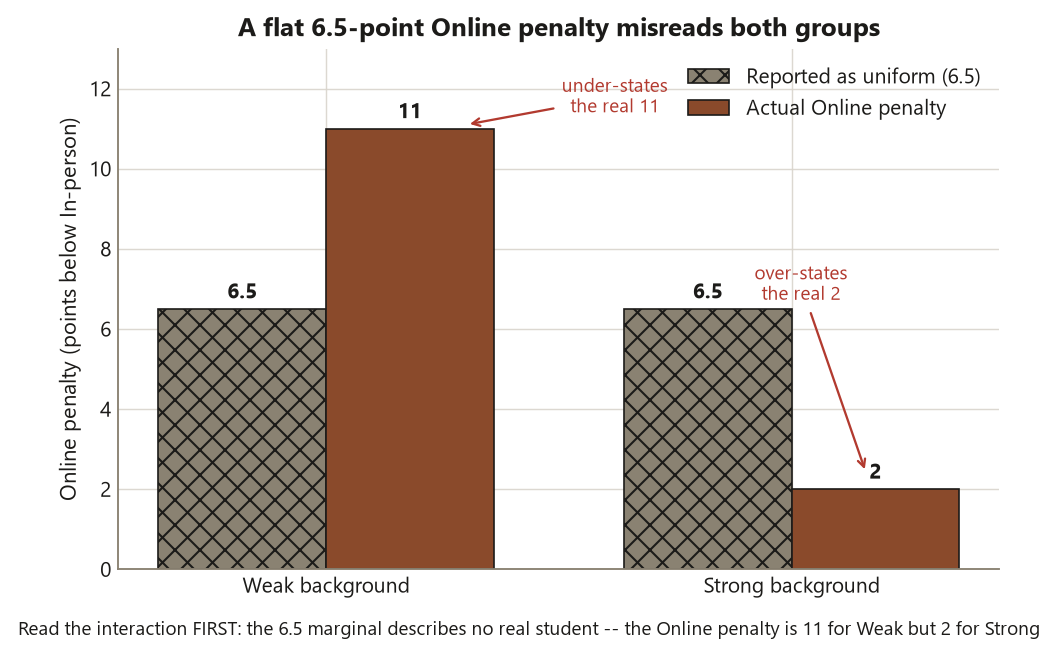
Read the interaction row first. It is significant (\(p \approx 0.028\)): the data reject additivity, so the \(9\)-point interaction contrast is unlikely to be sampling noise. The consequence is the heart of the week. Because the interaction is real, each main effect is conditional — the marginal Delivery gap of \(6.5\) points is a blend of an \(11\)-point gap for Weak students and a \(2\)-point gap for Strong students, and it describes neither group. Reporting “Online is \(6.5\) points worse” as though it applied uniformly would be true as an average and misleading as a statement, because it hides the fact that the online penalty is concentrated almost entirely on the weak-background students.
So the ordering rule is not bureaucratic; it changes the sentence you are allowed to write. When the interaction is significant, you describe the cell means / the conditional (simple) effects — “Online costs weak-background students about \(11\) points but strong-background students only about \(2\)” — and you present the marginal main effects, if at all, with an explicit caveat that they average over a real interaction. When the interaction is not significant, you are licensed to read the main effects as clean, roughly uniform effects, because additivity was a reasonable approximation. Here it is significant, so the conditional reading governs. (Step 4, assumptions: a two-way ANOVA still assumes roughly normal, equal-variance within-cell residuals and independent observations; here the common within-cell SD \(\approx 9\) and the cells are balanced at \(n = 20\), which keeps the \(F\)-tests well-behaved. Crucially, additivity is not an assumption you make — it is the hypothesis the interaction term tests.)
Worked examples
Worked example — Dataset X: the two-way ANOVA, interaction plot read first (recurring slice)
The question and structure. Does final score depend on Delivery, on Background, and does Delivery’s effect depend on Background? Unit of analysis: the student. Response \(Y\): final exam score (quantitative). Two crossed factors: Delivery {In-person, Online} and Background {Weak, Strong}, \(n = 20\) per cell, \(N = 80\). Observational crossing. Data synthetic; seed set.
Assumptions and diagnostics. Within-cell residuals roughly normal and equal-variance (common SD \(\approx 9\), so \(\mathrm{MSE} = 81\) on \(76\) df); observations independent (different students); design balanced. Additivity is not assumed — the interaction term tests it.
The computation. Fit the model with both main effects and their interaction, then look at the table and the cell-means plot. The static R below shows the idiom; it is teaching code and is not executed here.
set.seed(35203)

# Dataset X: 2x2 factorial, final score by Delivery x Background.
# Synthetic; n = 20 per cell, N = 80. Cell means (locked):
#   In-person/Weak 73, In-person/Strong 85, Online/Weak 62, Online/Strong 83.
# (score, delivery, background assumed already in a data frame `x`.)

fit <- aov(score ~ delivery * background, data = x)   # '*' = both mains + interaction
summary(fit)

#                       Df  Sum Sq  Mean Sq  F value   Pr(>F)
# delivery               1     ~845      845    ~10.4    0.002   **
# background             1    ~5445     5445    ~67.2   <0.001   ***
# delivery:background    1      405      405     ~5.0    0.028   *      <- read FIRST
# Residuals             76     6156       81

# Read the interaction BEFORE the main-effect rows.
# Cell-means (interaction) plot: non-parallel lines => interaction is real.
interaction.plot(x$background, x$delivery, x$score,
                 fun = mean, legend = TRUE,
                 xlab = "Prior background", ylab = "Mean final score",
                 trace.label = "Delivery")

# Interaction contrast (difference of differences):
#   (73 - 62) - (85 - 83) = 11 - 2 = 9 points
# In-person advantage is 11 pts for Weak but only 2 pts for Strong.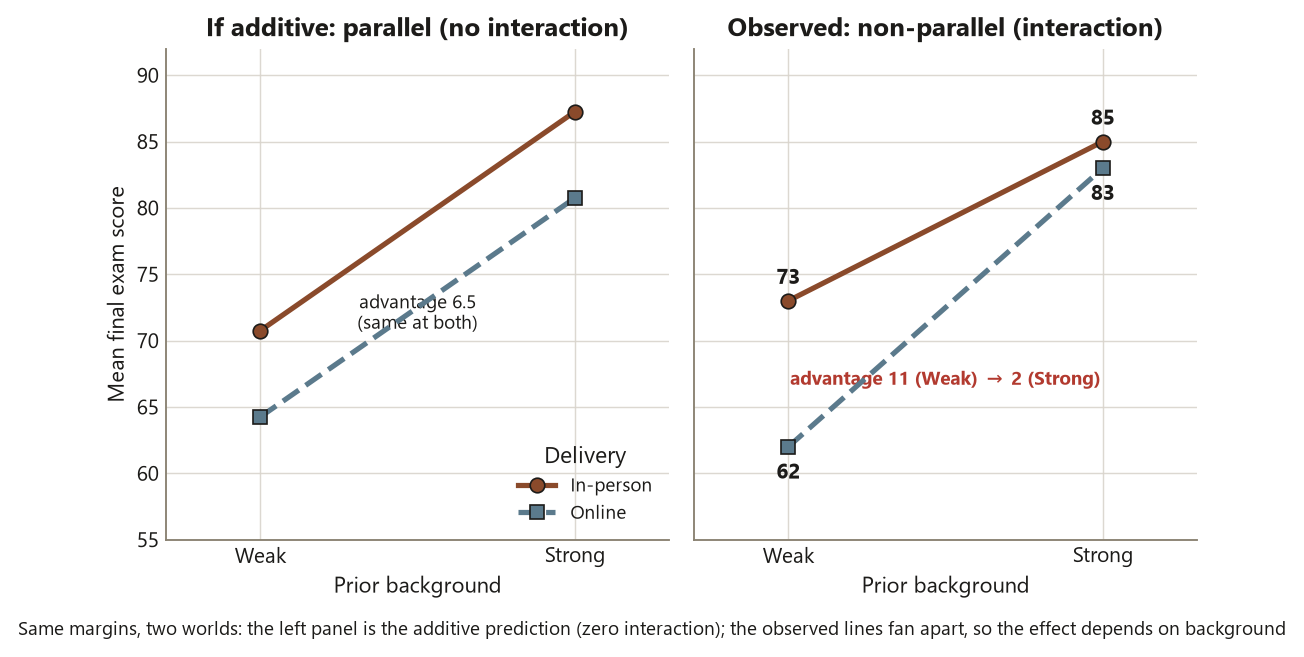
The estimate with its uncertainty. The headline estimates are the four cell means and the interaction contrast of \(9\) points — the difference between the \(11\)-point In-person advantage for Weak students and the \(2\)-point advantage for Strong students. That contrast is what the interaction \(F \approx 5.0\) (\(p \approx 0.028\)) tests, and you would report it with a confidence interval (a contrast like this has \(\mathrm{SE} = \sqrt{\mathrm{MSE}\sum c_j^2 / n} = \sqrt{81\cdot 4/20} \approx 4.0\), so the interval comfortably excludes \(0\)), never as a bare \(p\)-value. The marginal Delivery gap (\(6.5\)) and Background gap (\(16.5\)) are the main-effect estimates, but — because the interaction is significant — the Delivery marginal is reported with its caveat, not as a uniform effect.
The conclusion. Statistically, all three terms are significant, and the interaction is the one that governs interpretation: Delivery’s effect depends on Background. Practically, the message is specific and useful — going Online especially hurts weak-background students (an \(\approx 11\)-point drop) while barely affecting strong-background students (\(\approx 2\) points). Note the boundary: Background was not randomly assigned, and the Delivery classification is observational, so this is association, not causation — weak-background students who ended up online may differ in other ways too. The honest applied takeaway is “Online and weak background together flag a group to support,” not “Online causes an \(11\)-point drop.”
Worked example — a drug \(\times\) diet trial on blood pressure (transfer, new context)
The question and structure. A clinic runs a \(2\times 2\) trial: a blood-pressure Drug {Active, Placebo} crossed with a Diet {Low-sodium, Usual}. The response is systolic blood pressure (mmHg, quantitative); the unit is the patient; both factors have two levels, fully crossed. These numbers are illustrative and distinct from Dataset X. Suppose the four cell means (in mmHg) come out as:
\[ \begin{array}{l|cc} & \text{Low-sodium} & \text{Usual} \\ \hline \text{Active} & 124 & 128 \\ \text{Placebo} & 130 & 134 \end{array} \]
The computation and what the plot would mean. The whole skill transfers: build the cell-means plot and ask whether the two Drug lines are parallel. Here the Active-drug advantage is the same at both diets — \(130 - 124 = 6\) mmHg under Low-sodium and \(134 - 128 = 6\) mmHg under Usual — so the interaction contrast is \((130-124) - (134-128) = 6 - 6 = 0\). On the plot the Active and Placebo lines run parallel: the drug lowers pressure by about \(6\) mmHg regardless of diet, and the diet raises it by about \(4\) mmHg regardless of drug. That is the additive picture — no interaction — and it is exactly the case where you are allowed to report the main effects cleanly: “the drug lowers systolic pressure by about \(6\) mmHg” is honest because the effect really is (approximately) uniform across diets.
Now contrast the non-parallel pattern. Suppose instead the Placebo/Usual cell were \(134\) but the Active/Usual cell were \(132\) (a smaller drug benefit when diet is poor). Then the Active advantage would be \(6\) mmHg under Low-sodium but only \(2\) mmHg under Usual — the lines fan apart, the interaction contrast is \(6 - 2 = 4\), and the conclusion changes shape: the drug helps most when paired with a good diet, so you would not report a single “\(6\) mmHg drug effect.” Same design, same plot, opposite reading — and the plot is what tells you which world you are in. The blueprint move is identical to Dataset X: read the interaction (the parallelism) first, and let it decide whether a single main-effect sentence is allowed. If the trial randomized Drug and Diet, a significant effect could support a causal reading — the design, not the test, earns that warrant.
A common mistake
This week’s classic applied-methods error is reporting the main effects as if they applied uniformly when the interaction is significant — and, upstream of it, skipping the interaction plot entirely.
The error usually looks like this. A student fits aov(score ~ delivery * background), glances at the table, sees the Delivery row is significant, and writes “Online students score \(6.5\) points lower.” That sentence is arithmetically true of the marginal means and substantively wrong, because the \(6.5\) is an average of an \(11\)-point penalty for weak-background students and a \(2\)-point penalty for strong-background students. No actual student experiences a uniform \(6.5\)-point Online effect; the number describes a blend that exists only on the margin. When the interaction term is significant — here \(F \approx 5.0\), \(p \approx 0.028\) — the marginal main effect is conditional, and a flat statement about it misrepresents the data to anyone who reads it.
The deeper version of the mistake is never looking at the cell-means plot. The ANOVA table can tell you an interaction is significant, but only the plot shows you its shape — which group the online penalty lands on, and how steeply the lines fan. A student who reads the table but skips the plot might notice “there’s an interaction” and still fail to extract the one useful fact: that it is specifically the weak-background, online students who are falling behind. The fix is a habit and an order: draw the interaction plot first, read the interaction \(F\) first, and only then decide whether the main effects can be reported as uniform effects or must be reported conditionally. A mirror-image mistake also lurks — over-reading a non-significant interaction (say \(p \approx 0.4\)) as a meaningful “it depends” when the data are consistent with additivity; there, the honest move is to report the clean main effects. Let the interaction test, read first, decide which sentence you are allowed to write.
Low-stakes self-checks (ungraded)
These are for your own practice — ungraded, no submission.
- State Dataset X’s design in blueprint language: the unit of analysis, the response and its type, and each factor with its levels. How many cells, and how many students per cell?
- From the four locked cell means, compute the Delivery marginal means and the Background marginal means, and give each main-effect gap. Which factor has the larger marginal effect?
- Compute the In-person advantage separately for Weak and for Strong students, then the interaction contrast as a difference of differences. Confirm it equals \(9\).
- The interaction \(F \approx 5.0\) has \(p \approx 0.028\). In one sentence, say what that lets you conclude about additivity — and in a second sentence, say why it makes the \(6.5\)-point Delivery marginal a conditional number rather than a uniform one.
- Sketch (or describe in words) the cell-means plot for Dataset X with Background on the axis and one line per Delivery mode. Are the lines parallel or non-parallel, and which group is the online penalty concentrated on?
- In the drug \(\times\) diet transfer example, the first set of numbers gave an interaction contrast of \(0\). Explain why that licenses a single “\(6\) mmHg drug effect” sentence, and describe one change to the cell means that would make that sentence dishonest.
- A classmate reports “Online is \(6.5\) points worse, Strong students are \(16.5\) points better” and stops there. Name what they skipped and write one sentence that corrects the Delivery claim. Then state, in one sentence, why none of this can be called causal for Dataset X.
Reading and source pointer
This week is grounded in the instructor notes (the primary course materials) for factorial designs, main effects, and the read-the-interaction-first discipline, with the IMS (Cetinkaya-Rundel & Hardin) treatment of models with two categorical predictors for the concept sequence — cell means, marginal means, additivity versus interaction, and reading a two-way model’s table. ISLBS (Vu & Harrington) is named here only as an optional applied reference for factorial designs in a health/applied setting; it is not a primary text and nothing is reproduced from it. These notes are the course’s own synthesis, grounded in but not copied from the sources. No prose, examples, exercises, figures, or solutions are reproduced from any source.
Public vs. graded
These notes, the examples, and the practice here are public and ungraded — study material only. No graded prompts, answer keys, rubrics, point values, or due dates appear on this site. Graded applied-methods checkpoints, weekly quizzes, homework and analysis memos, applied analysis labs, the midterm, the applied methods project, and the final exam live in Blackboard (the LMS), which is authoritative for due dates, submissions, and grades. If this page and Blackboard ever disagree, follow Blackboard.
Looking ahead
Next week we review regression — the line as an applied tool for describing a relationship, making a prediction, and adjusting for a competing explanation — and we meet the partial (adjusted) slope, the regression cousin of this week’s “it depends.” Watch for the same logic in new clothing: just as a significant interaction made a Delivery main effect conditional, bringing a second predictor into a regression will change what a slope means, because the adjusted slope holds the other variable fixed. Two-way ANOVA and multiple regression are two faces of the same modeling idea — more than one input at once, read carefully.
See also
- Week 8 — Multiple comparisons & planned contrasts — controlling error rates and building a planned contrast, the one-factor groundwork for this week’s interaction contrast.
- Week 10 — Simple & multiple regression review — more than one predictor at once, and the partial (adjusted) slope.
- Week 11 — ANCOVA & adjustment — a factor plus a quantitative covariate, where parallel slopes is the assumption that lets you compare adjusted means.
- Method chooser — the question \(\to\) structure \(\to\) method decision guide; find where “two crossed factors” lands.
- Methods glossary — main effect, interaction, cell mean, marginal mean, interaction contrast.