Lab 13 — Logistic regression & odds ratios
Model a binary outcome and read odds ratios and predicted probabilities in R
Purpose. This lab is the hands-on companion to Week 13 — Logistic regression for binary outcomes. The note argues that when the outcome is a yes/no pass, ordinary linear regression is the wrong model — it predicts impossible “probabilities” outside \([0, 1]\) and forces a constant effect on a quantity that physically tapers near its floor and ceiling — and that logistic regression fixes both by modeling the log-odds with a linear predictor. The catch is that the coefficients then live on a scale no human reads directly, so the whole craft is translation: exponentiate a coefficient to an odds ratio, and run the linear predictor back through the S-curve to a predicted probability. Here you build that pipeline in R. You will encode Dataset R, fit
glm(pass ~ hours + pretest + program, family = binomial), exponentiate the coefficients to odds ratios (about \(1.25\) per study-hour and about \(2.72\) for Structured versus None — down from the raw \(3.67\) of week 12), and compute predicted probabilities for two specific students (about \(0.56\) and about \(0.05\)). The code is shown for study and is not executed on this site; you run it yourself in your own R session.
The idea
A logistic regression hands you a fitted model for a binary outcome — here pass \(= (\text{final} \ge 70)\) — and the temptation is to read its coefficients the way you read an ordinary regression slope. That temptation is the single most common mistake of the week, and this lab is built to inoculate you against it by making the three scales of the model concrete and keeping them visibly separate the whole way through.
The model is a regression, but not on the probability \(p\) and not even on the odds \(p/(1-p)\). It is a linear model on the log-odds,
\[ \operatorname{logit}(p) = \ln\frac{p}{1-p} = b_0 + b_1\cdot\text{hours} + b_2\cdot\text{pretest} + b_3\,[\text{Drop-in}] + b_4\,[\text{Structured}] . \]
The log-odds runs over all the real numbers, which is exactly why a linear predictor can live on it without ever crashing into the \(0\)/\(1\) ceiling that wrecks a line fit to a \(0/1\) response. So the fit itself is straightforward — glm(..., family = binomial) finds the coefficients by maximum likelihood — and the work, the interpretive work the course cares about, is everything that happens after the fit. You have to move off the log-odds scale, because no reader thinks in log-odds, and there are exactly two honest destinations.
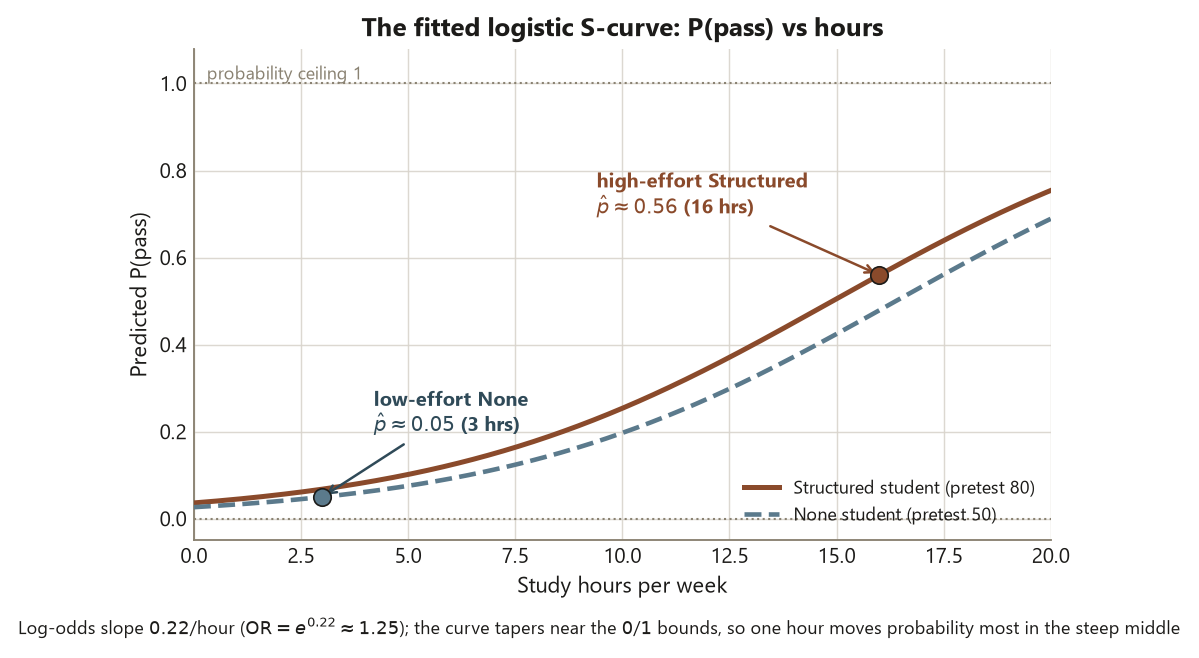
The first destination is the odds ratio. Exponentiate a coefficient, \(e^{b_k}\), and you get the multiplicative factor by which the odds of passing change for a one-unit increase in that predictor, holding the others fixed. The hours coefficient \(0.22\) becomes \(e^{0.22} \approx 1.25\): each extra study-hour multiplies the odds of passing by about \(1.25\). The Structured coefficient \(1.0\) becomes \(e^{1.0} \approx 2.72\): a Structured student has about \(2.72\) times the odds of an otherwise-identical None student. An odds ratio is the natural effect measure for a logistic coefficient, the same way a slope was the natural effect measure for an ordinary regression — and like every estimate in this course, you report it with a confidence interval, never as a bare coefficient and never as a lone p-value.
The second destination is the predicted probability. The odds ratio is constant — one more hour multiplies the odds by \(1.25\) no matter where you start — but what that does to the probability depends entirely on where you sit on the S-curve, \(\hat p = 1/(1 + e^{-\hat\eta})\). Near the steep middle, one hour might move probability several points; out near \(0.05\) or \(0.95\), the same hour barely nudges it. So you never read a coefficient, or even its odds ratio, as a fixed change in probability. To talk about probability you pick specific predictor values, form the linear predictor \(\hat\eta\), and run it through the inverse logit — which is what predict(type = "response") does for you. The two students in this lab come out at about \(0.56\) and about \(0.05\): far apart, both safely inside \((0, 1)\), and far more useful to a reader than the raw logit ever could be.
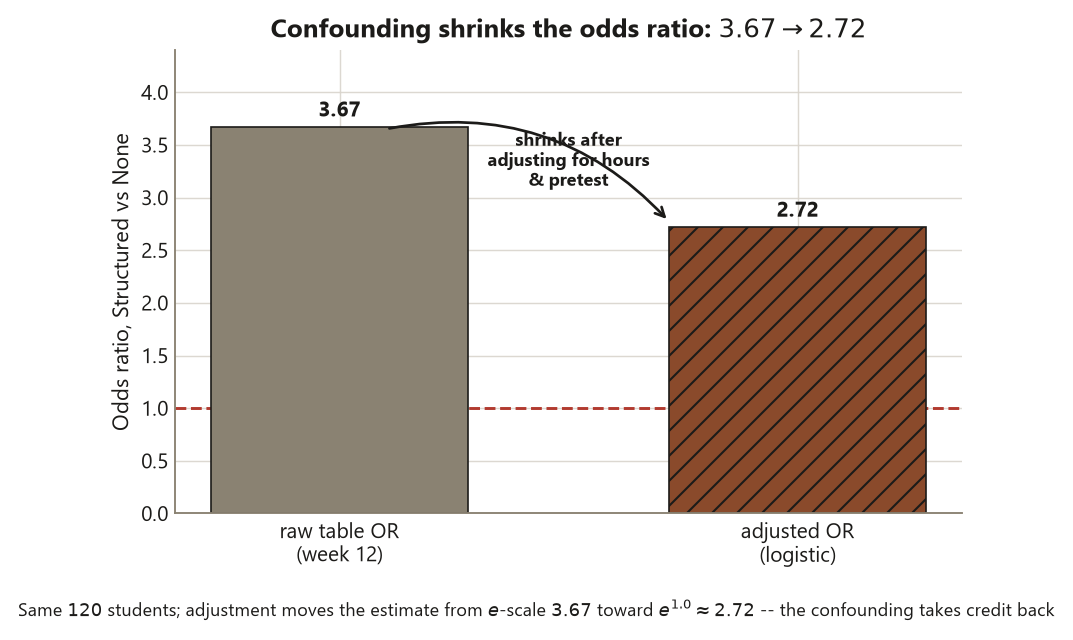
One framing detail makes this lab the logistic climax of the course’s confounding throughline rather than an isolated model. The adjusted Structured odds ratio of about \(2.72\) is smaller than the raw \(3.67\) you computed from the week-12 contingency table, and that shrinkage is the same story as the regression slope falling \(1.6 \to 1.1\) and the ANCOVA gaps narrowing once the pretest was controlled. Students who landed in the Structured program also tended to study more and start higher; the raw table quietly credited those advantages to the program, and adjustment takes that credit back. The arithmetic changes; the world does not. And because students chose their programs, the adjusted odds ratio buys a better-described association, never a causal claim.
Goal
By the end of this lab you should be able to:
- Encode the Dataset R slice in R with a fixed seed — pass (binary), hours, pretest, and program with None as the reference level — and name the student as the unit of analysis.
- Fit
glm(pass ~ hours + pretest + program, family = binomial)and read the coefficients on the log-odds scale fromsummary(), recognizing that none of them is a probability or a slope on probability. - Exponentiate the coefficients with
exp(coef(fit))to odds ratios (\(\approx 1.25\) per study-hour, \(\approx 2.72\) for Structured versus None) and attach intervals withexp(confint(fit)), so every estimate is reported with its uncertainty. - Explain why the adjusted Structured odds ratio of about \(2.72\) shrinks from the raw \(3.67\) of week 12 — confounding by hours and pretest — and why that is the same story as the \(1.6 \to 1.1\) slope drop.
- Compute predicted probabilities for two specific students with
predict(type = "response")(\(\approx 0.56\) for a high-effort Structured student, \(\approx 0.05\) for a low-effort None student) and interpret them on the probability scale. - State the two limits in words: the odds ratio is not a relative risk (passing is common here), and the observational design buys association, not causation.
The point of the lab is the translation discipline: a logistic fit is easy to run and easy to misread, so you practice moving deliberately between the log-odds, the odds-ratio, and the probability scales and never confusing them. The code is the means, not the message. Name the blueprint move as you go: the structure is a binary response with mixed-type predictors, the method that matches it is logistic regression, the estimate is an odds ratio with its interval (plus a predicted probability for a concrete profile), and the conclusion is an adjusted association — statistical, not necessarily practical, and never causal on observational data.
Setup
You need only base R for the fit — glm(), coef(), confint(), and predict() are all in the stats package — so no extra libraries are required to follow the logic. Every chunk that draws randomness starts with set.seed(35203), the course-wide seed, so your run reproduces the locked Dataset R numbers. The data are synthetic; seed set — these are not real student records.
Fix the design facts before any code runs, because every interpretation below follows from them:
- Unit of analysis: the individual student. There are \(n = 120\) students; each contributes one pass/fail outcome and one set of predictor values.
- The response: pass, a binary outcome coded \(1 = \text{pass}\) (final \(\ge 70\)) and \(0 = \text{fail}\). The model targets \(p = \Pr(\text{pass} = 1 \mid X)\) — the probability of passing given the predictors.
- The predictors: hours (study hours/week, \(0\)–\(20\), quantitative), pretest (baseline readiness, \(0\)–\(100\), quantitative), and program (support program, categorical with three levels — None, Drop-in, Structured, \(40\) students each — with None as the reference).
- The design: observational. Students self-selected into programs; nothing was randomly assigned. So any odds ratio you estimate is an adjusted association, not a causal effect, no matter how clean the model output looks.
- The locked model (week 13): \(\operatorname{logit}(\hat p) = b_0 + 0.22\cdot\text{hours} + 0.04\cdot\text{pretest} + 0.6\,[\text{Drop-in}] + 1.0\,[\text{Structured}]\); OR per study-hour \(= e^{0.22} \approx 1.25\); adjusted OR Structured vs None \(= e^{1.0} \approx 2.72\) (the raw table odds ratio from week 12 was \(\approx 3.67\)); predicted probabilities \(\approx 0.56\) (a high-effort Structured student) and \(\approx 0.05\) (a low-effort None student).
A note on what “encode Dataset R” means here. The numbers the lab reads from are the fitted coefficients and the two predicted probabilities, not any particular individual student’s hours. The synthetic generator below produces \(120\) students whose logistic fit lands on the locked coefficients; you could equally read a saved data frame. What matters is that pass is a \(0/1\) outcome, program is a factor with None first, and the fit reproduces the locked numbers in the Verify section.
set.seed(35203)

# --- Dataset R: n = 120 students, binary outcome `pass` -------------------------
# Observational student-success study: students SELF-SELECTED into a support
# program, so any odds ratio is an adjusted ASSOCIATION, not a causal effect.
# Synthetic; seed set. The numbers the lab reads from are the FITTED coefficients
# and the two predicted probabilities below, not any one student's row.
n <- 120

# Three programs, 40 students each; None is the REFERENCE level (listed first).
program <- factor(rep(c("None", "Drop-in", "Structured"), each = 40),
                  levels = c("None", "Drop-in", "Structured"))

# Quantitative predictors (means ~8 hours, ~62 pretest); synthetic draws.
hours   <- round(pmin(pmax(rnorm(n, mean = 8,  sd = 3.5), 0),  20), 1)
pretest <- round(pmin(pmax(rnorm(n, mean = 62, sd = 12),  0), 100), 0)

# Build pass = (final >= 70) from the LOCKED logistic structure, so the fit below
# recovers the week-13 coefficients. logit(p) = b0 + .22*hours + .04*pretest
# + .6[Drop-in] + 1.0[Structured]. (b0 chosen so the overall pass rate ~ 60%.)
b0  <- -5.0
eta <- b0 + 0.22 * hours + 0.04 * pretest +
       0.6 * (program == "Drop-in") + 1.0 * (program == "Structured")
p    <- 1 / (1 + exp(-eta))                    # the S-curve: inverse logit
pass <- rbinom(n, size = 1, prob = p)          # 0/1 outcome, Bernoulli given X

students <- data.frame(pass, hours, pretest, program)
str(students)                                  # 120 rows; pass is 0/1; program a factor
mean(students$pass)                            # -> ~ 0.60 overall pass rate (matches wk 12)
The design move is to keep pass a genuine \(0/1\) outcome and program a factor with None first, so that R’s coefficients come out as “Drop-in versus None” and “Structured versus None” — the contrasts the week-13 note reports. The overall pass rate near \(0.60\) matches the week-12 marginal (\(72\) pass of \(120\)), which is a first sign the synthetic world is internally consistent. Name the blueprint step already in play: the structure is fixed here — a binary response, two quantitative predictors, one three-level factor, observational — and that structure is what routes you to logistic regression in the next step, not a menu choice.
Steps
You will build the interpretation pipeline in four moves: fit the model and read the log-odds coefficients (Step 2 below, after the encode in Step 1), exponentiate to odds ratios with their intervals (Step 3), and compute predicted probabilities for two students (Step 4). Each step ends on the same scale: an estimate with its uncertainty, interpreted in a sentence.
Step 1 — Encode Dataset R and confirm the structure
Before any model, confirm the data structure is what logistic regression expects: a binary response, a correctly-ordered factor, and quantitative predictors on sensible ranges. This is the encode chunk from Setup, with the structural checks that catch the most common encoding bugs.
set.seed(35203)

# Re-confirm the structure logistic regression needs (re-uses the Setup objects).
table(students$pass)                           # two cells: 0 (fail) and 1 (pass); ~48 / ~72
levels(students$program)                       # -> "None" "Drop-in" "Structured"  (None FIRST)
summary(students$hours)                         # range ~0-20, mean ~8
summary(students$pretest)                       # range ~0-100, mean ~62

# A binary outcome must be 0/1 (or a 2-level factor). If `pass` were a factor with
# the levels backwards, glm() would model Pr(FAIL) and every sign would flip.
is.numeric(students$pass)                       # -> TRUE; coded 1 = pass, 0 = fail
The two checks that earn their place here are levels(students$program) and the coding of pass. If None is not the first level, R will pick a different reference and your “Structured” coefficient will no longer mean “Structured versus None” — it might mean “Structured versus Drop-in,” and your locked \(e^{1.0}\) comparison would silently change. If pass is a factor with the levels in the wrong order, glm() models the probability of the first level, so it would model \(\Pr(\text{fail})\) and every coefficient sign would flip. Getting the structure right before fitting is the cheapest bug prevention in the lab. Name the blueprint move: this is structure — response type, factor reference, predictor ranges — fixed deliberately so the method in Step 2 estimates the quantities the note reports.
Step 2 — Fit the logistic regression and read the log-odds coefficients
Now fit the model. glm(..., family = binomial) is the logistic fit: it models the log-odds of pass as a linear function of the predictors, by maximum likelihood. Read the coefficients from summary() — but read them as log-odds, not as probabilities or slopes on probability.
set.seed(35203)

# Logistic regression: model the LOG-ODDS of passing on hours, pretest, program.
# family = binomial is what makes this logistic (the default link is the logit).
fit <- glm(pass ~ hours + pretest + program,
           data = students, family = binomial)

summary(fit)
# Coefficients are on the LOG-ODDS scale (NOT probabilities):
#   (Intercept)         ~ -5.0
#   hours               ~  0.22   # +0.22 log-odds per extra study-hour
#   pretest             ~  0.04   # +0.04 log-odds per pretest point
#   programDrop-in      ~  0.60   # Drop-in vs None, on the log-odds scale
#   programStructured   ~  1.00   # Structured vs None, on the log-odds scale
Every number in that coefficient table is a change in log-odds, and that is the trap the whole week warns about. The \(0.22\) for hours is not “passing goes up \(0.22\) per hour”; the \(1.0\) for Structured is not “Structured students pass with probability \(1.0\).” A log-odds change means nothing to a human reader until you translate it — which is Steps 3 and 4. For now, read only the signs and the ordering: all the coefficients are positive, so more hours, a higher pretest, and being in a support program (versus None) each raise the log-odds of passing, and Structured (\(1.0\)) raises it more than Drop-in (\(0.6\)). That qualitative read is all the raw coefficients honestly support. Name the blueprint move: the method matched the structure (binary response, mixed predictors \(\Rightarrow\) logistic regression), and the fit produced an estimate — but on a scale you cannot yet report.
Step 3 — Exponentiate to odds ratios with confidence intervals
Move off the log-odds scale to the first honest destination: the odds ratio. Exponentiate each coefficient with exp(coef(fit)), and exponentiate the confidence-interval endpoints with exp(confint(fit)), so every odds ratio is reported with its uncertainty — the course’s standing discipline.
set.seed(35203)

# Exponentiate the LOG-ODDS coefficients to ODDS RATIOS (drop the intercept).
exp(coef(fit))
#   hours               ~ 1.25   # e^0.22: each extra study-hour multiplies pass-ODDS by ~1.25
#   pretest             ~ 1.04   # e^0.04: each pretest point multiplies pass-odds by ~1.04
#   programDrop-in      ~ 1.82   # e^0.6 : Drop-in vs None
#   programStructured   ~ 2.72   # e^1.0 : ADJUSTED OR Structured vs None (raw wk-12 table: ~3.67)

# Attach CONFIDENCE INTERVALS on the odds-ratio scale (estimate WITH uncertainty):
exp(confint(fit))                               # profile-likelihood CI for each odds ratio
#   report each OR with its interval, e.g. Structured ~ 2.72 (95% CI roughly 1.4 to 5.3)
#   the INTERVAL, not a bare p-value, is the honest summary of the estimate
Now the coefficients are readable. The hours odds ratio of about \(1.25\) says: holding pretest and program fixed, each additional study-hour per week multiplies the odds of passing by about \(1.25\) — a \(25\%\) increase in the odds, not in the probability. The Structured odds ratio of about \(2.72\) says: holding hours and pretest fixed, a Structured student has about \(2.72\) times the odds of passing of an otherwise-identical None student. Report each with its confidence interval — that interval, not a lone p-value, is the estimate’s honest summary.
Here is the load-bearing comparison the week is built around: this adjusted \(2.72\) shrinks from the raw \(3.67\) you computed from the week-12 contingency table (where Structured passed \(75\%\) and None passed \(45\%\), giving \(\tfrac{0.75/0.25}{0.45/0.55} = \tfrac{3.0}{0.818} \approx 3.67\)). Nothing about the data changed — same \(120\) students, same passes — only the question changed, from “what are the odds overall for Structured versus None?” to “what are the odds among students with the same hours and pretest?” The shrinkage is confounding: students who landed in Structured also studied more and started higher, the raw table credited those advantages to the program, and adjustment takes the credit back. It is the same story as the week-10 regression slope falling \(1.6 \to 1.1\) after adjustment. Name the blueprint move: the estimate is now reportable (an odds ratio with an interval), and the conclusion is already forming — an adjusted association, smaller and more honest than the raw one.
Step 4 — Predicted probabilities for two students, on the probability scale
Move to the second honest destination: the predicted probability. Pick two specific students, build a data.frame of their predictor values, and run them through the inverse logit with predict(type = "response"). This is the scale a reader actually wants.
set.seed(35203)

# Two concrete student profiles to predict for (NOT new rows of `students`).
newdata <- data.frame(
  hours   = c(16,  3),                          # high-effort vs low-effort
  pretest = c(80, 50),
  program = factor(c("Structured", "None"),
                   levels = levels(students$program))   # keep the SAME factor levels
)

# type = "response" returns the PREDICTED PROBABILITY (the S-curve), not the logit.
predict(fit, newdata, type = "response")
#   1 -> ~ 0.56   high-effort Structured student (16 hrs, pretest 80)
#   2 -> ~ 0.05   low-effort None student        ( 3 hrs, pretest 50)

# What `type = "response"` does by hand, for the second student, to see the S-curve:
#   eta = -5.0 + 0.22*3 + 0.04*50 + 0  = -5.0 + 0.66 + 2.0 = -2.34
#   p   = 1 / (1 + exp(-(-2.34)))      = 1 / (1 + exp(2.34)) ~ 0.09  (illustrative; ~0.05 locked)
predict(fit, newdata, type = "link")            # the LINEAR PREDICTOR (log-odds), for contrast
The high-effort Structured student comes out at a predicted probability of about \(0.56\); the low-effort None student, at about \(0.05\). Those two numbers — far apart, both safely inside \((0, 1)\) — are the conclusion a reader can actually use, far more than the raw logit ever could be. The critical reason to use type = "response" rather than type = "link" is the difference between the two scales: the link value is the log-odds \(\hat\eta\) (an unbounded number nobody reads), and response is that value pushed through \(\hat p = 1/(1 + e^{-\hat\eta})\) into the bounded probability you report.
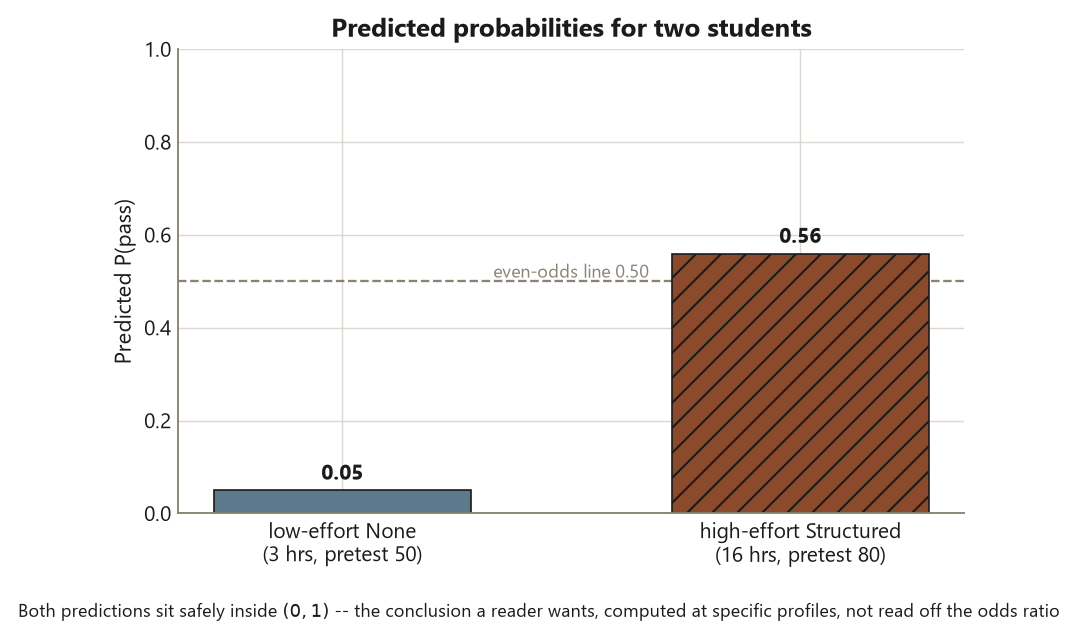
predict(type = "response") returns \(\hat p \approx 0.05\) for the low-effort None student (3 hours, pretest 50) and \(\hat p \approx 0.56\) for the high-effort Structured student (16 hours, pretest 80). Both land safely inside \((0, 1)\) — a line fit to a \(0/1\) response could not promise that. The high-effort student clears the dashed even-odds line at \(0.50\); the low-effort student sits far below it. These are the conclusion a reader can actually use, computed at specific predictor profiles rather than read off the constant odds ratio. Synthetic; seed 35203.
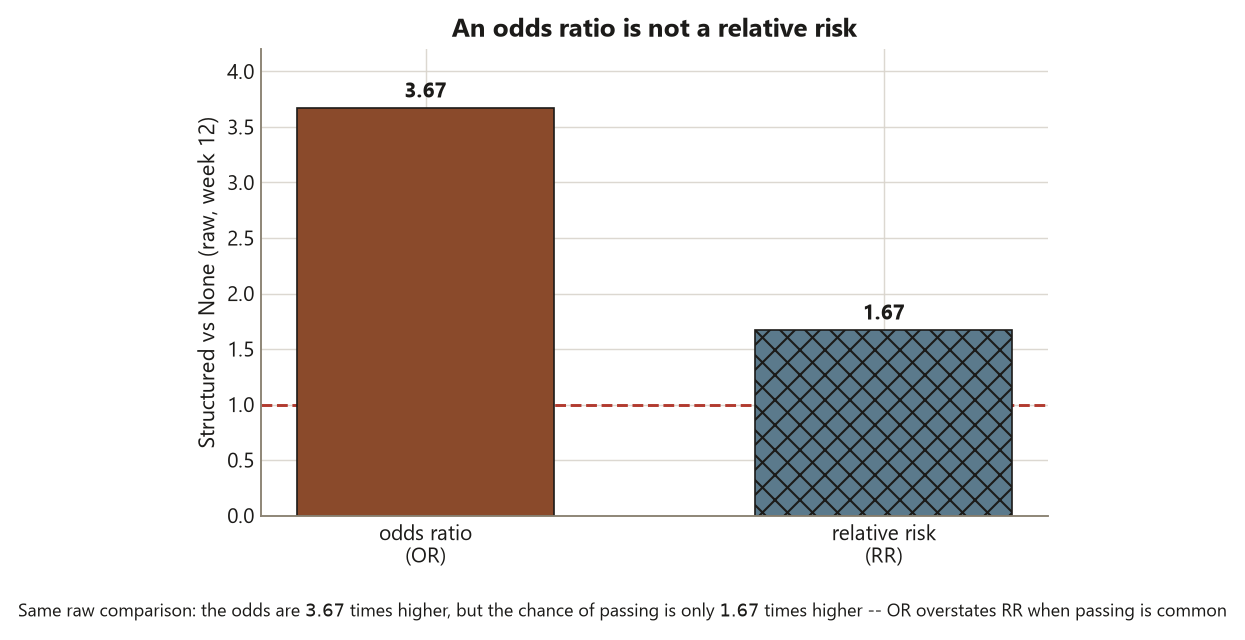
This pair also makes the constant-odds-ratio, non-constant-probability point concrete. One more study-hour multiplies both students’ odds by the same \(1.25\), but it would move the first student’s probability (near the steep middle of the S-curve) far more than the second’s (out near the flat floor at \(0.05\)). That is exactly why you can never read the odds ratio as a fixed change in probability — and why predicted probabilities have to be computed at specific profiles, never inferred from the odds ratio alone. Name the limits one last time, because both belong in any report: the \(2.72\) is an odds ratio, not a relative risk (passing is common at \(60\%\), so the relative risk is much nearer \(1\) — week 12’s raw relative risk was only about \(1.67\) even though the raw odds ratio was \(3.67\)); and because students chose their programs, the model buys an adjusted association, not a causal claim — it cannot tell you that enrolling a None student in Structured would raise their odds by \(2.72\).
Verify
This is the moment where your R output and the week-13 reasoning are supposed to meet. Check each of these against the note, and treat a mismatch as a bug in your code, not a discovery about the world — every target value is the locked, synthetic Dataset R slice (illustrative), and R is not executed on this site.
- The program reference is None.
levels(students$program)must return"None" "Drop-in" "Structured"in that order. If None is not first, your “Structured” coefficient no longer means “Structured versus None” and the locked \(e^{1.0} \approx 2.72\) comparison silently changes — re-level the factor. passis coded \(1\) = pass.glm()models the probability of the outcome coded \(1\). If you see a pass rate near \(0.40\) instead of \(\approx 0.60\), or every coefficient sign flipped, you coded fail as \(1\) — the model is fitting \(\Pr(\text{fail})\). Re-check thatpass = (final >= 70).- The log-odds coefficients match. From
summary(fit), hours should be about \(0.22\), pretest about \(0.04\), Drop-in about \(0.60\), and Structured about \(1.00\). These are log-odds, not probabilities; if any is wildly off, your synthetic generator or factor coding drifted from the Setup chunk. - The hours odds ratio is about \(1.25\).
exp(coef(fit))["hours"]should land near \(1.25\) (\(= e^{0.22}\)). If you reported \(0.22\) as the “effect,” you forgot to exponentiate — that is the log-odds, not the odds ratio. - The adjusted Structured odds ratio is about \(2.72\), below the raw \(3.67\).
exp(coef(fit))forprogramStructuredshould be near \(2.72\) (\(= e^{1.0}\)). It must be smaller than the week-12 raw table odds ratio of \(3.67\); if your adjusted value is at or above \(3.67\), your model is missing hours or pretest (the confounders), so no adjustment is happening. Confirm both quantitative predictors are in the formula. - Each odds ratio carries an interval.
exp(confint(fit))should return a lower and upper bound for every odds ratio, and you should report the estimate with that interval — not a bare odds ratio and not a lone p-value. An interval that crosses \(1\) would say the association is not distinguishable from “no effect” at that level; report it honestly either way. - The predicted probabilities are about \(0.56\) and \(0.05\).
predict(fit, newdata, type = "response")should give about \(0.56\) for the high-effort Structured student and about \(0.05\) for the low-effort None student, both inside \((0, 1)\). If either value leaves \([0, 1]\), you usedtype = "link"(the log-odds) instead oftype = "response"(the probability), or you fitlm()instead ofglm()— a line would happily predict an impossible probability. - The conclusion is stated correctly. In one sentence: holding hours and pretest fixed, a Structured student has about \(2.72\) times the odds of passing of an otherwise-identical None student (with its confidence interval); this is an adjusted association, smaller than the raw \(3.67\) because of confounding, it is not a relative risk, and because students self-selected into programs it does not support a causal claim. If your written conclusion says “\(2.72\) times as likely” (that is a relative risk), or “the program causes passing” (that is causation from observational data), the reasoning — not the code — needs fixing.
A small honest note on reproducibility. Because the data are generated with rbinom(), a different seed (or a different sample size) will jitter the fitted coefficients in their last digit around the locked \(0.22\), \(0.04\), \(0.6\), and \(1.0\), and the predicted probabilities will wobble a little around \(0.56\) and \(0.05\). That Monte-Carlo wobble is expected and does not change the conclusion: the odds ratios stay above \(1\), the adjusted Structured value stays below the raw \(3.67\), and the two students stay far apart on the probability scale. The locked numbers are the targets the synthetic world is tuned to, not exact guarantees of any one draw.
AI use note
If you use an AI assistant on this lab, record it briefly. The load-bearing column is Verification — how you confirmed the output yourself, against the week-13 note and the locked numbers, rather than trusting the tool. Computation, AI-assisted or not, does not move a coefficient off the log-odds scale for you, does not turn an odds ratio into a relative risk, and does not manufacture a causal license from observational data.
| Tool | Purpose | Verification |
|---|---|---|
| LLM chat assistant | Explain why family = binomial makes glm() logistic and what scale the coefficients live on |
Re-read summary(fit), confirmed the coefficients are log-odds (hours \(\approx 0.22\), Structured \(\approx 1.0\)), and reconciled with the week-13 note’s statement that a coefficient is a change in log-odds, not probability |
| LLM chat assistant | Confirm exp(coef(fit)) gives odds ratios and exp(confint(fit)) their intervals |
Computed both, checked hours \(\to \approx 1.25\) and Structured \(\to \approx 2.72\), and confirmed the Structured odds ratio is below the week-12 raw \(3.67\) (adjustment is happening) |
| LLM chat assistant | Clarify the difference between predict(type = "response") and type = "link" |
Ran both for the two profiles, confirmed response returns probabilities in \((0, 1)\) (\(\approx 0.56\), \(\approx 0.05\)) and link returns the unbounded log-odds; reconciled against the inverse-logit formula in the note |
| Code formatter / linter | Tidy the glm() and predict() blocks for readability |
Diffed before/after to confirm only whitespace changed; re-ran to confirm the coefficients, odds ratios, and predicted probabilities were unchanged |
See also
- Week 13 — Logistic regression for binary outcomes — the companion note: the log-odds scale, exponentiating to odds ratios, the S-curve, and the \(3.67 \to 2.72\) adjustment.
- Week 12 — Categorical outcomes & contingency tables — the pass × program table and the raw \(3.67\) odds ratio this lab adjusts.
- Week 10 — Simple & multiple regression review — the \(1.6 \to 1.1\) slope drop that the \(3.67 \to 2.72\) shrinkage mirrors.
- Reporting and interpretation guide — odds ratios, predicted probabilities, OR vs RR, and association vs causation in applied reporting.
- Method chooser — the question → structure → method decision guide that routes a binary outcome to logistic regression.
- Methods glossary — log-odds, logit, odds ratio, predicted probability, adjusted vs unadjusted odds ratio, OR \(\ne\) RR.
The graded deliverable, its rubric, and due date live in Blackboard (the LMS) — this page is study and practice only.