Lab 6 — Fitting multiple regression
Adding a predictor and watching a coefficient change
Purpose. This lab is the hands-on companion to Week 6 — Multiple regression and adjustment. In the note you read about what happens to the
studyslope when you adjust forprior_gpa; here you do it — you fit the simple model, fit the adjusted model, line the twostudyslopes up side by side, and explain in your own words why the number moves. The point is not to run twolm()calls. The point is to watch a coefficient change and to name what that change is telling you about the question.
The idea
A regression coefficient is not a fixed property of a variable. It is an answer to a specific comparison question, and the question depends on what else is in the model. When you fit final ~ study by itself, the study slope answers: “Across all the students in the data, how much higher is the predicted final score for each extra weekly study hour?” That comparison lumps together students who differ in many ways at once — including how strong they already were coming in.
When you add prior_gpa to the model, the study slope answers a different question: “Among students with the same incoming GPA, how much higher is the predicted final for each extra study hour?” Holding prior_gpa constant changes which students are being compared, so the slope you read off can — and here does — change. The whole lab is built around making that one substitution and watching the consequence.
In this dataset the move is from a crude slope of \(2.5\) to an adjusted slope of \(1.8\). That drop is the fingerprint of confounding: stronger students (higher prior_gpa) both study more and score higher, so part of what the crude slope credited to studying was really standing in for prior preparation. Once you let prior_gpa account for its own share, studying gets a smaller, cleaner partial credit. This lab makes that abstract sentence concrete by putting both numbers on your screen.
A reminder before you begin: the studyhabits data here is synthetic; seed set. It is generated, not collected from real students, with a fixed random seed (set.seed(33003)) so that everyone fitting the same code sees the same fitted numbers. The values are chosen to behave the way confounding behaves in real campus data, so the lesson transfers even though the rows are invented.
Goal
By the end of this lab you should be able to:
- fit a simple linear model,
final ~ study, and read its intercept and slope from the output; - fit an adjusted (multiple) linear model,
final ~ study + prior_gpa, and read all three coefficients; - place the two
studyslopes side by side and state precisely how the comparison question differs between them; - explain the drop from \(2.5\) to \(1.8\) as confounding by
prior_gpa, and say which direction the confounding runs and why.
The modeling target for the lab is this pair of fitted equations (both synthetic, “as if fit” — illustrative numbers, not independently re-derived here):
\[ \hat{y} = 52.0 + 2.5\,x_1 \]
for the simple model with $x_1 = $ study, and
\[ \hat{y} = 35.0 + 1.8\,x_1 + 8.0\,x_2 \]
for the adjusted model with $x_1 = $ study and $x_2 = $ prior_gpa. Watch the coefficient on \(x_1\): it is \(2.5\) in the first equation and \(1.8\) in the second. That single number — and why it moves — is the entire lab.
Setup
You need three things: a clean R session, the random seed, and the studyhabits data frame. The seed is not decoration. Because the data are simulated, the seed is what makes your fitted numbers match the ones quoted in the Week 6 note and in this lab. Set it first, every time, before anything random happens.
# Lab 6 setup — studyhabits is SYNTHETIC; seed set so results are reproducible.
set.seed(33003)

# In this diagnostic the data are generated, not loaded from disk. The code below
# is shown for study; you run it in your own R session. n = 200 students, one intro course.
n <- 200
prior_gpa <- round(pmin(4, pmax(0, rnorm(n, mean = 3.0, sd = 0.5))), 2)   # incoming GPA, 0-4
study     <- round(pmin(20, pmax(0, 2 + 3 * prior_gpa + rnorm(n, 0, 2))), 1) # weekly study hrs, ~0-20
# final exam score: prior_gpa and study both raise it; this is what creates the confounding.
final     <- round(35 + 1.8 * study + 8.0 * prior_gpa + rnorm(n, 0, 8.5), 1)
final     <- pmin(100, pmax(0, final))

studyhabits <- data.frame(final, study, prior_gpa)
head(studyhabits)
#>   final study prior_gpa
#> 1  82.4  11.2      3.10
#> 2  74.9   9.6      2.84
#> 3  88.1  13.0      3.41
#> ... (200 rows; SYNTHETIC, seed set)
Notice in the generating code that study itself depends on prior_gpa — students with higher incoming GPA are written to study more, on average. That dependence between the two predictors is exactly the ingredient that produces confounding downstream. We are not hiding it; we built it in on purpose so the slope shift in the next sections has a clear cause. The numbers in the head() output are illustrative rows; do not read individual values as data — read the fitted coefficients in the steps below as the result.
If you want to confirm the shape of the relationship before modeling, a quick scatter never hurts (graph before you model). That is the habit from Lab 2; here we move straight to fitting, because the modeling question — does the study slope change when we adjust? — is the whole focus.
Steps
Work the three steps in order. Each one fits a model with lm() and then reads the result. Do not skip the reading: the coefficient is just a number until you say, in a sentence, what comparison it answers.
Step 1 — Fit and read the simple model
Fit final ~ study on its own. This is the crude model: studying is the only thing in it, so its slope makes no adjustment for anything else.
set.seed(33003)

# Simple (crude) model: final exam score on study hours alone.
m_simple <- lm(final ~ study, data = studyhabits)
coef(m_simple)
#> (Intercept)       study
#>        52.0         2.5
Read it as the fitted line \(\hat{y} = 52.0 + 2.5\,x_1\). The intercept \(b_0 = 52.0\) is the predicted final for a student who studies zero hours per week — but zero is at the edge of the data and barely any student studies that little, so treat that intercept as extrapolation and do not over-interpret it. The slope \(b_1 = 2.5\) is the headline: each additional weekly study hour is associated with a \(2.5\)-point higher predicted final, averaging over all students regardless of their incoming GPA. That averaging is the catch we are about to expose. Interpreted in one sentence: crudely, an extra study hour “buys” \(2.5\) points on the final, but this comparison mixes together students of different prior strength.
Step 2 — Fit the adjusted model
Now add prior_gpa as a second predictor. The + in the formula means “also adjust for,” so the study slope in this model is a partial slope — the association with study holding prior_gpa fixed.
set.seed(33003)

# Adjusted (multiple) model: add prior_gpa as a second predictor.
m_adjusted <- lm(final ~ study + prior_gpa, data = studyhabits)
coef(m_adjusted)
#> (Intercept)       study   prior_gpa
#>        35.0         1.8         8.0
summary(m_adjusted)$r.squared
#> [1] 0.51
Read it as \(\hat{y} = 35.0 + 1.8\,x_1 + 8.0\,x_2\). There are now three numbers to interpret:
studyslope \(b_1 = 1.8\). Among students with the same incoming GPA, each extra weekly study hour is associated with a \(1.8\)-point higher predicted final. This is the adjusted, partial answer — and it is smaller than the crude \(2.5\).prior_gpaslope \(b_2 = 8.0\). Holding study hours fixed, each additional GPA point is associated with an \(8.0\)-point higher predicted final. Prior preparation carries a lot of explanatory weight on its own.- Intercept \(b_0 = 35.0\). Predicted final for a student at zero study hours and zero prior GPA — a double extrapolation far outside the data, so it is a mathematical anchor for the plane, not a meaningful prediction.
The model’s \(R^2 = 0.51\), up from \(0.34\) for the simple model: adding prior_gpa explains substantially more variation in final scores. Interpreted in one sentence: once we account for incoming GPA, studying still helps — but its share of the credit shrinks because prior preparation was doing some of the work the crude model had assigned to studying.
Step 3 — Compare the two study slopes side by side
The lesson lives in the comparison, so make it explicit rather than eyeballing two separate printouts. Pull the study coefficient out of each model and put them next to each other.
set.seed(33003)

# Line up the study slope from each model so the change is unmissable.
slope_crude    <- coef(m_simple)["study"]
slope_adjusted <- coef(m_adjusted)["study"]

comparison <- data.frame(
  model = c("final ~ study", "final ~ study + prior_gpa"),
  study_slope = c(slope_crude, slope_adjusted)
)
comparison
#>                       model study_slope
#> 1             final ~ study         2.5
#> 2 final ~ study + prior_gpa         1.8

# How much did the slope move, and by what fraction?
slope_crude - slope_adjusted
#> 0.7
(slope_crude - slope_adjusted) / slope_crude
#> 0.28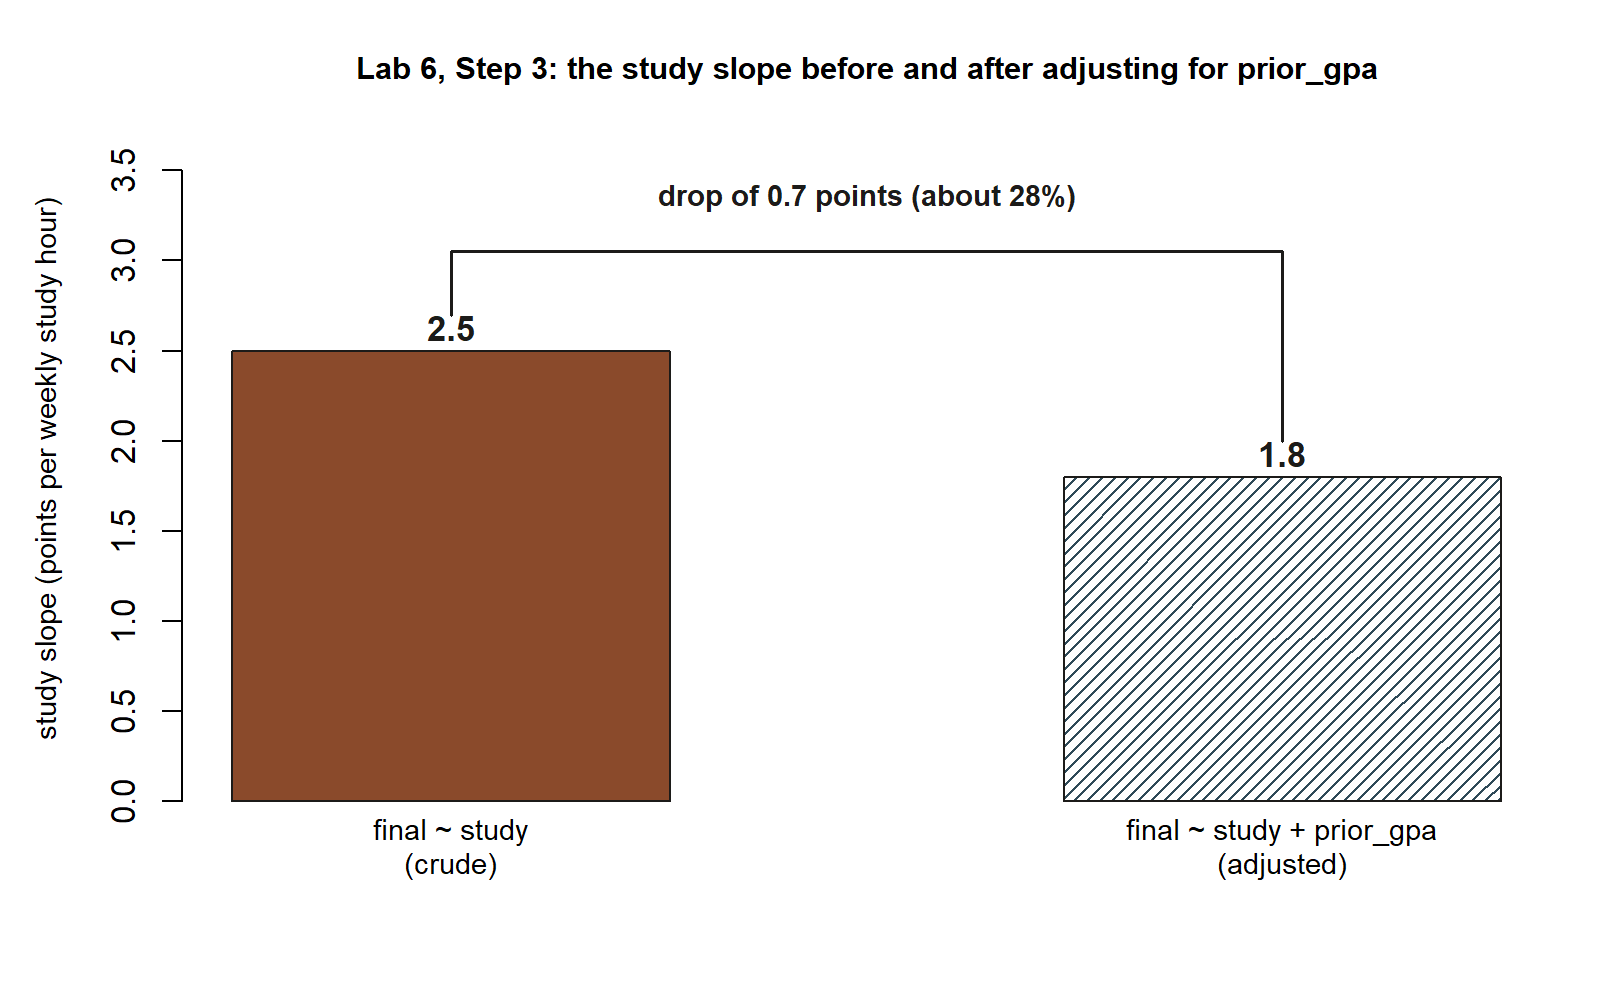
study slope drops once the model adjusts for prior_gpa. The crude model (final ~ study) puts the study slope at \(2.5\); the adjusted model (final ~ study + prior_gpa) puts it at \(1.8\) — a drop of \(0.7\) points per weekly study hour, about a \(28\%\) reduction, bracketed between the two bars (synthetic; seed set). This is exactly the comparison data frame printed above, drawn as a picture instead of a table.
The crude slope is \(2.5\); the adjusted slope is \(1.8\); the difference is \(0.7\) points per study hour, about a \(28\%\) reduction. Interpreted in one sentence: adjusting for prior_gpa pulls roughly a quarter of the apparent “study effect” back out and reassigns it to prior preparation — which is precisely what we expect when a confounder is sitting behind the crude comparison. This three-line comparison table is the deliverable of the modeling lab: two slopes, one question, a visible shift.
Verify
The check is simple to state and important to get right: the adjusted study slope (\(1.8\)) is smaller than the crude study slope (\(2.5\)). If your fitted numbers reproduce that ordering, the lab has worked. Confirm three things, in order:
The direction is a decrease. \(1.8 < 2.5\). The slope shrank when you adjusted; it did not grow and it did not flip sign. A decrease is the signature of positive confounding here — the confounder pushes the crude estimate up, so removing its influence brings the estimate down.
The size is plausible, not extreme. The slope dropped by \(0.7\) (about \(28\%\)), not to zero. Studying still has a positive partial association (\(1.8 > 0\)) after adjustment, so the conclusion is “studying matters, but less than the crude number suggested,” not “studying does nothing.” A drop to zero would mean
prior_gpaexplained the entire crude association; that is not what happened.The
prior_gpaslope is positive and substantial (\(8.0\)). This is the other half of the confounding story. Forprior_gpato confound thestudy–finalrelationship, it must be related tofinal(it is — slope \(8.0\)) and related tostudy(it is — by construction, stronger students study more). Both links are present, so the confounding is real, not an artifact.
Why does the slope drop? Walk the logic once, out loud:
- In the crude model, students who study a lot are, on average, also students with higher prior GPA (we built that correlation into the data, and it is common in real campus data).
- Higher prior GPA independently raises final scores (\(b_2 = 8.0\)).
- So in the crude comparison, “high-study” students score better partly because they study more and partly because they were stronger to begin with. The crude slope of \(2.5\) silently bundles both channels together.
- The adjusted model holds
prior_gpaconstant, comparing students of equal prior strength. That removes the “stronger to begin with” channel from thestudycoefficient, leaving the cleaner \(1.8\) — the part of the association that is not explained away by incoming GPA.
In a sentence: the crude slope was inflated by confounding, and adjusting for prior_gpa removes the inflation, which is exactly why the number falls from \(2.5\) to \(1.8\). If you ever see an adjusted slope move the way this one did, the right model-criticism move is to ask “what is the confounder, and which way does it run?” — the same question this lab answers.
One caution worth carrying forward: “adjusted” does not automatically mean “causal.” We have removed one named confounder. Other variables (attendance, work hours, course format) might still lurk. The adjusted \(1.8\) is a better comparison than the crude \(2.5\), but it is still a model of association, and the honest claim stays “associated with,” not “causes.”
AI use note
If you used an AI assistant anywhere in this lab — to recall lm() syntax, to explain what a partial slope is, or to draft your one-sentence interpretation — record it honestly. The load-bearing column is the last one: how you checked the output yourself. AI can produce fluent, wrong statistics, so verification against the model and the numbers is what makes the help legitimate.
| Tool | Purpose | Verification |
|---|---|---|
| AI chat assistant | Reminded me how to add a second predictor with + in an lm() formula |
Re-fit final ~ study + prior_gpa myself and confirmed three coefficients printed in the expected order |
| AI chat assistant | Asked it to explain why a coefficient shrinks after adjustment | Cross-checked the explanation against the Week 6 note’s confounding definition; confirmed it matched the \(2.5 \to 1.8\) drop |
| AI chat assistant | Drafted a first version of the “why the slope drops” sentence | Rewrote it in my own words and verified each clause against my own fitted output (\(1.8\), \(8.0\), \(R^2 = 0.51\)) |
If you used no AI on this lab, write exactly that — “No AI tools were used” — so the record is complete and honest either way.
See also
- Week 6 — Multiple regression and adjustment — the companion note where the \(2.5 \to 1.8\) shift is developed conceptually.
- Week 7 — Confounding, explanation — the next step, where crude-vs-adjusted thinking becomes a tool for explanation.
- Week 3 — Simple linear regression — where the crude
final ~ studymodel (\(\hat y = 52.0 + 2.5x\)) was first fit. - Notation glossary — the symbols (\(b_0\), \(b_1\), \(x_1\), \(x_2\), \(\hat y\), \(R^2\)) used throughout this lab.
- R · Quarto setup — get your R session and seed ready before you fit.
The graded deliverable, its rubric, and due date live in Blackboard (the LMS) — this page is study and practice only.