Week 5 — Diagnostics & model adequacy
Residual plots and judging whether a model is adequate for its purpose
The week question
Last week you read a fitted line off the regression output and learned to interpret a slope, an intercept, an \(R^2\), and a confidence interval. This week asks the question that should come right after any fit, and that is too often skipped: is this line good enough for its purpose — and what do the residuals reveal?
Notice the words carefully. We are not asking whether the model is true; no straight line through real, noisy data is ever literally true. We are asking whether the simple summary \(\hat{y} = 52.0 + 2.5\,x\) captures the shape of the relationship well enough that the conclusions you draw from it — about the slope, the predictions, the uncertainty — can be trusted for the job you have in mind. The tool that answers this is diagnostics: a small set of pictures and quantities, built from the leftovers of the fit, that let the data tell you where the model is doing fine and where it is quietly lying to you.
Why this matters
A regression fit always returns numbers. R will happily hand you a slope and an \(R^2\) for any lm() call, whether or not a straight line was a sensible thing to fit. Those numbers are not warnings; they are just arithmetic. If the true relationship curves, or if the spread of the points fans out as the predictor grows, or if one strange student is dragging the line toward herself, the output looks exactly as confident and tidy as it would if everything were fine. The model does not police itself. You have to.
This is the difference between fitting a model and trusting one. In a modeling course — and this is a modeling course, not a programming course — the act that earns trust is model criticism: you fit, then you deliberately go looking for the ways the fit could be wrong. Diagnostics are how a careful analyst converts a fitted object into a defensible claim. They are also how you decide, before you ever report a number, whether the number deserves to be reported at all. A slope from a model whose residuals show clear curvature is not a slightly-imperfect slope; it can be the wrong summary of the wrong relationship, and the confidence interval around it is then a precise statement about the wrong thing.
Learning goals
By the end of this week you should be able to:
- Define a residual \(e = y - \hat{y}\) and explain why residuals are exactly the part of the data the model failed to capture.
- Read a residual-vs-fitted plot and name what each pattern signals: curvature, a funnel, or isolated unusual points.
- Distinguish the three trouble signs — wrong functional form, non-constant variance, and outliers / high-leverage points — and say what each one threatens.
- Compute and interpret a single residual by hand, using the locked
studyhabitsfit. - Explain what “adequate for a purpose” means, and why a model can be adequate for one purpose (rough description) and inadequate for another (precise prediction at the edges).
- Resist two classic errors: trusting a high \(R^2\) without looking at residuals, and over-reacting to one stray point.
Core vocabulary
- Residual \(e = y - \hat{y}\): the vertical gap between an observed response and what the model predicted for it. The model’s per-observation leftover.
- Fitted value \(\hat{y}\): the model’s prediction for an observation, \(\hat{y} = b_0 + b_1 x\).
- Residual-vs-fitted plot: a scatterplot of residuals \(e\) (vertical) against fitted values \(\hat{y}\) (horizontal). The single most informative diagnostic for a linear model.
- Functional form: the shape the model assumes — here, a straight line. A wrong functional form means the truth bends where your model holds straight.
- Homoscedasticity / heteroscedasticity: constant vs. non-constant spread of the residuals as \(\hat{y}\) changes. A “funnel” is heteroscedasticity.
- Outlier: an observation with a surprisingly large residual — far from the line in the \(y\)-direction.
- Leverage: how unusual an observation is in the predictor direction (an extreme \(x\)). A high-leverage point can pull the whole line toward itself.
- Influence: the combination — a point is influential when removing it would visibly move the fitted line. High leverage and a large residual is the dangerous mix.
- Adequacy: whether the model is good enough for its intended use, not whether it is true.
Concept development
Residuals as the model’s leftovers
A fitted line splits every observed value into two pieces. One piece is what the model explains — the fitted value \(\hat{y}\), which slides along the straight line as \(x\) changes. The other piece is what the model missed — the residual \(e = y - \hat{y}\), the vertical distance from the point to the line. The decomposition is exact, by construction:
\[ y = \hat{y} + e = (b_0 + b_1 x) + e. \]
Least squares chooses \(b_0\) and \(b_1\) to make the residuals small in a specific sense (it minimizes \(\sum e_i^2\)), and a useful side effect is that the residuals from an lm() fit sum to zero and have no linear relationship left with \(x\). So the residuals are, by design, pure leftover: every systematic pattern that a straight line could absorb has already been absorbed. That is exactly why they are so diagnostic. Anything still structured in the residuals is structure the straight-line model could not represent. If you see a shape in the leftovers, the model shape was wrong. Residuals are not noise to be ignored; they are the model’s confession.
A small reminder about scale: residuals live in the units of the response. For studyhabits, a residual of \(-7\) means a final-exam score seven points below what the line predicted — a real, interpretable miss, not an abstraction.
The residual-vs-fitted plot
The workhorse diagnostic is the residual-vs-fitted plot: residuals \(e\) on the vertical axis, fitted values \(\hat{y}\) on the horizontal axis, with a horizontal reference line at \(e = 0\). When the straight-line model is adequate, this plot should look like a structureless, horizontal band of random scatter centered on zero — a shapeless cloud. Boring is good. You are essentially asking the data: “after I removed the straight-line part, is anything left over that I should have modeled?” A featureless band answers “no.”
Three departures from “boring” are worth memorizing, because each points to a different problem.
- Curvature → wrong functional form. If the residuals bow — say they are mostly negative in the middle and positive at both ends, tracing a smile or a frown — the true relationship is not a straight line. The model is too low where the curve is high and too high where the curve is low, and the residuals record exactly that bending. The fix is not a bigger slope; it is a different form (a transform of \(x\) or \(y\), or an added curved term).
- A funnel → non-constant variance. If the band of residuals is narrow on one side and flares wider as \(\hat{y}\) grows (or shrinks), the spread of the response depends on its level. The slope estimate may still be roughly right, but the standard errors and confidence intervals are no longer trustworthy, because they assume one constant spread \(s\).
- Isolated points → outliers and leverage. A single point sitting far above or below the band is an outlier (large residual). A point at an extreme fitted value that also sits off the band may be high-leverage and influential — capable of tilting the whole line. These deserve investigation, not reflexive deletion.
R gives you this plot for free: plot(fit, which = 1) draws residuals against fitted values and adds a smooth curve to make any bend easy to see. Reading this one picture well is most of practical diagnostics for simple regression.
“Adequate for a purpose,” not “true”
The deepest idea this week is a stance, not a formula. Every model is a simplification, so “is the model true?” is the wrong question — the honest answer is always “no.” The right question is “is the model adequate for this purpose?” Adequacy is relative to a use:
- For a rough descriptive claim — “more study hours go with higher finals, by roughly two-and-a-half points an hour” — a line with gentle, patternless residuals is plenty adequate, even if \(R^2\) is far from 1.
- For prediction near the edges of the data, or for a precise confidence interval, the same model may be inadequate, because a small unnoticed curve or a funnel matters much more when you lean on the exact number.
- For extrapolation beyond the observed range of \(x\), almost no model is adequate, because the residuals can only certify the model where you have data.
So diagnostics are not a pass/fail gate handed down from on high. They are how you match a model to a job. A residual plot does not tell you “good model” or “bad model”; it tells you where the model is faithful and where it is not, and you decide whether the faithful region covers the use you have. This is why a low \(R^2\) is not automatically a problem and a high \(R^2\) is not automatically a success — adequacy is about the shape of the errors, not only their size.
Worked examples
Worked example — the residual plot for final ~ study (the recurring studyhabits slice)
We return to the recurring synthetic teaching dataset (studyhabits, synthetic; seed set, set.seed(33003), \(n = 200\) students) and the simple linear regression of final-exam score on weekly study hours. The locked fit from Weeks 3–4 is
\[ \hat{y} = 52.0 + 2.5\,x, \qquad r = 0.58, \quad R^2 = 0.34, \quad s = 9.0, \]
where \(x\) is study. The slope says each extra weekly study hour is associated with about a \(2.5\)-point higher predicted final, on average; \(R^2 = 0.34\) says study hours account for about a third of the variation in finals; and the residual standard error \(s = 9.0\) says a typical prediction misses the observed score by roughly nine points. That last number is a residual summary — it is your first hint that residuals deserve a closer look.
Take one concrete student. A student who studied \(x = 10\) hours has fitted value
\[ \hat{y} = 52.0 + 2.5(10) = 77.0, \]
so the model predicts a final of \(77\). If that student actually scored \(70\), her residual is
\[ e = y - \hat{y} = 70 - 77 = -7. \]
The model overshot her by seven points; she did worse than her study hours alone would suggest. One residual is just one student — uninformative on its own. The diagnostic question is what all 200 residuals do together. Here is the fit and the two calls that produce them.
set.seed(33003)                       # studyhabits is synthetic; seed set
fit <- lm(final ~ study, data = studyhabits)

residuals(fit)[1:5]                    # the per-student leftovers e = y - yhat
#>      1      2      3      4      5
#>   4.2   -7.0    6.1   -2.8   10.4    # e.g. the study=10, final=70 student has e = -7

plot(fit, which = 1)                   # residual-vs-fitted: the key diagnostic
#> draws e (vertical) against yhat (horizontal), with a smoother through the cloud
Here is what that residual-vs-fitted plot looks like for this fit.
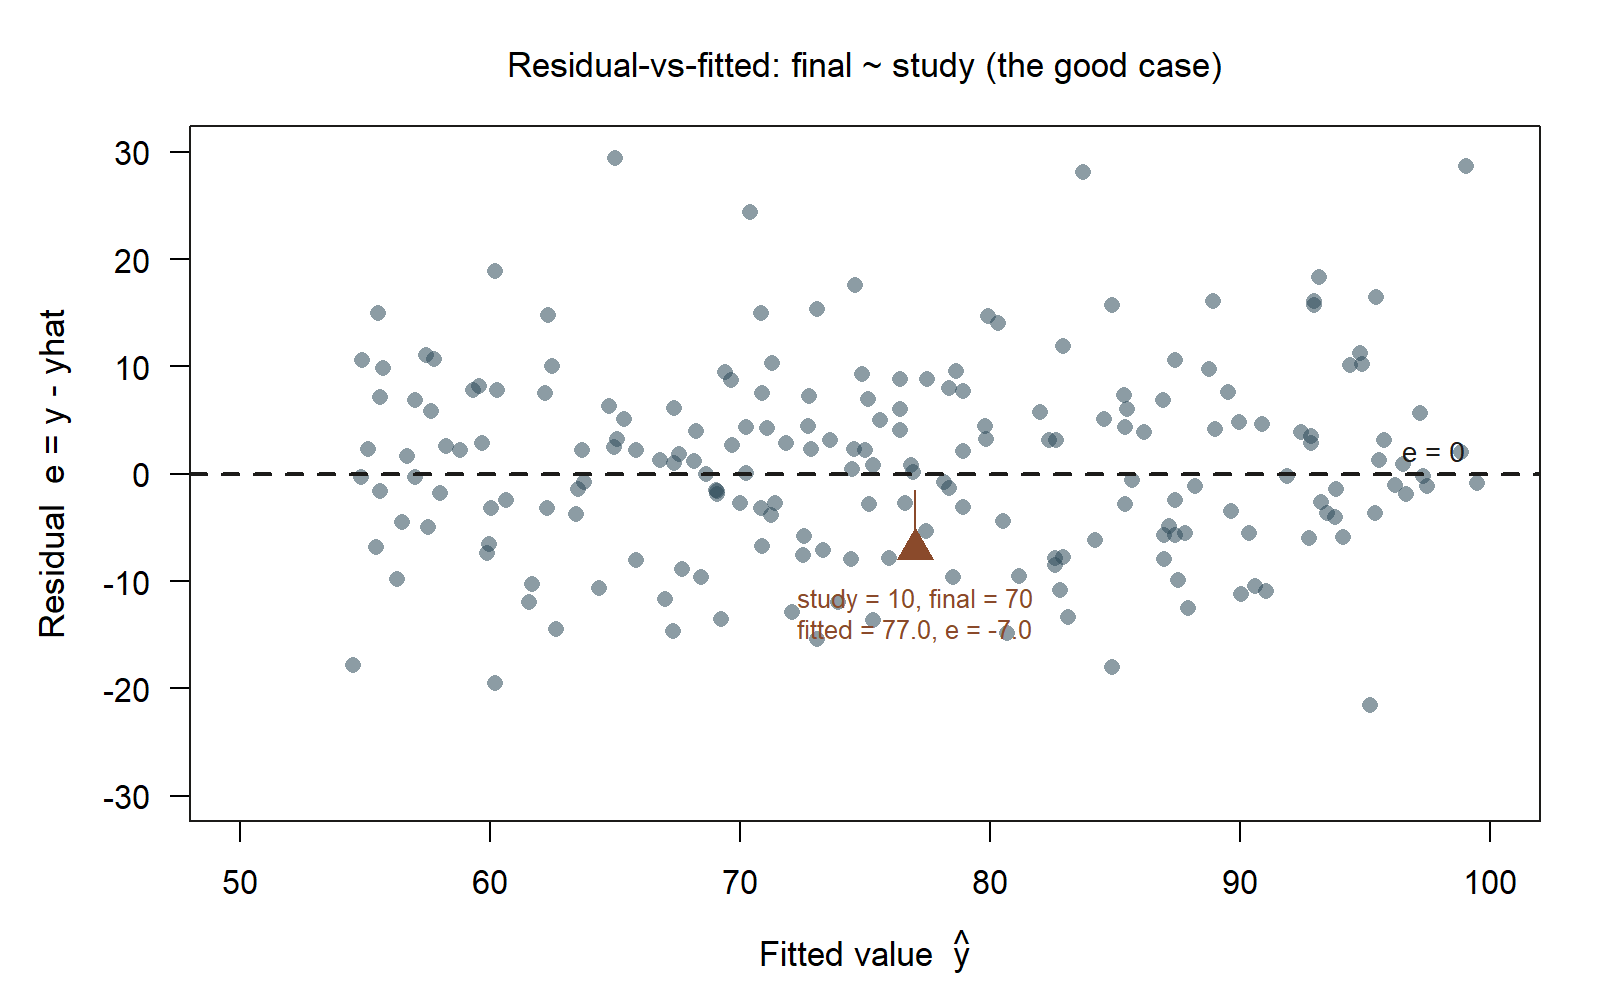
final ~ study (synthetic; seed set, set.seed(33003)). The horizontal dashed line marks zero residual; points scatter in a roughly even band above and below it, with no curvature and no funnel. The highlighted point — the student who studied 10 hours and scored 70 — has fitted value \(77.0\) and residual \(-7.0\), an ordinary miss well inside the scatter given \(s =
9.0\).
Reading the residual-vs-fitted plot. With these locked numbers, the picture you should expect for final ~ study is the good case: a roughly horizontal, shapeless band of points scattered above and below the zero line, fairly even in width from the low fitted values (around \(\hat{y}\approx 60\) for light studiers) to the high ones (around \(\hat{y}\approx 90\) for heavy studiers). Our example student at \(\hat{y} = 77\), \(e = -7\), sits a little below the band’s center — unremarkable, well inside the normal scatter given \(s = 9.0\). Because the band shows no bend and no flare, the straight-line form and the constant-spread assumption both look adequate here, which is what licenses us to take the slope of \(2.5\) and the interval \((2.0,\ 3.0)\) at face value.
Now imagine the two ways this plot could have gone wrong, because naming them is the skill:
- If the band had bowed — residuals negative in the middle, positive at the ends — that smile would say the real
final–studyrelationship curves: studying helps a lot at first and then flattens. A straight line would understate the middle and overstate the extremes, and the honest fix would be a transform ofstudyor an added curved term, not a re-reading of the same straight slope. - If the band had fanned open — tight at low \(\hat{y}\), wide at high \(\hat{y}\) — that funnel would say high-scoring students vary more around the line than low-scoring ones. The slope of \(2.5\) might survive, but the standard error \(\mathrm{SE}(b_1) = 0.25\) and the CI \((2.0,\ 3.0)\) would no longer be trustworthy, because they assume the single spread \(s = 9.0\) applies everywhere.
Neither pathology appears in this fit, so we conclude the model is adequate for describing the association over the observed study range — while remembering it is not licensed for extrapolation to, say, \(x = 0\) (the intercept \(52.0\) is an extrapolation, well below anyone’s study hours), nor for pinpoint prediction of any single student, since a typical miss is nine points.
Worked example — a curved residual plot in a new context (transfer)
Move to a fresh setting (also synthetic; seed set). A city utility models a household’s monthly electricity bill (bill, dollars) against the average outdoor temperature (temp, °F) for one summer, and fits a straight line by least squares. The slope comes out positive and the \(R^2\) looks respectable, so a hurried analyst reports “each degree warmer adds a few dollars to the bill” and moves on. Then someone plots the residuals.
util_fit <- lm(bill ~ temp, data = utility)   # utility: synthetic; seed set
plot(util_fit, which = 1)                      # residual-vs-fitted diagnostic
#> residuals form a clear U-shape: positive at low and high temps, negative in the middle
Here is that residual-vs-fitted plot, set beside the featureless band from the studyhabits example so the contrast is visible at a glance.
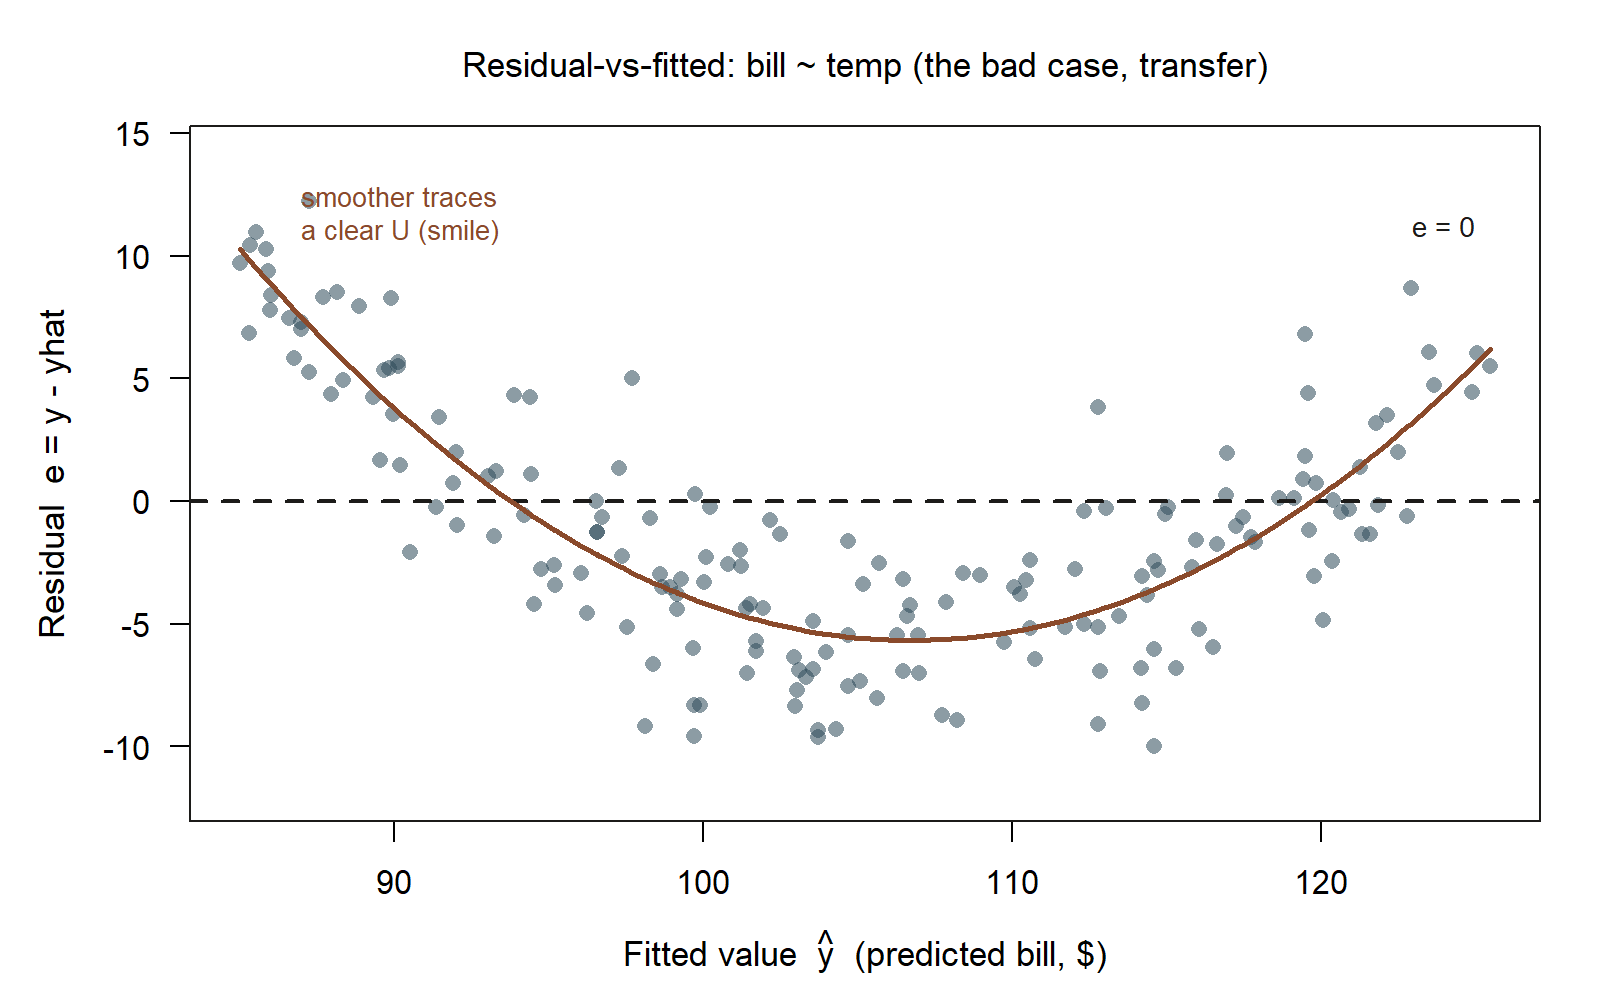
bill ~ temp (illustrative transfer example; synthetic, qualitative pattern only — no locked fit exists for this dataset). Unlike the studyhabits band above, this cloud traces a pronounced U: residuals sit above the zero line at the lowest and highest fitted bills, and below it in the middle, exactly the “smile” the surrounding prose describes.
The residual-vs-fitted plot shows a pronounced U (a “smile”): bills are higher than the line predicts at both cool and hot temperatures, and lower than predicted in mild weather. That curve is the residuals confessing a missing functional form. It makes physical sense — households run heating when it is cold and air-conditioning when it is hot, so cost bottoms out in the mild middle and rises on both ends. The true relationship between bill and temp is curved, and a straight line is the wrong shape, no matter how respectable its \(R^2\).
The lesson transfers exactly: the slope and \(R^2\) from the straight-line fit are not “a bit off,” they are summarizing the wrong model. The fix is to change the form — for example, model bill against a curved term in temperature (a transform such as distance from a comfortable baseline temperature), then re-plot the residuals and check that the smile has flattened into a featureless band. Diagnostics here did not just flag a problem; they named the missing structure and pointed at the remedy. Same plot, same three signs — only the context changed.
A common mistake
Two errors recur, and they are mirror images of each other.
Trusting a high \(R^2\) without looking at the residuals. A large \(R^2\) tells you the model explains a lot of the variance; it says nothing about whether the model has the right shape. You can have a high \(R^2\) sitting on top of a clear curve or a strong funnel — the line captures the broad trend while systematically missing the bends. \(R^2\) is a single number summarizing error size; the residual plot shows error structure, and structure is what invalidates a model. Never let a good \(R^2\) talk you out of plotting the residuals. (And the converse: our studyhabits fit has a modest \(R^2 = 0.34\) yet adequate residuals — modest fit, sound form.)
Over-reacting to one outlier. The opposite failure is to spot a single point off the band and either delete it on sight or declare the whole model broken. Neither is sound. One unusual point may be a data error, or it may be a real and informative observation — a genuinely surprising student. The disciplined move is to investigate: check whether it is also high-leverage (extreme in study), and ask whether the fit changes meaningfully with and without it. A point with high leverage and a large residual is worth real care; a lone large residual at an ordinary \(x\) usually is not. Deleting data to make a diagnostic plot prettier is not model criticism — it is hiding the evidence the plot just gave you.
Low-stakes self-checks (ungraded)
These are ungraded self-checks — no points, no submission, no answer key. Use them to test your reading of residuals.
- A student in the
studyhabitsdata studied \(x = 6\) hours and scored \(74\). Using \(\hat{y} = 52.0 + 2.5x\), find the fitted value and the residual, and say in one sentence whether this student did better or worse than the line predicts. - You fit a line and the residual-vs-fitted plot is a clean, flat, even-width band of scatter around zero. Which assumptions does that picture support, and which one (about \(x\) outside the data range) does it say nothing about?
- Sketch, in words, what each of these residual patterns means and what you would do next: (a) a smile,
- a sideways funnel that widens to the right, (c) one point far above the band at an extreme fitted value.
- Two models of the same data: Model A has \(R^2 = 0.80\) but a strongly curved residual plot; Model B has \(R^2 = 0.34\) and a featureless residual band. For a descriptive claim about the relationship’s shape, which model is more adequate, and why is \(R^2\) not the deciding factor?
- Explain in your own words why “is this model adequate for its purpose?” is a better question than “is this model true?”, and give one purpose for which our
final ~ studyline is adequate and one for which it is not.
Reading and source pointer
This week is grounded in ModernDive Chapter 5 — Basic Regression, specifically its treatment of residuals as observed-minus-fitted and the idea of checking a fitted line rather than only reading its coefficients. For the diagnostics framing — residual plots, the assumptions a linear model leans on, and “model adequacy” as a habit of mind — consult Beyond Multiple Linear Regression (Roback & Legler), Chapter 1 — Review of Multiple Linear Regression, which lays out the assumption set and the use of residual plots before the book moves on to generalized models. These notes are the course’s own synthesis, grounded in but not copied from the sources.
Public vs. graded
These notes, the examples, and the practice here are public and ungraded — study material only. No graded prompts, answer keys, rubrics, point values, or due dates appear on this site. Graded modeling checkpoints, labs, quizzes, homework/modeling memos, the midterm, the project, and the final live in Blackboard (the LMS), which is authoritative for due dates, submissions, and grades. If this page and Blackboard ever disagree, follow Blackboard.
Looking ahead
Next week we add a second predictor — moving from final ~ study to final ~ study + prior_gpa — and watch the study slope drop from \(2.5\) to \(1.8\) once incoming GPA is held constant, which opens the central idea of adjustment and confounding in multiple regression.
See also
- Week 3 — Simple linear regression — where \(\hat{y} = 52.0 + 2.5x\) was fit.
- Week 4 — Interpreting regression output — reading the slope, \(R^2\), \(s\), and the CI you are now checking.
- Week 6 — Multiple regression & adjustment — the next step, adding
prior_gpa. - Notation glossary and the modeling reference.