Week 7 — Confounding & explanation (midterm)
Crude vs adjusted comparisons, and the limits of explanation
The week question
When is a crude comparison misleading, and what does it actually mean to say a model “explains” an outcome? Last week you learned the mechanics of adding a second predictor and reading a partial slope. This week we turn that machinery toward the question it was really built for: telling apart an association that survives adjustment from one that was an artifact of who ended up in which group. The recurring studyhabits example carries the whole story — the study slope that was \(2.5\) points per hour on its own becomes \(1.8\) once incoming GPA is held constant — and the week is spent learning to read that change honestly, neither dismissing it nor overclaiming it.
This is also the midterm week. The midterm is in class on Friday, October 9, and it covers weeks 1–7 — the whole arc from “what is a statistical question?” through simple regression, diagnostics, multiple regression, and confounding. Everything on this public page is study material only; there is no graded content here, and nothing you read on this site is a test prompt or an answer key. Use the note to consolidate the modeling ideas; the operational details of the midterm live in Blackboard.
Why this matters
Almost every interesting question you will ever ask of data is observational. Nobody randomly assigned students to study eight hours a week versus two; students chose, and the students who chose to study more were already different in ways that also affect the exam — they tended to arrive with stronger preparation. That single fact is the source of most bad statistical claims you will encounter in the world: a headline reports that coffee drinkers live longer, that students who use a tutoring app score higher, that one hospital has better survival than another. In each case the two groups being compared differ in more than the one variable on the label.
A model earns its keep precisely here. The reason we add predictors is not to make \(R^2\) bigger for its own sake; it is to make the comparison we report fairer — closer to comparing like with like. When you hold prior_gpa constant, you are no longer comparing all heavy studiers to all light studiers; you are asking, among students with the same incoming GPA, how much does an extra study hour buy? That is a more honest question, and it usually gives a more modest answer. Learning to move between the crude and adjusted comparison — and to say clearly which one you are reporting and why — is the core skill of applied modeling. It is also the skill that separates a careful claim from a misleading one, which is the whole orientation of this course.
The harder lesson, and the one this week is built around, is that adjustment buys you fairness, not certainty. Holding prior_gpa constant removes the part of the crude study effect that ran through incoming GPA. It does nothing about the variables you did not measure. So the adjusted slope is a better number than the crude one, but it is still an association, and reading it as a guaranteed causal effect is the single most common overreach in observational modeling.
Learning goals
By the end of this week you should be able to:
- Define a confounder and explain, in plain terms, the two conditions that make a variable confound a relationship.
- Distinguish a crude (unadjusted) comparison from an adjusted one, and explain why adjusting can move — even reverse — a conclusion.
- Read the change from a crude slope of \(2.5\) to an adjusted slope of \(1.8\) in the
studyhabitsmodel as evidence of confounding byprior_gpa, and state precisely what that change does and does not license. - Articulate the limits of the word “explain” for observational data: why adjustment is not a causal guarantee, and what conditions would have to hold for the adjusted slope to be a causal effect.
- Recognize the mistake of claiming that adjustment “removes confounding entirely,” and the related mistake of reading any adjusted association as a cause.
Core vocabulary
- Confounder. A variable associated with both the predictor of interest and the response, and not lying on the causal path between them. It distorts the crude comparison.
- Crude (unadjusted) comparison. The relationship between predictor and response with no other variables in the model — e.g. the simple-regression slope of
finalonstudyalone. - Adjusted comparison. The relationship after including other variables, so the reported slope is a partial slope: the association holding the other predictors constant.
- Holding constant / adjusting for. The interpretive move attached to a partial slope: comparing observations that share the same value of the other predictors.
- Explanation vs. prediction. Explanation asks why the outcome varies and reaches for a mechanism; prediction only asks for an accurate guess. A model can predict well and explain nothing.
- Observational data. Data where the values of the predictor were not assigned by the analyst, so groups can differ in unmeasured ways. The default setting for confounding.
Concept development
What a confounder is
A confounder is not just “another variable in the data.” It is a variable that meets two specific conditions at once. First, it is associated with the predictor you care about. Second, it is associated with the response, through some path other than the predictor itself. When both hold, the crude comparison between predictor and response is contaminated: part of what looks like the predictor’s effect is really the confounder’s effect riding along.
In the studyhabits data, the predictor of interest is study and the response is final. The candidate confounder is prior_gpa, incoming GPA. Both conditions are met. Stronger students — higher prior_gpa — tend to study more, so prior_gpa is associated with study. And stronger students also tend to score higher on the final for reasons that have nothing to do with this semester’s study hours (better study skills, stronger background, more academic momentum), so prior_gpa is associated with final. The result is that when you line students up by study hours, the heavy studiers are also, on average, the higher-GPA students. The crude study slope is therefore partly a study effect and partly a prior_gpa effect wearing a study costume.
It helps to notice what is not a confounder. A variable on the path between predictor and response — say, “hours of focused practice” that study hours cause and that in turn raises the score — is a mediator, not a confounder, and adjusting for it answers a different question. And a variable unrelated to either study or final is just noise; adding it changes little. The two-condition test is what makes prior_gpa worth worrying about specifically.
Crude vs adjusted comparison, and why adjustment can change a conclusion
The crude comparison is the simple regression from earlier weeks:
\[\hat{y} = 52.0 + 2.5\,x \qquad (x = \texttt{study}).\]
The slope \(b_1 = 2.5\) says that across all students, each additional weekly study hour is associated with a \(2.5\)-point higher predicted final, on average. But “across all students” hides the problem: the students with more study hours are not otherwise comparable to those with fewer.
The adjusted comparison puts prior_gpa in the model:
\[\hat{y} = 35.0 + 1.8\,x_1 + 8.0\,x_2 \qquad (x_1 = \texttt{study},\ x_2 = \texttt{prior\_gpa}).\]
Now the study slope is \(1.8\). This is a partial slope: among students with the same incoming GPA, each extra study hour is associated with a \(1.8\)-point higher predicted final, on average. The slope dropped from \(2.5\) to \(1.8\) because some of the crude association was confounding — it ran through prior_gpa, and once GPA is held constant, that borrowed portion is handed back to where it belongs. The prior_gpa slope of \(8.0\) says that, holding study hours fixed, a one-point higher incoming GPA is associated with an \(8.0\)-point higher predicted final, which is a large effect and explains why GPA was worth adjusting for in the first place.
The general lesson is that adjustment can move a conclusion, and the direction of the move tells you something. A slope that shrinks under adjustment (as here, \(2.5 \to 1.8\)) was inflated by a confounder that pushed predictor and response the same way. A slope that grows was being masked. And in the extreme — Simpson’s paradox — a slope can flip sign entirely, so that a relationship that looks positive crudely is negative within every subgroup. The crude number is never automatically the “real” one; which comparison is fair depends on what you are willing to assume groups share.
The limits of “explain” with observational data
Here is the temptation. The adjusted slope of \(1.8\) is a better number than the crude \(2.5\), so it is easy to slide into reading it as the causal effect of studying — “an extra hour of study causes a \(1.8\)-point gain.” That sentence is one step too far, and the step is worth naming.
Adjustment removes confounding by the variables you put in the model. It does nothing about the variables you left out. Suppose conscientiousness — a stable trait we never measured — makes students both study more and score higher beyond what GPA captures. Then even the adjusted slope of \(1.8\) still contains some of that trait’s effect, and the “true” causal effect of an extra study hour could be smaller still. You cannot adjust for what you did not measure, and you can never be sure you measured everything that matters. This is the unmeasured-confounding problem, and it is permanent in observational data.
So what can you say? The adjusted slope is the best available estimate of the study–final association among students alike on the predictors in the model. It is a fairer comparison than the crude one, and a more defensible thing to report. To call it causal, you would need the comparison to be as good as random assignment — every relevant confounder measured and adjusted, no reverse causation, correct functional form. Those are strong, mostly untestable assumptions. The honest stance is to report the adjusted association, state the variables held constant, and name unmeasured confounding as the reason you stop short of “cause.” Explanation, in this course, means building the fairest comparison you can defend and being explicit about its remaining limits — not declaring victory because \(R^2\) went up.
Worked examples
Worked example — studyhabits: the crude slope shrinks under adjustment
The data are synthetic; seed set (set.seed(33003)), \(n = 200\) students in one intro course. We fit the crude model and then the adjusted model and compare the study slope across the two.
set.seed(33003)
# studyhabits: synthetic campus learning-analytics data, n = 200

crude <- lm(final ~ study, data = studyhabits)
coef(crude)
#> (Intercept)       study
#>        52.0         2.5      # crude study slope = 2.5 points / hour

adjusted <- lm(final ~ study + prior_gpa, data = studyhabits)
coef(adjusted)
#> (Intercept)       study   prior_gpa
#>        35.0         1.8         8.0  # study slope drops to 1.8; gpa slope = 8.0
#> Adjusted model R^2 = 0.51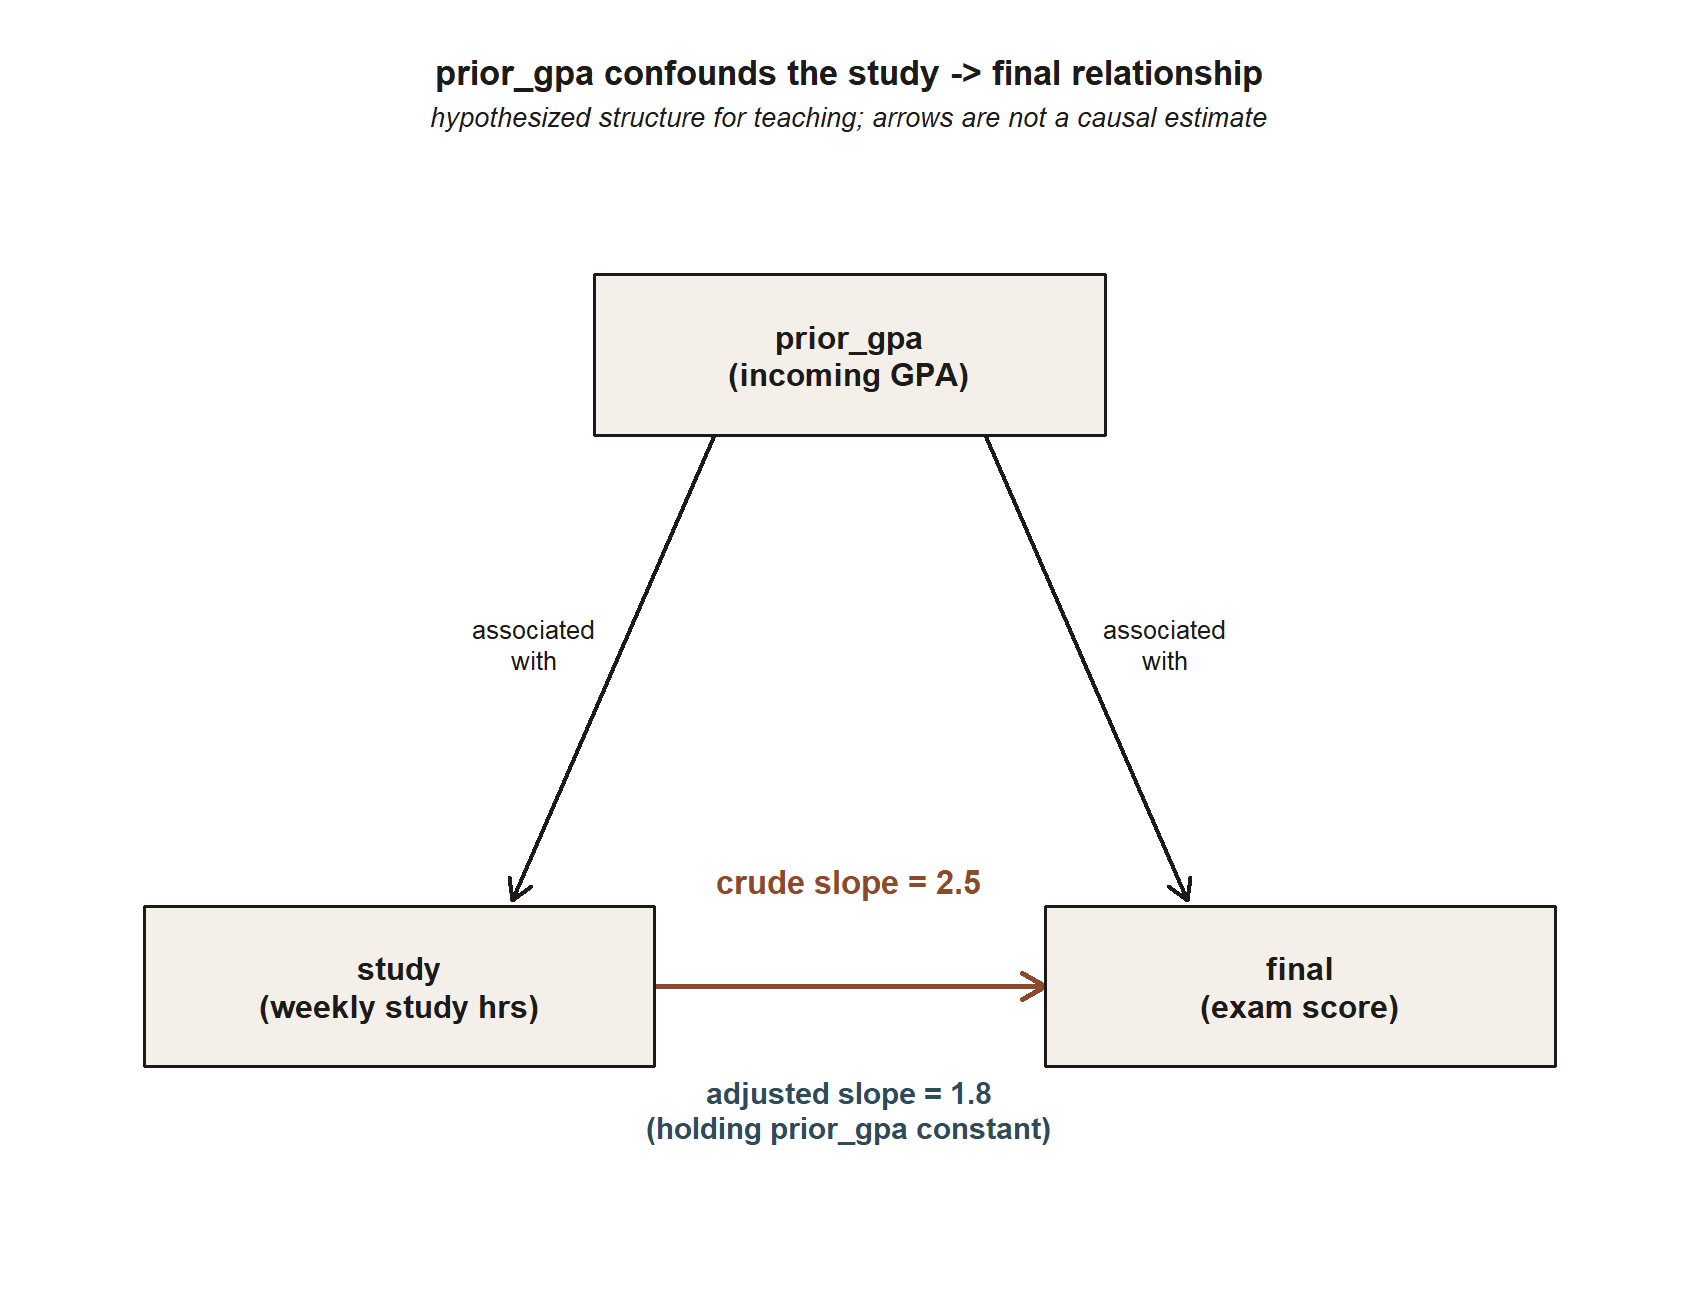
prior_gpa sits upstream of both study and final, so it confounds the crude comparison. The diagram shows the hypothesized structure: prior_gpa is associated with study and with final, and study is associated with final. The number on the study -> final arrow depends on whether prior_gpa is held constant — crude (ignoring prior_gpa) it is \(2.5\); adjusted (holding prior_gpa constant) it is \(1.8\). The \(0.7\)-point gap is the portion of the crude slope that was really prior_gpa’s effect riding along with study (synthetic; seed set).
Read the comparison carefully. The crude slope is \(2.5\): ignoring everything else, each extra weekly study hour goes with a \(2.5\)-point higher predicted final, on average. The adjusted slope is \(1.8\): among students with the same incoming GPA, each extra study hour goes with a \(1.8\)-point higher predicted final, on average. The \(0.7\)-point difference between \(2.5\) and \(1.8\) is the part of the crude association that was confounding by prior_gpa — stronger students study more and score higher, so the crude slope was borrowing some of GPA’s credit. The prior_gpa slope of \(8.0\) confirms GPA matters a lot on its own (an \(8.0\)-point gain per GPA point, holding study fixed), which is exactly what makes it a confounder worth adjusting for. The model’s \(R^2 = 0.51\) says the two predictors together account for about half the variation in final, up from \(0.34\) for study alone.
What the change licenses: reporting the fairer comparison. The number you should quote when asked “how much is study associated with final?” is the adjusted \(1.8\), with the phrase “holding incoming GPA constant,” because the crude \(2.5\) conflates studying with prior preparation.
What the change does not license: the sentence “studying one more hour causes a \(1.8\)-point gain.” We adjusted for GPA, not for everything. Unmeasured traits — motivation, study skill, course load — could still inflate the \(1.8\). The defensible claim is associational and conditional, not causal. A residual plot of the adjusted model would still be worth a look before trusting the fit, but no diagnostic can rescue you from a confounder you never measured.
Worked example — transfer: ice-cream sales and drownings
Now move the idea to a new context — synthetic; seed set — so you can see it travel. A city’s daily records show that on days with higher ice-cream sales, more drownings occur. The crude comparison is striking and, taken at face value, absurd: it would suggest ice cream drives drownings.
set.seed(33003)
# city_days: synthetic daily records (illustrative)

crude_ice <- lm(drownings ~ ice_cream_sales, data = city_days)
#> ice_cream_sales slope > 0   (crude: more sales, more drownings)

adjusted_ice <- lm(drownings ~ ice_cream_sales + temperature, data = city_days)
#> ice_cream_sales slope shrinks toward 0 once temperature is held constant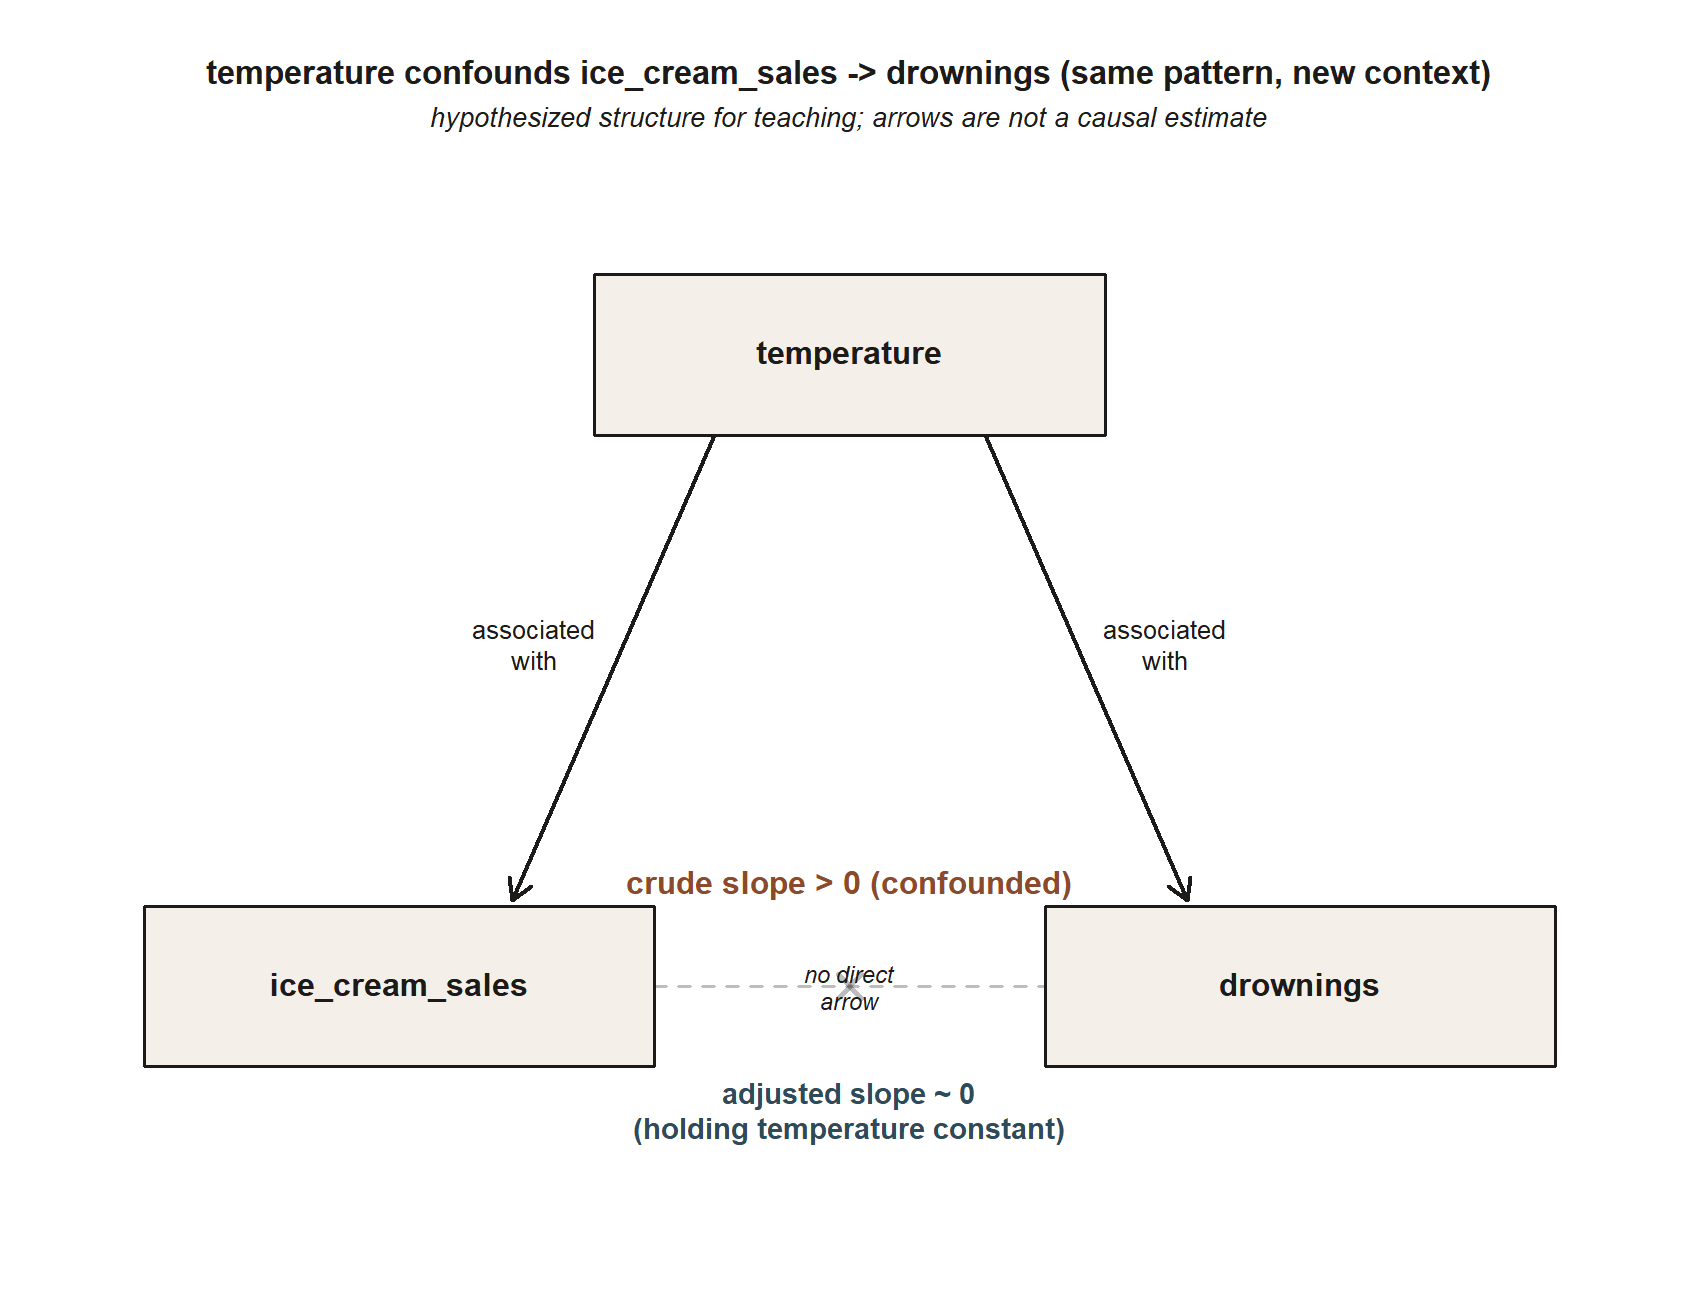
temperature confounds ice_cream_sales -> drownings, and there is no direct arrow between them. This is the identical structural pattern as the studyhabits diagram above — a variable upstream of both the predictor and the response — just with temperature in the role prior_gpa played. Because the entire crude association here is confounding, the diagram deliberately omits a solid ice_cream_sales -> drownings arrow (illustrative pattern consistent with the note’s own description, not an exact locked number).
The confounder is temperature. Hot days drive ice-cream sales up and drive more people to swim, which raises drownings — temperature meets both conditions of a confounder. The crude ice_cream_sales slope is positive only because both variables ride the weather. Once you adjust for temperature, the ice_cream_sales slope collapses toward zero: among days at the same temperature, ice-cream sales tell you essentially nothing about drownings. Here adjustment does not merely shrink the slope a little, as it did for study; it dissolves the association almost entirely, because the entire crude relationship was confounding.
This is the same move as the studyhabits example, just with the confounder doing all the work instead of some of it. And it carries the same caution in reverse: the fact that one adjusted slope vanished does not mean adjustment is a truth machine. It means temperature was the right variable to hold constant here. In a messier problem you might adjust for temperature and still miss something — humidity, day of week, a holiday — and the same humility applies.
A common mistake
The mistake comes in two closely related forms, and both are about overclaiming what adjustment delivers.
The first is believing adjustment removes confounding entirely. It does not. Adjusting for prior_gpa removes confounding by prior_gpa and by nothing else. Any confounder you did not measure — conscientiousness, course difficulty, hours of sleep — is still in the slope, untouched. People say “we controlled for GPA, so the comparison is clean,” and the word “clean” is doing more work than the model can support. The model is cleaner, not clean. The correct phrasing names exactly what was held constant and stops there: “adjusting for incoming GPA,” not “controlling for confounding.”
The second is reading an adjusted association as causal. Because the adjusted slope of \(1.8\) is the better number, it is tempting to promote it from “association, holding GPA constant” to “the effect of studying.” But “effect” and “cause” are claims about what would happen if you intervened — if you made a student study one more hour — and observational adjustment cannot deliver that without assuming you have measured and adjusted for every relevant confounder, an assumption that is strong and untestable. The tell is verbs: “associated with,” “predicts,” “goes with” are safe; “causes,” “leads to,” “increases” smuggle in causation. Keep your verbs honest and the claim stays defensible. Reserve causal language for randomized experiments, or for observational analyses that argue explicitly and carefully for why the no-unmeasured-confounding assumption is plausible.
Low-stakes self-checks (ungraded)
These are ungraded self-checks — no points, no submission, no answer key. Use them to test whether the week landed, and bring puzzles to class.
- State the two conditions a variable must meet to confound the
study–finalrelationship. Then argue, in two sentences, whyprior_gpameets both and why “the student’s exam score itself” does not. - The
studyslope is \(2.5\) crude and \(1.8\) adjusted. In one sentence each, write the correct interpretation of each number, making sure the adjusted one names what is held constant. - A classmate writes: “We adjusted for GPA, so the \(1.8\) is the causal effect of studying.” Identify the overclaim and rewrite the sentence so it is defensible.
- In the ice-cream example the adjusted slope collapsed to near zero; in the
studyhabitsexample it only shrank from \(2.5\) to \(1.8\). Explain what that difference tells you about how much of each crude association was confounding. - Name one variable not in the
studyhabitsdata that could still confound the adjustedstudyslope, and say which direction you think it would push the slope and why.
Reading and source pointer
Read ModernDive Chapter 6 — Multiple Regression alongside this note, with attention to its treatment of models with multiple predictors and the interpretation of a slope “holding the other variables constant.” This week extends Chapter 6’s mechanics into the why — confounding, adjustment, and the gap between a fair comparison and a causal one.
These notes are the course’s own synthesis, grounded in but not copied from the sources.
Public vs. graded
These notes, the examples, and the practice here are public and ungraded — study material only. No graded prompts, answer keys, rubrics, point values, or due dates appear on this site. Graded modeling checkpoints, labs, quizzes, homework/modeling memos, the midterm, the project, and the final live in Blackboard (the LMS), which is authoritative for due dates, submissions, and grades. If this page and Blackboard ever disagree, follow Blackboard.
Looking ahead
Next week we turn from numeric predictors to categorical ones — fitting final ~ format and reading the coefficients as group differences from a baseline — which extends the same adjustment logic to comparing in-person, hybrid, and online sections fairly.
See also
- Week 6 — Multiple regression & adjustment — the partial-slope mechanics this week builds on.
- Week 8 — Categorical predictors & group comparisons — adjustment with grouping variables.
- Notation glossary and modeling reference.