Week 15 — Final design memo and review
The whole design-and-evidence arc as one picture
The week question
You have spent the term taking studies apart. This last meeting puts the pieces back together. The whole course has been one machine for turning a vague wish — “does the Focus workshop help?”, “does the tutoring center work?”, “do our students sleep enough?” — into a defensible claim, and for knowing exactly where that claim stops. The week question is therefore a single integrating one: given any study, can you trace it through one fixed sequence — question, unit, measurement, sampling vs assignment, design, threats, what the data support — and write a design memo that states the claim and its honest boundary?
Nothing new is introduced today. Instead you assemble the term’s three recurring studies into one picture and practice reading any fourth study against it. The skill being reviewed is not a formula; it is the discipline of never letting a number outrun the design that produced it.
Why this matters
A design memo is the deliverable a working analyst actually hands over, and it is judged on whether the claim matches the design — not on whether the arithmetic is tidy. The recurring failure across every week was the same shape in different clothes: a real number, computed correctly, attached to a claim the design could not support. The experiment that earned a causal verb; the observational gap that did not; the survey estimate that ignored who never answered. Each was a true number and a false sentence.
This synthesis matters because the whole point of the course is communication under constraint. You will be the person in the room who can say, in one breath, what was sampled, what was assigned, what the confounder was, and what the claim is and is not. The map below is the thing you carry into the final project and the cumulative final: not more machinery, but the habit of placing any study on it before you believe a word of its conclusion.
Learning goals
By the end of this review you should be able to:
- Walk any study through the fixed arc — question → unit → measurement → sampling vs assignment → design → threats → what the data support → memo — and name what each step contributes.
- State the signature distinction cleanly: random sampling earns population claims; random assignment earns causal claims, and the two are independent design choices that are not interchangeable.
- Read the three recurring studies side by side and say precisely what each one’s headline number licenses: the experiment’s causal \(d = 3.0\), the observational adjusted \(+3.0\) (under stated assumptions), and the survey’s population \(\hat p = 0.45\) with its nonresponse bound.
- Place a brand-new study on the map, identify its leading threat to validity, and bound its claim.
- Draft a design memo whose conclusion sentence cannot be quoted out of context — because the boundary is in the sentence.
Core vocabulary
These are the term’s load-bearing terms, gathered for the memo. Full definitions live in the design glossary; the design families sit side by side in the design reference.
- Unit of analysis — the entity a row describes and that the design samples or assigns; analyze at the design’s grain, never finer.
- Random sampling — the mechanism that selects units into the sample; earns population claims.
- Random assignment — the mechanism that allocates treatment to units; earns causal claims.
- Estimand vs estimate — the target effect you want (e.g. the ATE \(E[Y(1) - Y(0)]\)) vs the one realized number \(\hat d\) you got.
- Confounder — a pre-treatment common cause of treatment \(Z\) and outcome \(Y\); opens a backdoor path you must close by adjustment. Bad control — adjusting for a post-treatment variable (mediator) or a collider.
- Internal vs external validity — does the design support the causal claim here vs does it generalize there.
- Coverage / nonresponse — frame \(\neq\) population (who can never be selected) and respondents \(\neq\) invited (who chose not to answer); both are population-claim threats, not arithmetic ones.
- Design effect \(\text{deff}\) — how a sampling scheme multiplies the SRS variance; \(\text{deff} < 1\) (stratified) tightens, \(\text{deff} > 1\) (cluster) inflates.
- Design memo — the written artifact that connects the question to the design to the bounded claim.
Concept development
The arc as one fixed sequence
Every study you met this term moves through the same eight stations, and most design errors are a station skipped. You start with a question about a population or a process. You fix the unit of analysis — the student, the dorm floor, the matched pair — because the design samples or assigns at that grain and you must analyze at the same grain (assigning floors but testing individuals is the wrong-unit error). You pin down measurement: the construct (“study skill,” “adequate sleep”) and its operational definition, with its error named rather than wished away.
Then comes the fork the whole course pivots on — sampling vs assignment. Random sampling is about how units enter the data and licenses talk about a population; random assignment is about how treatment reaches units and licenses talk about causation. A study can have one, both, or neither, and confusing the two is the single most expensive mistake in applied statistics. From there you name the design (a completely randomized or blocked experiment, an adjusted observational comparison, an SRS or stratified or cluster survey), enumerate the threats that design leaves open, read what the data support, and write the memo. The memo is just this sequence made legible to someone who was not in the room.
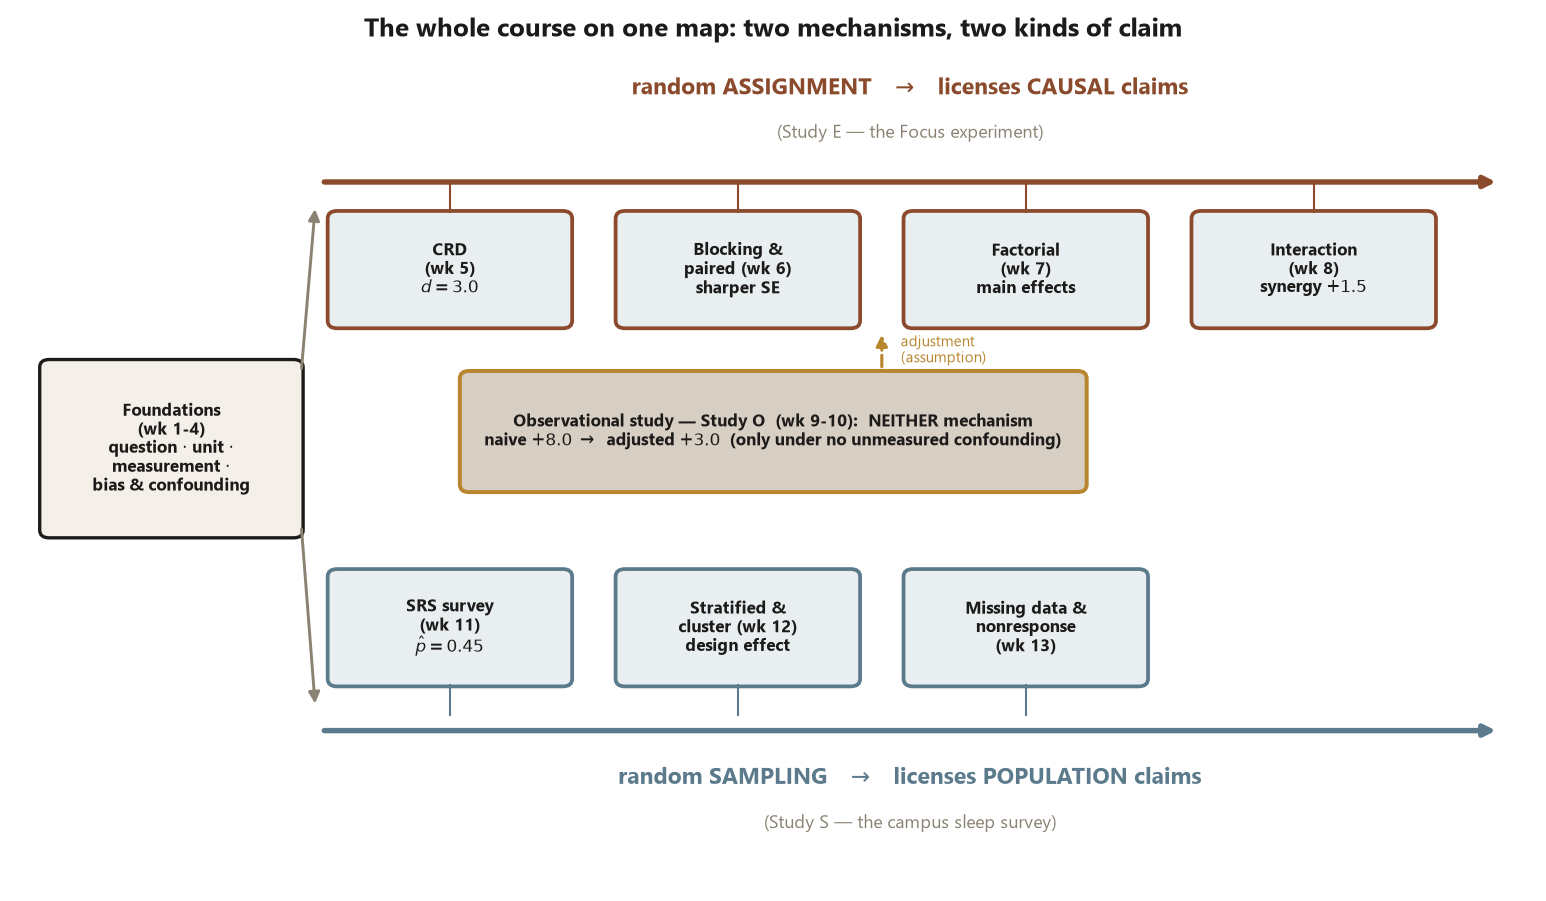
The three studies as a map of what designs license
The term’s three studies are one campus world seen through three designs, and laid side by side they are the map. The point is not their numbers but what each number is allowed to say.
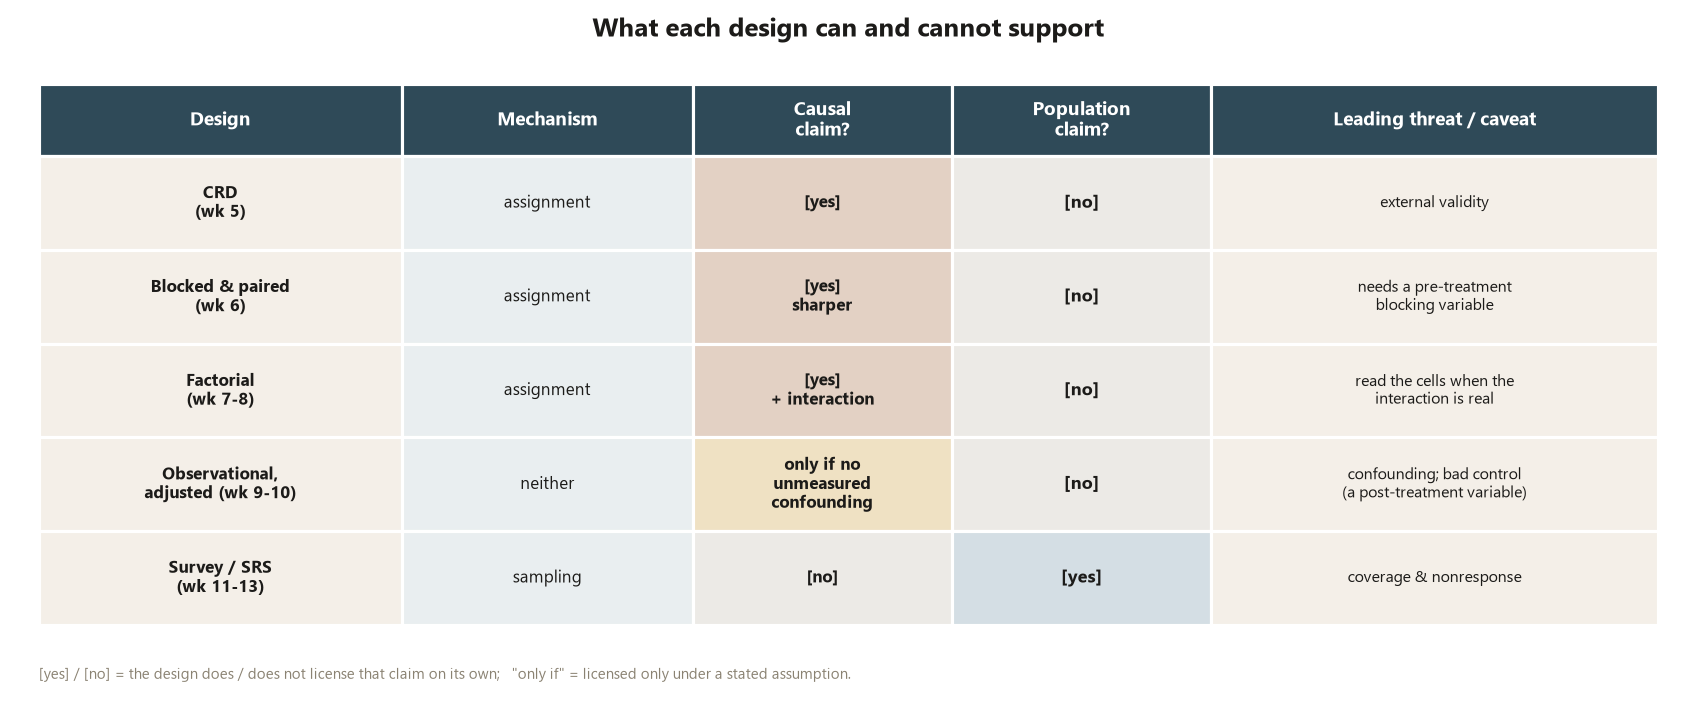
| Study | Design | Mechanism present | Headline (synthetic) | Licenses | Leading threat |
|---|---|---|---|---|---|
| E — Focus workshop | Completely randomized experiment | random assignment | causal \(d = 8.0 - 5.0 = 3.0\) pts | a causal claim about the workshop | external validity (generalizing past the studied students) |
| O — tutoring center | Observational, adjusted | neither random mechanism | adjusted \(+3.0\) (naive \(+8.0\)) | a causal claim only under “no unmeasured confounding” | confounding by prior ability (a backdoor path) |
| S — sleep survey | Sample survey (SRS) | random sampling | population \(\hat p = 0.45\) | a population proportion claim | nonresponse — the bound \([0.27, 0.67]\) |
Read across the table and the course’s spine appears. Study E earns the word causes because a coin, not the students, decided who got the workshop — random assignment broke every backdoor path. Study O reaches the same adjusted \(+3.0\) only by assuming the one measured confounder (prior ability) was the whole story; the verb “causes” is on loan, repayable the moment an unmeasured confounder appears. Study S says nothing causal at all — random sampling buys a claim about the undergraduate population’s sleep, and even that claim is hostage to the 240 who never answered. Same campus, three designs, three different licenses.
Why a true number can still be a false claim
The deepest review lesson is that arithmetic is never the weak link — interpretation is. Every headline above is computed correctly within its study, yet each invites a sentence the design cannot back. The naive observational \(+8.0\) is a real difference in means; reading it as the workshop’s effect overstates the truth by the \(+5.0\) of confounding. The survey’s 95% sampling interval \((0.40, 0.50)\) is correctly computed; quoting it as the population answer ignores that the nonresponse bound \([0.27, 0.67]\) is far wider and is the real uncertainty. Even the experiment’s borderline \(p \approx 0.057\) tempts a “no effect” reading when what licenses the causal interpretation is the randomization, not the p-value. The memo’s job is to make the claim and the boundary the same sentence, so the number can never be quoted without its leash.
Worked examples
Worked example — the recurring three studies, walked through the arc together
Walk the term’s three studies through the arc one final time, side by side, on their locked numbers.
Question and unit. Study E asks whether the Focus workshop causes higher gain scores (unit: the student). Study O asks whether using the tutoring center causes higher end-of-term scores (unit: the student). Study S asks what proportion of undergraduates get adequate sleep (unit: the student, but the claim is about the population of \(12{,}000\)).
Sampling vs assignment. Study E: random assignment (30 treatment / 30 control), no random sampling. Study O: neither — students self-selected into the center. Study S: random sampling (an SRS of \(n = 600\)), no assignment.
Design, data, claim. The numbers below are the term’s locked, synthetic values.
set.seed(45403)  # all three studies share one synthetic campus world

# --- Study E: completely randomized experiment (random ASSIGNMENT -> causal) ---
ybar_T <- 8.0; ybar_C <- 5.0
d_E    <- ybar_T - ybar_C          # 3.0 points  (the causal estimate)
s_p    <- 6.0
SE_E   <- s_p * sqrt(1/30 + 1/30)  # ~1.55
t_E    <- d_E / SE_E               # ~1.94  -> two-sided p ~ 0.057 (borderline)
# Claim LICENSED: the workshop CAUSES ~3.0 more points -- a coin assigned treatment.

# --- Study O: observational, adjusted (NEITHER mechanism) ---
naive_O    <- 82.0 - 74.0          # +8.0  (users vs non-users, self-selected)
adjusted_O <- 3.0                  # +3.0 after stratifying on PRIOR ABILITY (a confounder)
confounding <- naive_O - adjusted_O# +5.0 of the gap was confounding, not effect
# Claim LICENSED: ~+3.0 causal ONLY IF prior ability is the only confounder (assumption).

# --- Study S: SRS survey (random SAMPLING -> population) ---
phat <- 162 / 360                  # 0.45  among 360 respondents (of 600 invited)
SE_S <- sqrt(phat * (1 - phat) / 360)  # ~0.026 ; 95% CI ~ (0.40, 0.50)
lo   <- 162 / 600                  # 0.27  (if all 240 nonrespondents slept < 7h)
hi   <- (162 + 240) / 600          # 0.67  (if all 240 slept >= 7h)
# Claim LICENSED: ~45% of the POPULATION sleep enough -- but nonresponse bound [0.27, 0.67].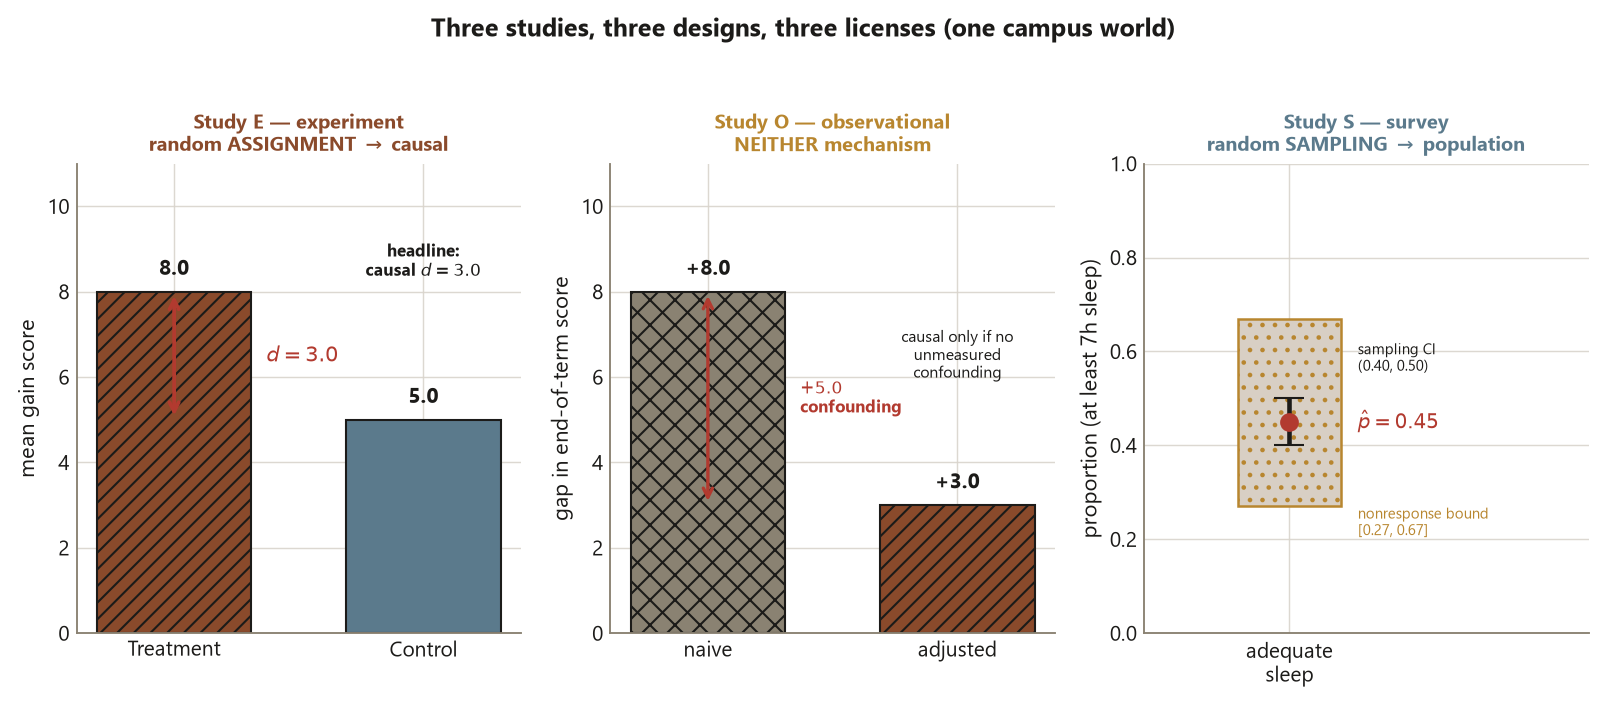
Interpretation, naming the design move. In Study E, random assignment is what was done to the units, so the \(d = 3.0\) is a causal effect; the borderline \(p \approx 0.057\) tempers our certainty about the size but not the kind of claim. In Study O, nothing was randomized: prior ability is a pre-treatment confounder that drove both center use and the outcome, so the naive \(+8.0\) overstated the effect by \(+5.0\); the adjusted \(+3.0\) is causal only under the assumption that prior ability was the only backdoor — adjusting for “hours studied this term” would be a bad control because it is post-treatment. In Study S, random sampling is what was done, so \(\hat p = 0.45\) is a population claim; the sampling CI \((0.40, 0.50)\) is dwarfed by the nonresponse bound \([0.27, 0.67]\), which — not sample size — is the real threat. Three designs, three claims, no verb out of place.
Worked example — transfer: placing a new study on the map
Here is a study you have not seen. A campus dietitian wants to know whether a new dorm salad bar improves students’ diet quality. She compares dorms that received the salad bar this year against dorms that did not, on an end-of-semester diet-quality score (illustrative, distinct numbers): salad-bar dorms average \(71\), comparison dorms average \(66\), a naive gap of \(+5\) points. She concludes “the salad bar raises diet quality by 5 points.”
Walk it through the arc to place it on the map and bound the claim.
set.seed(45403)  # illustrative transfer scenario -- numbers distinct from the three studies

salad_mean <- 71; comp_mean <- 66
naive_gap  <- salad_mean - comp_mean   # +5 points (a real difference in means)
# Unit: the DORM (the salad bar landed on whole dorms), so analyze at the dorm grain.
# Mechanism: NO random assignment -- dorms that got the bar were chosen, not coin-flipped.
# Threat: confounding -- newer / wealthier dorms may attract both the bar AND health-minded students.
Interpretation, naming the design move. This is an observational comparison, not an experiment: the salad bar was placed, not randomly assigned, so the \(+5\) is an association, and “raises” is the wrong verb. The leading threat is confounding — if newer or upper-class dorms both got the bar and house more diet-conscious students, prior diet habits open a backdoor path, exactly Study O’s structure. The honest claim is “salad-bar dorms scored about 5 points higher; whether the bar caused it depends on adjusting for pre-existing dorm differences, and we have not.” Note too the unit: the intervention landed on whole dorms, so the analysis grain is the dorm, not the individual student (the wrong-unit trap). Placed on the map, this study sits beside Study O — and inherits its caveats, not Study E’s license.
A common mistake
Because this is the review, the trap is the master trap that contains all the others: letting a correctly computed number license a claim the design cannot support. It wears many faces — reading the survey’s \(\hat p = 0.45\) as the settled population answer while the nonresponse bound \([0.27, 0.67]\) sits unmentioned; calling the observational \(+8.0\) (or even the adjusted \(+3.0\)) an effect without flagging the no-unmeasured-confounding assumption; analyzing dorm-level treatment at the student level; or treating the experiment’s borderline \(p \approx 0.057\) as proof of “no effect” when randomization, not the p-value, is what fixes the kind of claim. The fix is the same every time and it is the whole memo discipline: name the mechanism (sampling? assignment? neither?), name the threat the design leaves open, and write the boundary into the conclusion sentence so the number can never travel without it.
Low-stakes self-checks (ungraded)
These are for your own review — no points, no submission, just practice placing studies on the map.
- For each recurring study, say in one sentence which mechanism is present (sampling, assignment, both, or neither) and exactly which claim it licenses. Check yourself against the side-by-side table.
- The naive tutoring-center gap is \(+8.0\) and the adjusted gap is \(+3.0\). What does the \(+5.0\) difference represent, and what single assumption makes the adjusted \(+3.0\) a causal claim?
- Write the survey result two ways: the sampling CI \((0.40, 0.50)\) and the nonresponse bound \([0.27, 0.67]\). Which one should headline an honest memo, and why is the wider one the real story?
- Take the salad-bar transfer study. Name its unit of analysis, its leading threat, and rewrite the dietitian’s “raises diet quality by 5 points” as a claim the design can actually support.
- Invent your own fourth campus study in a sentence, then trace it through the arc out loud. Where does it land on the map — beside E, beside O, or beside S?
Reading and source pointer
This week is grounded in the instructor notes (primary) as a synthesis of the whole term — the question→unit→measurement→sampling-vs-assignment→design→threats→claim arc and the design-memo structure. No new source chapter is introduced; for the underlying concepts revisit the IMS study-design and sampling material and the ModernDive randomization/simulation material cited in the weeks they anchor. These notes are the course’s own synthesis, grounded in but not copied from the sources.
Public vs. graded
These notes, the examples, and the practice here are public and ungraded — study material only. No graded prompts, answer keys, rubrics, point values, or due dates appear on this site. Graded design checkpoints, weekly quizzes, design memos and homework, applied design labs, the midterm, the final design project, and the final exam live in Blackboard (the LMS), which is authoritative for due dates, submissions, and grades. If this page and Blackboard ever disagree, follow Blackboard.
Looking ahead
Next week there is no next week — this is the last class meeting (Mon Dec 7), followed by consultation day and the final-exam window. What is ahead is the work you take off the map: the final design project, where you choose and justify a design and bound its claim, and the cumulative final, which asks you to do the same in miniature across many studies. Carry the arc and the side-by-side table into both. The exact exam block and all deadlines live in Blackboard.
See also
- Week 14 — Study critique and design-memo workshop — where you built the memo this week assembles.
- Week 09 — Observational studies and Week 10 — Causal diagrams and backdoor reasoning — the association-vs-causation and confounding spine the transfer example leans on.
- Week 03 — Random sampling vs random assignment — the signature distinction the whole map turns on.
- Design glossary — every load-bearing term in one place.
- Design reference — the design families side by side.
- Causal-diagram guide — confounders, backdoors, adjustment sets, and bad controls.