Week 9 — Observational studies
Association, adjustment, and the limits of causal language
The week question
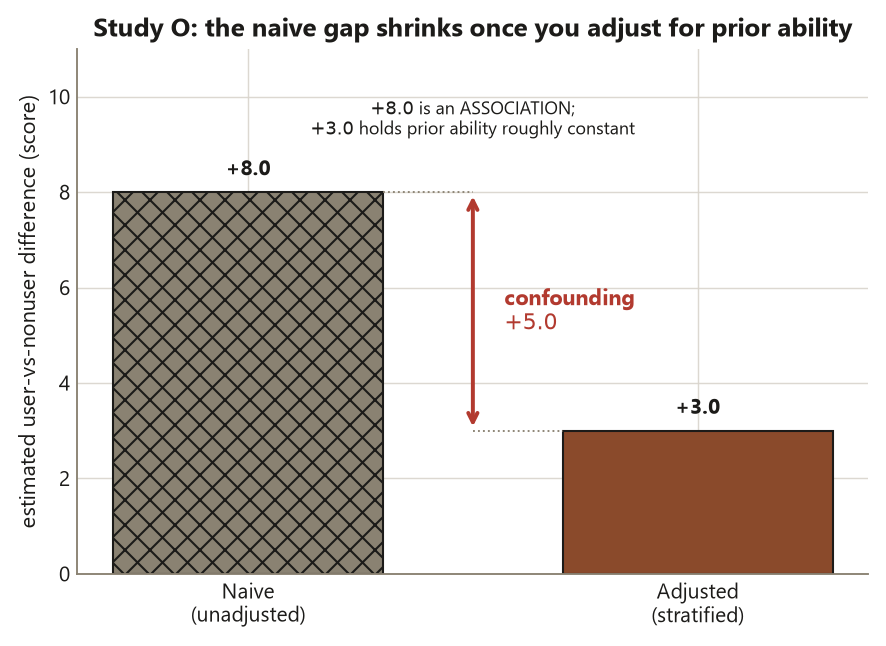
When you cannot randomly assign who gets the treatment, the groups you compare were assembled by something other than a coin flip — usually by the units’ own choices. So the week’s question is sharp: if no one was randomly assigned, what can a difference between the groups actually tell you? You will see that a raw difference is an association, that adjustment for measured confounders can move that association closer to a causal reading, and that the move is only as good as the assumption that you measured the right things. The recurring tutoring-center study makes this concrete: a naive gap of \(+8.0\) points shrinks to an adjusted \(+3.0\) once you account for prior ability — and that \(+3.0\) is not automatically a causal effect.
Why this matters
Most evidence you will ever read is observational. Nobody randomized who smokes, who takes a supplement, who uses the campus tutoring center, or who enrolls in an honors track. In each case the people who did the thing differ from the people who did not before the thing ever happened, so a simple comparison mixes the effect of the treatment with the effect of those pre-existing differences. The whole craft of observational evidence is learning to separate the two — and being honest when you cannot. This week trains the reflex the course returns to constantly: name what was assigned (here, nothing), name what was only observed, and then choose your verb. “Causes” is a strong word; “is associated with” is the honest default until a design or a stated assumption earns the upgrade.
Learning goals
By the end of this week you should be able to:
- Explain why the absence of random assignment means the comparison groups can differ at baseline, and why that difference threatens any causal reading.
- Distinguish association from causation in words and in the verb you choose, and state which one an observational difference supports.
- Adjust a naive difference for a measured confounder by stratification (and recognize the regression version), and read the adjusted number as an estimate under a stated assumption.
- Separate the estimand (the causal effect you want) from the estimate (the number you got), and say why they are not the same object.
- State the measured-confounder assumption that an adjusted observational estimate rests on, and explain why adjustment cannot fix an unmeasured confounder.
- Spot a post-treatment variable and explain why adjusting for it is a bad control that biases, rather than fixes, the estimate.
Core vocabulary
- Observational study — a study in which the treatment or exposure is not assigned by the researcher; units select into groups (or are sorted by nature), so the groups can differ at baseline.
- Association — a statistical relationship between two variables (the groups differ on the outcome). It does not, by itself, say one causes the other.
- Confounder — a pre-treatment common cause of both the exposure \(Z\) and the outcome \(Y\). It opens a backdoor path that contaminates the naive comparison. Here, prior ability causes both using the center and the score.
- Adjustment / stratification — comparing treated and untreated units within levels of a confounder (strata), then combining, so the confounder is held roughly constant. Regression adjustment does the same thing with a model.
- Estimand — the causal quantity you want, e.g. the average treatment effect \(\text{ATE} = E[Y(1) - Y(0)]\). Estimate — the one realized number \(\hat d\) you compute from data. The estimand is the target; the estimate is the arrow that may or may not hit it.
- Measured-confounder assumption (no unmeasured confounding) — the claim that the confounders you adjusted for are all of the ones that matter. Adjustment is only as trustworthy as this claim.
- Bad control — adjusting for a post-treatment variable (a mediator on the causal path, or a collider). It introduces bias rather than removing it; never adjust for a consequence of the treatment.
Concept development
No random assignment means the groups differ at baseline
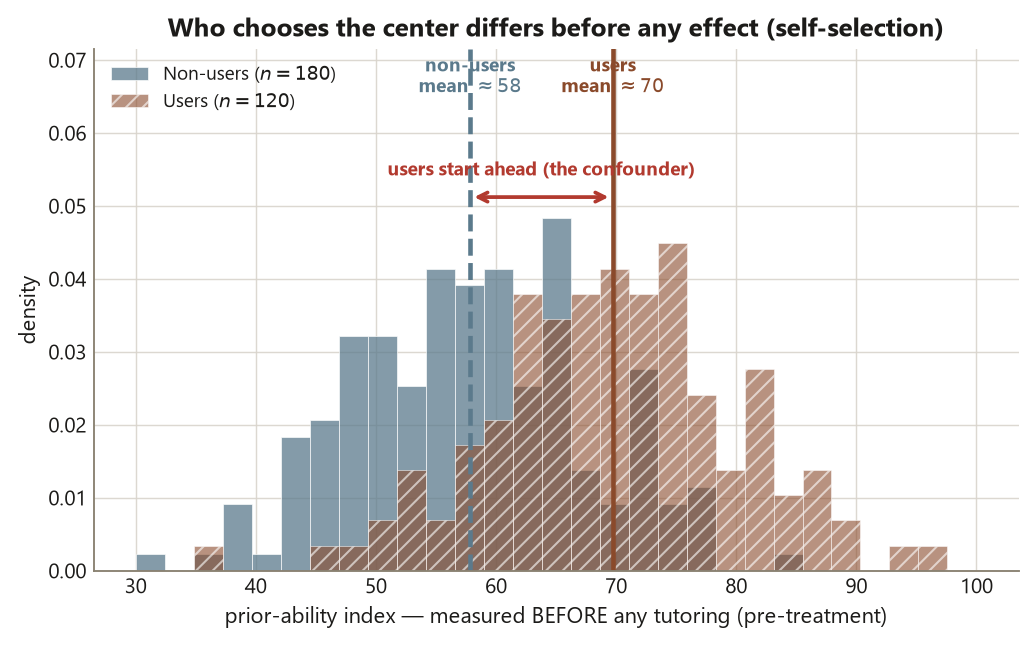
In an experiment, random assignment makes the treatment and control groups statistically equivalent on everything — measured and unmeasured — before treatment, so any later difference can be read as caused by the treatment. An observational study has no such mechanism. The unit of analysis here is the individual student, and students chose whether to use the tutoring center. That choice is not a coin flip: more motivated, higher-prior-ability students are both more likely to seek out the center and more likely to score well anyway. So the two groups start unequal. The exposure \(Z\) (used the center / did not) is tangled with a pre-treatment covariate \(X\) (prior ability) that also drives the outcome \(Y\) (end-of-term score). When \(X\) causes both \(Z\) and \(Y\), it is a confounder, and the naive difference in \(Y\) between the two values of \(Z\) absorbs the effect of \(X\) on top of any real effect of \(Z\).
This is why the course reserves causal verbs for randomized assignment or for an explicitly adjusted claim with named assumptions. With no assignment and no adjustment, the only honest statement is that center use is associated with higher scores — full stop.
Adjustment by stratification estimates the within-confounder difference
If you can measure the confounder, you can try to neutralize it. Stratification splits the sample into prior-ability tiers (low / medium / high), computes the user-vs-nonuser difference inside each tier — where prior ability is roughly constant — and then averages those within-tier differences with appropriate weights. Because you are comparing students of similar prior ability, the comparison no longer rewards the user group for simply having started ahead. The combined within-tier difference is the adjusted estimate. Regression adjustment does the same job by including prior ability as a covariate in a model of the outcome; the stratified picture is the arithmetic that the regression coefficient summarizes. The key discipline: you adjust only for pre-treatment variables, because a pre-treatment variable can be a confounder but cannot be a consequence of the treatment.
Estimand versus estimate, and what adjustment can and cannot buy
Keep two objects distinct. The estimand is the causal effect you wish you knew — the average treatment effect of using the center, \(\text{ATE} = E[Y(1) - Y(0)]\), the contrast between each student’s score if they used the center and their score if they did not. The estimate is the single number your data produce. In an experiment, randomization lets the estimate target the estimand directly. In an observational study, the adjusted estimate targets the estimand only if the measured-confounder assumption holds — only if prior ability was the relevant confounder and you measured it well. If an unmeasured confounder remains (say, baseline motivation that prior ability does not fully capture), the adjusted number is still biased, and no amount of clean arithmetic rescues it. Adjustment closes the backdoors you can see; it is silent about the ones you cannot. That is the central humility of observational evidence, and the reason this week’s tidy \(+3.0\) is reported with an explicit “if.”
Worked examples
Worked example — the tutoring-center study (recurring slice)
Study O is the course’s observational spine: students who chose to use the tutoring center versus those who did not, compared on an end-of-term performance score. The data are synthetic; seed set (set.seed(45403)); they are not real student records. The unit of analysis is the individual student. Nothing was assigned — students self-selected — so we are reading an association unless and until adjustment plus an assumption earns more.
The naive comparison uses \(n = 120\) users and \(n = 180\) non-users (300 total):
\[ \hat d_{\text{naive}} = \bar y_{\text{users}} - \bar y_{\text{non-users}} = 82.0 - 74.0 = +8.0 \text{ points.} \]
Read literally and honestly, this says center users scored 8.0 points higher on average; it does not say the center added 8.0 points, because the users were a self-selected, higher-prior-ability group to begin with. Prior ability is a pre-treatment common cause of both using the center and the score — a confounder opening a backdoor path.
Now stratify on the prior-ability tier and recombine. Holding prior ability roughly constant, the within-tier user-vs-nonuser difference shrinks to the adjusted estimate:
\[ \hat d_{\text{adjusted}} = +3.0 \text{ points,} \]
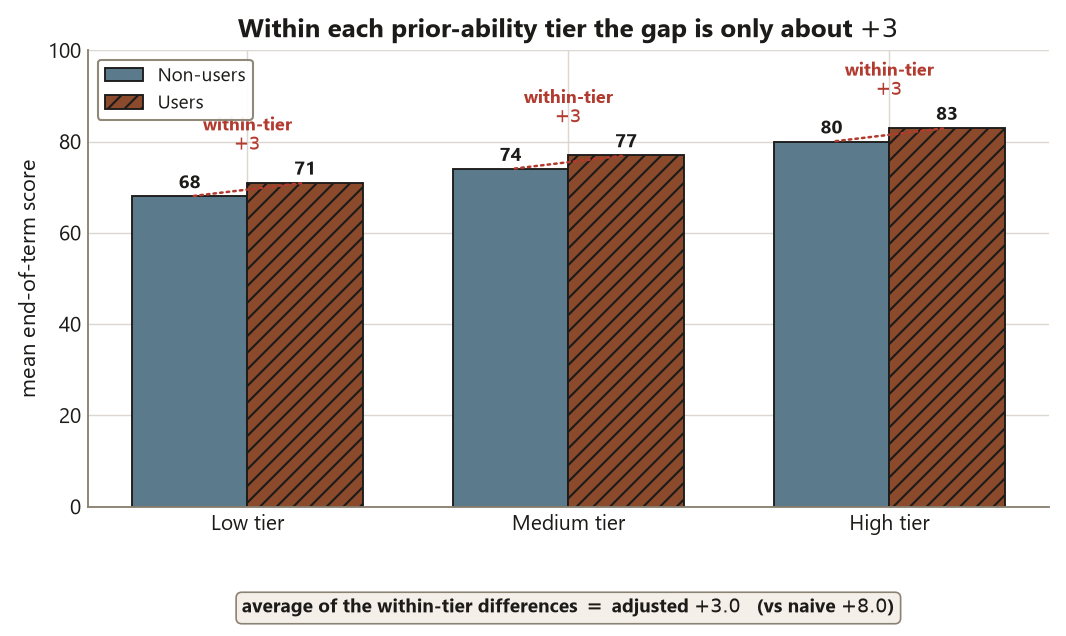
so confounding had inflated the naive gap by \(+8.0 - (+3.0) = +5.0\) points. The honest claim upgrades from “associated with \(+8.0\)” to “associated with about \(+3.0\) after adjusting for prior ability — which approximates a causal effect if prior ability is the relevant confounder and is measured correctly.”
Here is the static computation. It is shown as teaching code, not executed in this diagnostic.
set.seed(45403)

# Study O — tutoring-center observational study (synthetic; NOT real data).
# Unit of analysis = student. Treatment was NOT assigned; students self-selected.

n_users    <- 120
n_nonusers <- 180

# Naive group means (end-of-term performance score)
mean_users    <- 82.0
mean_nonusers <- 74.0

d_naive <- mean_users - mean_nonusers     # +8.0  <- ASSOCIATION, not a causal effect

# Stratify on the pre-treatment prior-ability tier (low / medium / high),
# take the user-vs-nonuser difference WITHIN each tier, then recombine.
# (Tier-level cells omitted; the recombined within-tier contrast is shown.)
d_adjusted <- 3.0                          # +3.0  <- adjusted for a MEASURED confounder

confounding_inflation <- d_naive - d_adjusted   # +5.0 of the naive gap was confounding

# d_naive          = 8.0   association (groups differ at baseline)
# d_adjusted       = 3.0   estimate of the causal effect IF prior ability is the
#                          relevant, well-measured confounder (the measured-confounder assumption)
# inflation        = 5.0   how much the backdoor path overstated the effect

# BAD CONTROL warning: do NOT add "hours studied during the term" to the adjustment.
# It is POST-treatment (a consequence of using the center) -> adjusting for it biases d_adjusted.
Interpretation, naming the design move. What was sampled: a set of students (the population claim is a separate matter). What was assigned: nothing — the exposure is self-selected. The confounder is prior ability, a pre-treatment common cause. The claim: center use is associated with about \(+3.0\) points after adjusting for prior ability; it is a defensible approximate causal effect only under the measured-confounder assumption, and it is not a verified causal effect, because an unmeasured confounder could still be at work.
The teaching parallel (state it as a lesson, not a coincidence). The adjusted observational estimate \(+3.0\) deliberately matches the Focus experiment’s randomized effect \(d = 3.0\) from Study E. The lesson: a well-designed experiment recovers what careful adjustment can only approximate — and the approximation is trustworthy only when the confounder is measured and correct. The experiment earned its \(3.0\) by randomization; the observational study earns its \(3.0\) only by an assumption you must defend in words. They land on the same number, but they do not carry the same warrant.
Worked example — vitamin users versus non-users (transfer to a new context)
Transfer the same reasoning to a health setting. A clinic compares adults who choose to take a daily multivitamin against those who do not, on a yearly wellness score. The numbers below are illustrative (a new context, distinct from the locked study), but the design logic is identical. Suppose vitamin users average \(70\) and non-users average \(61\), a naive difference of \(+9\). Once again, nothing was assigned: people who take vitamins also tend to exercise more, eat better, and see doctors more — they were healthier at baseline. Baseline health is a pre-treatment confounder.
set.seed(45403)

# Transfer example (illustrative numbers, new context): vitamin users vs non-users.
# Unit = adult. Treatment NOT assigned; vitamin use is self-selected.

mean_vit_users    <- 70
mean_vit_nonusers <- 61
d_naive_vit <- mean_vit_users - mean_vit_nonusers   # +9  ASSOCIATION

# Adjust (stratify / regress) on BASELINE health, a pre-treatment confounder:
d_adjusted_vit <- 4                                  # illustrative adjusted estimate

# Reading: "vitamin use is associated with about +4 after adjusting for baseline
# health" -- approximates a causal effect ONLY if baseline health is the relevant,
# well-measured confounder. Adjusting for a POST-treatment outcome (e.g. this year's
# doctor visits caused by feeling unwell) would be a BAD CONTROL.
Interpretation, naming the design move. What was assigned: nothing — vitamin use is a choice. The confounder is baseline health, measured before the comparison year. The naive \(+9\) is an association inflated by healthier people self-selecting into vitamin use; the adjusted \(+4\) approximates a causal effect only under the measured-confounder assumption. If unmeasured lifestyle differences remain, even \(+4\) overstates the vitamin’s effect. The verb stays “associated with” unless you are willing to defend the assumption out loud.
A common mistake
The week’s signature design trap braids four risks the ledger flags for this page.
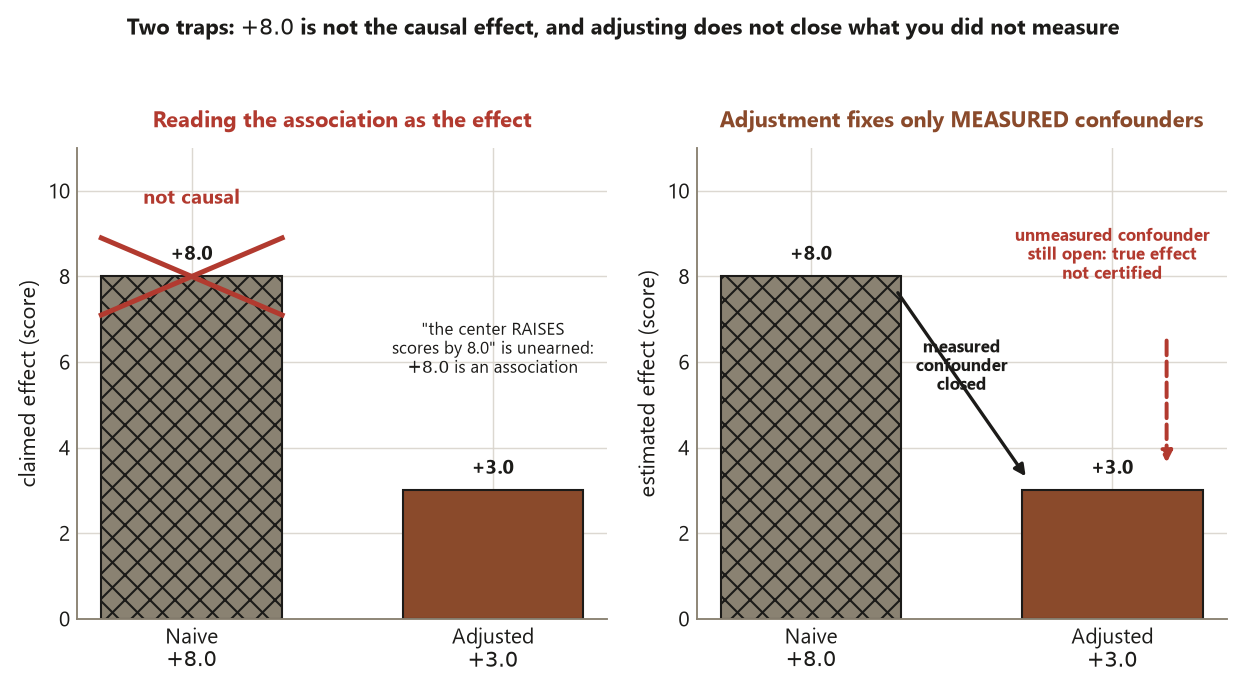
Reading association as causation (Risk 2). The most common error is to announce that “the tutoring center raises scores by 8 points.” With no assignment, that sentence is unearned: the \(+8.0\) is an association between self-selected groups, and the verb “raises” smuggles in a causal claim the design cannot support.
Treating a small p-value as a strong design (Risk 5). Suppose the naive \(+8.0\) comes with a tiny p-value. A small p-value only says the difference is unlikely to be pure sampling noise; it says nothing about confounding. Significance cannot rescue a confounded design — a confidently estimated biased number is still biased. The claim must rest on the design and the adjustment assumption, never on the p-value.
Confounder versus a covariate you do not need (Risk 7). Adjust to close a real backdoor, not reflexively. Prior ability earns adjustment because it causes both the exposure and the outcome. A variable that is unrelated to the exposure, or unrelated to the outcome, need not be in the adjustment set; padding the model with every available variable is not virtue and can do harm.
Adjusting for a post-treatment variable (Risk 4 — the worst version). The tempting move is to “control for hours studied during the term.” But hours studied is a consequence of using the center — it is post-treatment, plausibly a mediator on the very causal path you care about. Adjusting for it removes part of the effect you are trying to measure (or, if it is a collider, opens a spurious path), biasing the estimate. The rule is firm: adjust only for pre-treatment confounders; never adjust for a consequence of the treatment.
Low-stakes self-checks (ungraded)
These are ungraded self-checks — practice only, no points, no submission.
- In the tutoring-center study, which number is the association and which is the adjustment-under-an-assumption: \(+8.0\) or \(+3.0\)? Say in one sentence what each one licenses you to claim.
- The naive gap was inflated by \(+5.0\) points. In plain words, where did those 5 points come from, and what design feature would have prevented them?
- A classmate proposes adjusting the tutoring estimate for “number of office-hours visits this term.” Is that variable pre-treatment or post-treatment, and is adjusting for it a good control or a bad control? Why?
- Distinguish the estimand from the estimate for this study in one sentence each. Which one does randomization let you target directly, and which one needs an assumption?
- The adjusted \(+3.0\) matches the experiment’s \(d = 3.0\). Does that matching prove the observational claim is causal? State the assumption the two numbers rely on differently.
Reading and source pointer
This week is grounded in the instructor notes (primary) and in IMS (Çetinkaya-Rundel & Hardin) on observational studies and confounding — its treatment of association versus causation and of comparison groups that differ at baseline sets the sequence and vocabulary used here. As an optional advanced pointer only, Causal Inference: What If (Hernán & Robins) calibrates the level of the measured-confounder / adjustment material and is linked, not reproduced: https://www.hsph.harvard.edu/miguel-hernan/causal-inference-book/. These notes are the course’s own synthesis, grounded in but not copied from the sources. No prose, examples, figures, or exercises from any source are reproduced.
Public vs. graded
These notes, the examples, and the practice here are public and ungraded — study material only. No graded prompts, answer keys, rubrics, point values, or due dates appear on this site. Graded design checkpoints, weekly quizzes, design memos and homework, applied design labs, the midterm, the final design project, and the final exam live in Blackboard (the LMS), which is authoritative for due dates, submissions, and grades. If this page and Blackboard ever disagree, follow Blackboard.
Looking ahead
Next week we draw the picture behind this week’s arithmetic. Week 10 — causal diagrams and backdoor reasoning turns the tutoring-center confounder into a causal diagram (a DAG): prior ability \(\to\) use, prior ability \(\to\) outcome (the backdoor), and use \(\to\) outcome (the path of interest). You will learn to read which variables form an adjustment set that blocks the backdoor, and to see why “hours studied” is a bad control. The companion lab, confounding and adjustment by simulation, will let you watch a naive \(+8.0\) collapse to \(+3.0\) as you condition on the confounder.
See also
- Week 8 — interactions in designed studies — the last experimental-spine week, where reading the cells matters.
- Week 10 — causal diagrams and backdoor reasoning — the diagram behind this week’s adjustment.
- Design glossary — confounder, mediator, collider, estimand vs estimate, bad control.
- Design reference — the design families side by side, including observational adjustment.
- Causal-diagram guide — how to draw and read the backdoor path you adjust to close.