Week 13 — Missing data and nonresponse
Unit nonresponse, item missingness, attrition, and sensitivity
The week question
For two weeks you have been treating the study-habits survey as if the data you have are the data you wanted. They are not. You invited \(600\) students and only \(360\) answered; some of those \(360\) skipped a question or two; and over in the Focus experiment, a handful of students never came back for the post-test. Every one of those gaps is a place where the rows you analyze stop matching the units the design selected. The week question is therefore: when some of the data you designed for never arrive, what can you still conclude — and how do you keep a missing-data gap from quietly turning a population claim into a wish?
This is a design-of-evidence question, not a software question. The fix is never “the software dropped the missing rows, so we are fine.” The fix is to name which kind of missingness you have, reason about why it went missing, and — when the honest answer is “we cannot know” — report a bound instead of pretending a single number is safe.
Why this matters
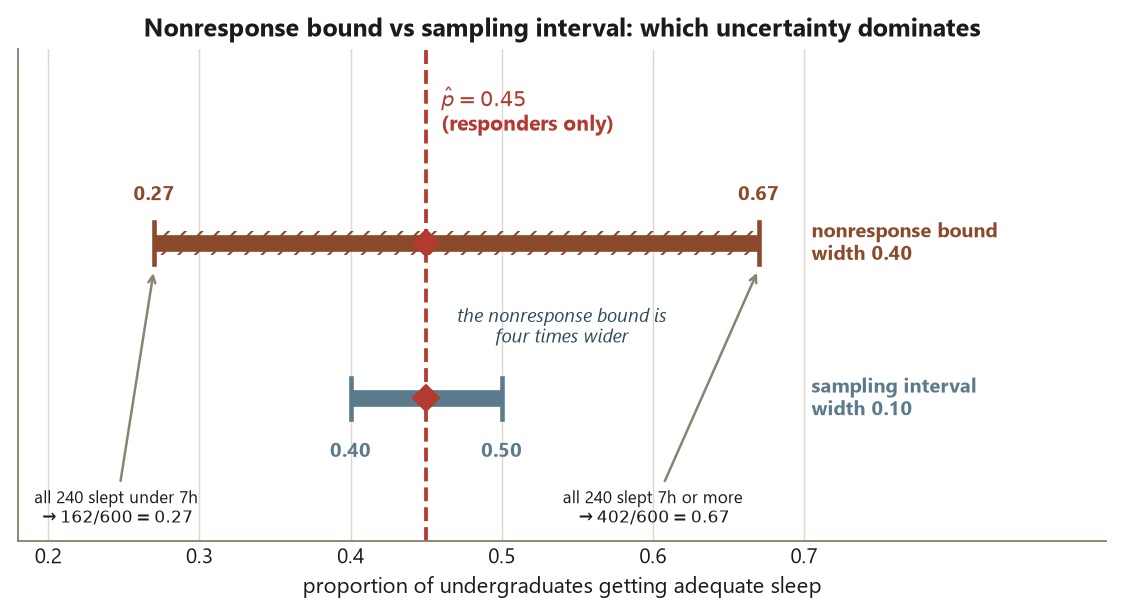
Nonresponse is the threat that sample size cannot buy your way out of. Week 11 already showed it: the SRS sampling interval for the sleep proportion is roughly \((0.40, 0.50)\), but the nonresponse uncertainty — what the \(240\) silent students might have said — stretches the honest range to \([0.27, 0.67]\). That bound dwarfs the interval. Collecting a bigger sample with the same response behavior would shrink the interval and leave the bound essentially untouched. So the size of your \(n\) is the wrong thing to optimize when nonresponse is in play; the mechanism behind the missingness is the thing that decides whether your estimate is even pointed at the right answer.
It matters because the failure is silent in exactly the way bad controls were silent last month. R’s default behavior is to quietly drop incomplete rows (na.rm, listwise deletion), hand you a clean-looking number, and say nothing about the units it discarded. That number is an estimate for the population of responders, which is not the population your design was built to describe. Nothing errors. The estimate just answers a question you did not ask.
The discipline this week is the same one that runs through the whole course: a design earns a claim, and missing data can revoke it. Random sampling earns a population claim — but only if the people who were sampled actually respond, or the ones who do not are missing for reasons unrelated to the answer. The moment that fails, you no longer have a population claim; you have a claim about whoever felt like replying, and the sensitivity bound is how you tell the difference honestly.
Learning goals
By the end of this week you should be able to:
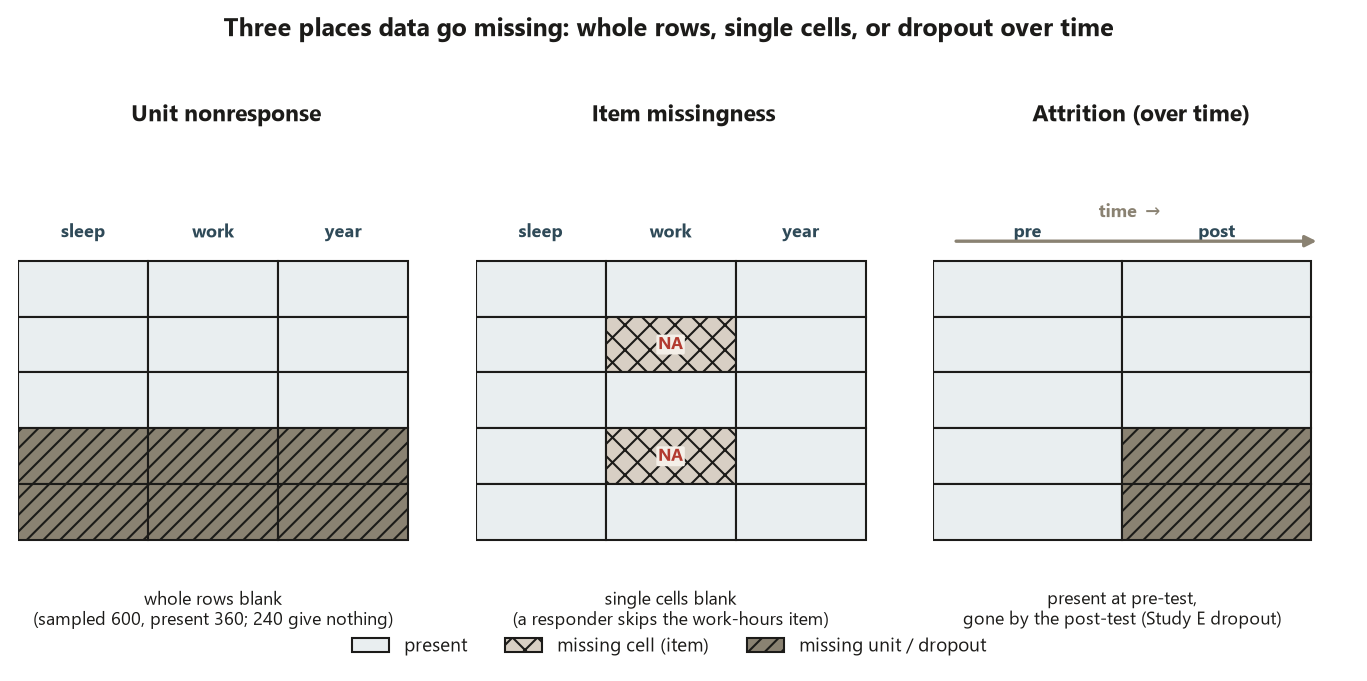
- distinguish the three places data go missing — unit nonresponse (a sampled unit gives nothing), item missingness (a responding unit skips a question), and attrition (a unit leaves before the outcome is measured) — and say which design each threatens;
- classify a missingness mechanism as MCAR (missing completely at random), MAR (missing at random given observed variables), or MNAR (missing not at random), and explain why MNAR is the dangerous case no analysis can repair from the data alone;
- run a worst-case sensitivity analysis that bounds a conclusion by filling the missing values with their most-favorable and least-favorable plausible values, and read the resulting bound against the sampling interval;
- reproduce and interpret the survey’s locked nonresponse bound \([0.27, 0.67]\) and say in words why it is wider than the \((0.40, 0.50)\) sampling interval;
- recognize and refuse the classic error of ignoring nonresponse or assuming MCAR by default (Risk 11), and report a bound rather than a single point estimate when MNAR is plausible.
Core vocabulary
- Unit nonresponse — a unit that was sampled or assigned contributes no data at all (one of the \(240\) invited students who never answered the survey).
- Item missingness — a unit that did respond leaves some fields blank (a respondent answers the sleep question but skips the work-hours question).
- Attrition (dropout) — a unit that started the study leaves before the outcome is measured (a Focus participant who took the pre-test but never the post-test). It is unit nonresponse arriving over time.
- MCAR — missing completely at random — the chance of being missing does not depend on anything, observed or unobserved. Missingness is like a coin flip independent of the data; the responders are a random subsample and an analysis of complete cases is unbiased (just smaller).
- MAR — missing at random — the chance of being missing depends only on observed variables. Within levels of what you measured, missingness is random; you can adjust or weight using the observed variables to remove the bias.
- MNAR — missing not at random — the chance of being missing depends on the unobserved value itself (students who sleep least are likeliest to ignore a sleep survey). No reweighting from observed data can fix it, because the very thing that drives missingness is the thing you did not get to see.
- Complete-case (listwise) analysis — analyzing only the rows with no missing fields. Unbiased under MCAR, generally biased otherwise, and the silent default in most software.
- Sensitivity analysis — recomputing the conclusion under a range of plausible assumptions about the missing values, especially the worst case, to report a bound instead of a single fragile number.
- Nonresponse bias — the gap between the responders’ answer and the answer the full sampled set would have given; large exactly when missingness is related to the outcome (MNAR).
Concept development
Three places data go missing — and which design each threatens
Missingness is not one phenomenon; it enters a study through three different doors, and the door it comes through tells you which design promise is at risk.
Unit nonresponse is a hole at the level of the whole unit. In the study-habits survey, \(600\) undergraduates were invited by simple random sample and \(360\) responded — a \(60\%\) response rate, leaving \(240\) units that contribute nothing. Random sampling was supposed to earn a population claim about all undergraduates; unit nonresponse threatens that claim directly, because the population you can actually describe has shrunk to “those who respond.” What was sampled is \(600\); what you have is \(360\); the design’s promise was about the first number.
Item missingness is a hole inside an otherwise-present unit. A respondent answers the sleep-hours question but leaves the work-hours question blank. The unit is in your data, so it still counts toward the response rate, but any analysis that uses the work-hours field silently loses those rows. Item missingness threatens the part of the analysis that touches the missing item, not the whole survey — which is why it is easy to overlook until a two-variable summary quietly runs on fewer cases than you think.
Attrition is unit nonresponse that unfolds over time, and it is the form that strikes experiments. In the Focus study, students took a pre-test, were randomly assigned, and were measured again at a post-test; anyone lost between assignment and the post-test has attrited. This is the dangerous one for a causal claim, because random assignment balanced the groups at the start — but if dropout differs between the treatment and control arms, the survivors are no longer balanced, and the very thing random assignment bought you can leak away after the coin was flipped. Attrition threatens internal validity, where nonresponse in a survey threatens external/population validity.
The design move is to name the door before you analyze: what was sampled or assigned, and what is actually present? The difference between those two counts is your missingness, and its location decides which claim is on the line.
MCAR, MAR, MNAR — and why MNAR is the one that hurts
Whether missing data biases your conclusion depends entirely on why the data are missing. The standard ladder has three rungs, and they are not equally forgiving.
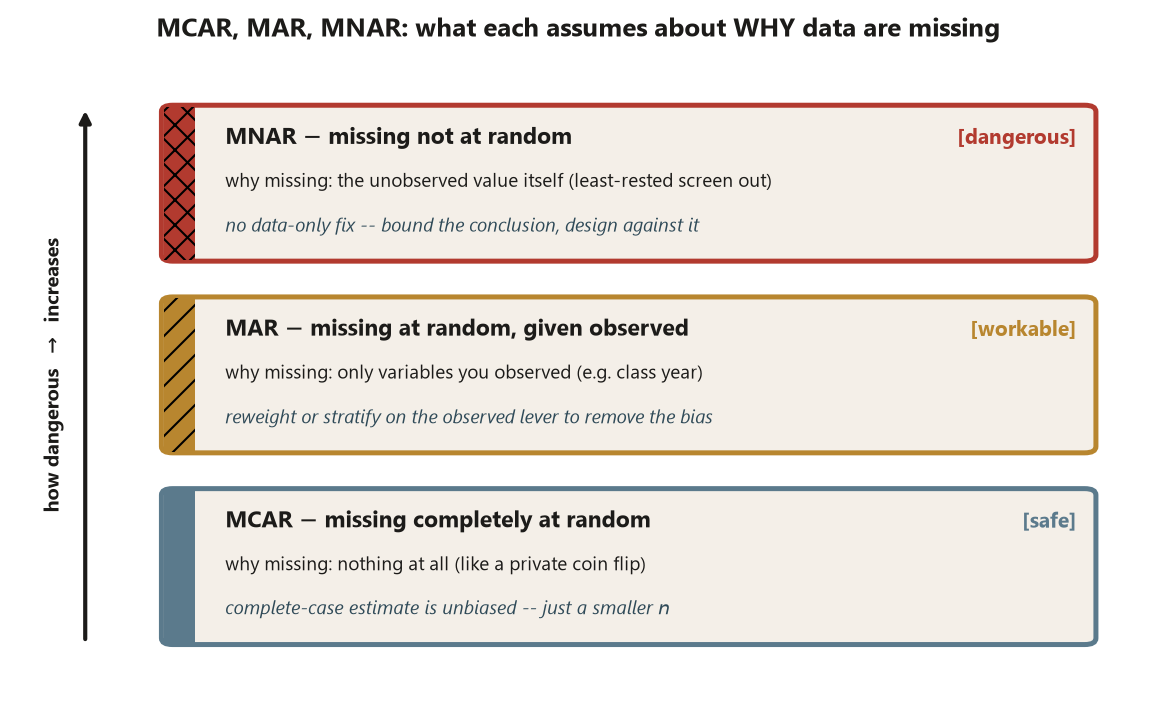
MCAR — missing completely at random. Missingness is independent of everything, observed and unobserved. Imagine each invited student flips a private coin and only answers on heads, with no connection to their sleep, their workload, or anything else. Then the \(360\) responders are a genuine random subsample of the \(600\), the complete-case estimate \(\hat p = 0.45\) is unbiased, and you have simply paid for it with a smaller \(n\) and a slightly wider interval. MCAR is the comfortable assumption — and it is almost never demonstrably true, which is the whole problem.
MAR — missing at random. Missingness depends only on variables you observed. Suppose seniors answer at a lower rate than first-years, but within each class year responding is unrelated to how much anyone sleeps. Then missingness is “random given class year,” and you can repair the bias by weighting or stratifying on class year — the observed variable that drives the gap. MAR is workable precisely because the lever is something you have in hand. (This is why the stratified design of Week 12, which records class year, also helps you reason about nonresponse.)
MNAR — missing not at random. Missingness depends on the unobserved value itself. The students who sleep the least are the busiest, and the busiest are the likeliest to delete a sleep survey unread. Now the reason a value is missing is the value you wanted, and no amount of reweighting on observed variables can recover it, because the relevant variable was never observed. MNAR is the dangerous case: the data cannot tell you that you are in it, and it cannot tell you how to get out. The only honest responses to plausible MNAR are to bound the conclusion (next section) and to design against nonresponse in the first place.
The three rungs are a claim about the world, not a fact you can read off the dataset, so you reason about the mechanism from how the data were generated — and when MNAR is plausible, you do not get to assume it away (Risk 11).
Sensitivity analysis — bounding a conclusion you cannot point-estimate
When MNAR is on the table, you cannot produce a single trustworthy estimate, but you can produce something more honest: a range that the truth must lie within for any pattern of missingness, by filling the missing values with their most- and least-favorable plausible extremes.
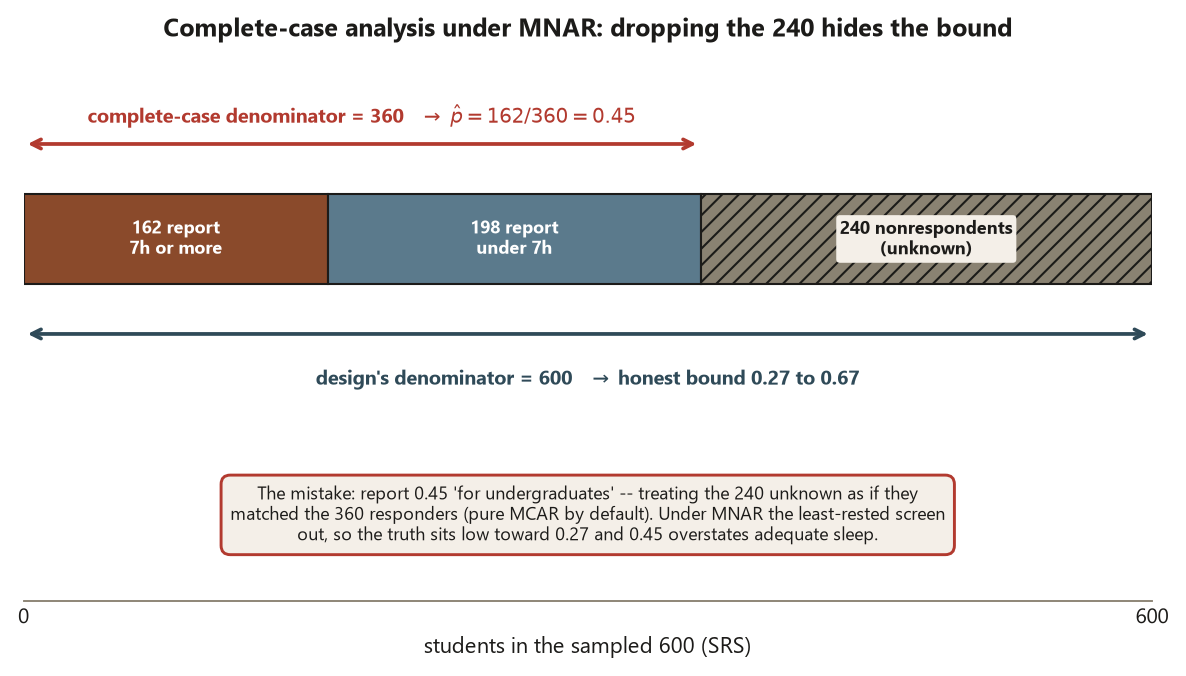
For the survey this is exact and arithmetical. Among the \(360\) responders, \(162\) reported \(\ge 7\) hours of sleep, giving \(\hat p = 162/360 = 0.45\). The \(240\) nonrespondents are unknown. The best case for a low estimate is that all \(240\) slept under seven hours, none added to the numerator, so the proportion across the full \(600\) is \(162/600 = 0.27\). The worst case is that all \(240\) slept seven hours or more, so the proportion is \((162 + 240)/600 = 402/600 = 0.67\). Without an assumption about the mechanism, the population proportion among the sampled \(600\) could be anywhere in
\[ \left[\frac{162}{600},\ \frac{162 + 240}{600}\right] = [0.27,\ 0.67]. \]
That interval is the nonresponse bound, and its width — \(0.40\) — should stop you cold. The sampling interval from Week 11, \((0.40, 0.50)\), has width \(0.10\); the nonresponse bound is four times wider. The lesson is blunt: with a \(40\%\) nonresponse rate, nonresponse, not sample size, is the threat. The bound is wide because it makes no MCAR assumption at all; if you can defend a milder assumption (say, nonrespondents behave like the observed group within class year — MAR), you can report a narrower, assumption-laden interval inside this bound, but you must state the assumption out loud. The worst-case bound is the claim you can make with no assumptions; everything tighter is a claim you are buying with an assumption you should be willing to defend.
Worked examples
Worked example — the survey’s 240 nonrespondents and the locked bound (recurring study)
Study S is the campus study-habits survey: a simple random sample of \(600\) undergraduates drawn to estimate the population proportion who get adequate sleep (\(\ge 7\) hours). Random sampling is the mechanism, so the target is a population claim. The locked, synthetic counts are fixed: \(600\) invited, \(360\) respond (\(60\%\)), \(240\) nonrespondents; among responders \(162/360 = 0.45\) report adequate sleep, with sampling \(\operatorname{SE} \approx 0.026\) and a \(95\%\) interval of about \((0.40, 0.50)\).
The design question is not “is \(0.45\) significantly different from one-half.” It is “does \(0.45\) describe the population, or only the responders?” To answer it without assuming the mechanism, bound the conclusion.
# Study S — worst-case nonresponse bound on the adequate-sleep proportion.
# Synthetic; seed set. Static, non-executed code (shown as teaching).
set.seed(45403)

invited     <- 600     # SRS sample size (what the design selected)
responders  <- 360     # 60% response rate
nonresp     <- invited - responders   # 240 unit nonrespondents

yes_obs     <- 162     # responders reporting >= 7 hours of sleep
p_hat       <- yes_obs / responders   # 162/360 = 0.45  (responders-only estimate)

# Sampling SE and 95% interval (uncertainty IF the responders were the population).
se_srs <- sqrt(p_hat * (1 - p_hat) / responders)   # ~ 0.026
ci_srs <- p_hat + c(-1, 1) * 1.96 * se_srs          # ~ (0.40, 0.50)

# Worst-case sensitivity bound: fill the 240 unknowns with the two extremes.
low_bound  <- yes_obs / invited                      # all 240 slept <7h  -> 162/600 = 0.27
high_bound <- (yes_obs + nonresp) / invited          # all 240 slept >=7h -> 402/600 = 0.67
nr_bound   <- c(low_bound, high_bound)               # [0.27, 0.67]

width_ci   <- diff(ci_srs)    # ~ 0.10  (sampling interval)
width_nr   <- diff(nr_bound)  # ~ 0.40  (nonresponse bound) -- four times wider
Interpretation. The responders-only estimate is \(\hat p = 0.45\) with a sampling interval of about \((0.40, 0.50)\) — but that interval assumes the \(360\) responders are the population, which is exactly the assumption nonresponse calls into question. The worst-case bound \([0.27, 0.67]\) is what you can say with no assumption about why the \(240\) stayed silent: the population proportion among the sampled \(600\) could be as low as \(0.27\) or as high as \(0.67\). The design reading is that the survey sampled \(600\) but only observed \(360\), and the gap between those numbers — not the size of the sample — is what limits the population claim. If the nonrespondents are MNAR (the busiest, least-rested students screen out the survey), the truth sits toward the low end and \(0.45\) overstates adequate sleep; the bound is the honest object, and the point estimate is a claim about responders only. You may report a narrower number only by naming and defending a mechanism (MCAR gives back \(0.45\); MAR on class year gives a weighted estimate inside the bound).
A second, item-level slice lives in the same survey: some responders answer the sleep question but skip the work-hours item. A cross-tabulation of sleep against work hours silently runs on only the responders who filled both fields. If the students who skip the work-hours question are systematically the ones working the most (plausibly MNAR for that item), the work–sleep relationship you estimate is distorted in a direction the complete-case output will never flag — so name the item missingness before you read that two-way table.
Worked example — attrition in the Focus experiment and a drug-trial dropout (recurring slice + transfer)
Recurring slice — attrition in Study E. The Focus study randomly assigned \(60\) students, \(30\) to the workshop and \(30\) to control, and measured a gain score at a post-test; random assignment earns a causal claim. Suppose a few students in each arm never return for the post-test — they attrite. Random assignment balanced the arms at the moment of the coin flip, so if dropout is MCAR (someone moves away for reasons unrelated to the workshop or their gain), the survivors are still balanced and the effect estimate stays roughly unbiased — you have simply lost precision. But if dropout is MNAR — say the workshop students who were struggling most quietly stop attending and skip the post-test — then the treatment arm’s survivors are the students who were doing relatively well, the arms are no longer comparable, and the gain estimate is biased upward by the dropout pattern. The design move random assignment bought you can leak out the back after the coin is flipped; attrition is the leak, and it threatens internal validity, not just generalization. The remedy is the same shape as the survey’s: bound the effect by imagining the missing post-tests at their plausible extremes, and report the range rather than a single survivor-only number.
Transfer — a drug trial where sicker patients drop out. Now move to a clinical context; these numbers are illustrative and clearly distinct from the locked study. A trial randomizes \(200\) patients, \(100\) to a new drug and \(100\) to placebo, and the outcome is a symptom-improvement score at twelve weeks. By week twelve, \(70\) drug patients and \(90\) placebo patients remain, so attrition is differential — heavier in the drug arm. Suppose the sickest patients are the ones who drop out, and they drop out more on the drug because of side effects. That is MNAR: missingness depends on the unobserved would-be outcome (how poorly they were doing).
# Transfer: differential attrition in a drug trial (illustrative, NOT the locked study).
# Synthetic; seed set. Static, non-executed code (shown as teaching).
set.seed(45403)

n_arm        <- 100                      # randomized per arm
remain_drug  <- 70;  remain_pbo  <- 90   # differential dropout (heavier on the drug)

# Survivor-only ("complete case") means among those who stayed:
mean_drug_obs <- 6.0    # drug survivors look great -- the sick ones left
mean_pbo_obs  <- 4.0    # placebo survivors
naive_effect  <- mean_drug_obs - mean_pbo_obs   # +2.0 survivor-only difference

# Worst-case bound: impute the 30 drug + 10 placebo missing outcomes at plausible
# extremes (here, the symptom score ranges 0..10). Best/worst for the drug effect:
best_drug  <- (mean_drug_obs*remain_drug + 10*(n_arm - remain_drug)) / n_arm  # drug missing = 10 -> 7.2
worst_drug <- (mean_drug_obs*remain_drug +  0*(n_arm - remain_drug)) / n_arm  # drug missing =  0 -> 4.2
best_pbo   <- (mean_pbo_obs*remain_pbo  +  0*(n_arm - remain_pbo )) / n_arm   # placebo missing = 0 -> 3.6
worst_pbo  <- (mean_pbo_obs*remain_pbo  + 10*(n_arm - remain_pbo )) / n_arm   # placebo missing = 10 -> 4.6

effect_high <- best_drug  - best_pbo    # most drug-favorable filling   -> +3.6
effect_low  <- worst_drug - worst_pbo   # least drug-favorable filling  -> -0.4
effect_bound <- c(effect_low, effect_high)   # the sensitivity bound [-0.4, 3.6] -- straddles zero
Interpretation. The survivor-only difference is \(+2.0\) points in the drug’s favor — but it is computed on the patients who stayed, and the drug arm lost more of its sickest patients, so the survivors flatter the drug. Because dropout depends on the unobserved outcome (sicker patients leave, and leave the drug more), this is MNAR, and no reweighting on baseline covariates can be trusted to fix it. The sensitivity bound — filling the \(30\) drug and \(10\) placebo missing outcomes at the score range’s extremes — comes out to \([-0.4, 3.6]\): wide, and it straddles zero, which is the honest message. The data are consistent with the drug helping, doing nothing, or (if the dropouts would have done badly) the naive \(+2.0\) being mostly a dropout artifact. The design reading is that random assignment licensed a causal claim at randomization, but differential MNAR attrition revoked it; the claim the trial actually supports is “the effect lies somewhere in this bound,” not “the drug improves symptoms by \(2.0\) points” (Risk 11).
A common mistake
The signature mistake this week is ignoring nonresponse — treating the data you have as the data you wanted — which is the same thing as silently assuming MCAR. It wears two disguises. The first is the bare point estimate: reporting \(\hat p = 0.45\) “for undergraduates” as though the \(240\) silent students simply do not exist. That number describes responders, and presenting it as a population figure assumes, with no evidence, that responders and nonrespondents are interchangeable — pure MCAR by default. The second disguise is letting the software do it for you: na.rm = TRUE, listwise deletion, a complete-case lm() — each quietly drops the incomplete rows and hands back a clean number computed on a self-selected subsample, with no warning that the denominator changed.
The fix is a two-step discipline you can run every time. First, classify the mechanism from how the data were generated: is missingness plausibly MCAR, MAR on something you measured, or MNAR on the value itself? You argue this from the design and the substance, because the dataset cannot reveal it. Second, when MCAR is not defensible, report a bound, not a point. Compute the worst-case sensitivity range — \([0.27, 0.67]\) for the survey — and let its width speak. If you then want a tighter number, you must name the assumption (MAR on class year, say) that buys it, out loud, where a reader can challenge it. A point estimate with no mechanism stated, and no bound when MNAR is live, is the error (Risk 11). The reviewer’s check is exactly this: was the mechanism classified rather than assumed, and was a sensitivity bound reported rather than a lone point estimate when MNAR was plausible?
Low-stakes self-checks (ungraded)
These are for your own practice — ungraded, no submission.
- Sort each into unit nonresponse, item missingness, or attrition: (a) an invited student never opens the survey; (b) a respondent answers the sleep question but skips work-hours; (c) a Focus participant takes the pre-test but not the post-test. For each, name the design promise (population claim vs causal claim) that the gap threatens.
- Reproduce the survey bound from the locked counts: with \(162\) of \(360\) reporting adequate sleep and \(240\) nonrespondents, show that the worst-case bound is \([162/600,\ 402/600] = [0.27, 0.67]\). State in one sentence why this is wider than the \((0.40, 0.50)\) sampling interval.
- For each scenario, name the mechanism (MCAR / MAR / MNAR) and say whether reweighting on observed variables can fix it: (a) students answer only on a private coin flip; (b) seniors answer less, but within each year missingness is unrelated to sleep; (c) the least-rested students delete the survey because of how little they sleep.
- A classmate reports “\(45\%\) of undergraduates get adequate sleep” from the survey. Identify the unstated assumption, name the risk, and state what they should report instead.
- In the drug trial, dropout is heavier in the drug arm and the sickest patients leave. Explain in one sentence why the survivor-only \(+2.0\) is not a causal effect, and what a sensitivity bound straddling zero tells you about the claim.
Reading and source pointer
This week is grounded in the instructor notes (primary), which set the first-course, applied level of the missing-data material: the three locations of missingness (unit, item, attrition), the MCAR/MAR/MNAR mechanism ladder, why MNAR resists repair, and the worst-case sensitivity bound as the honest object when MNAR is plausible. Introduction to Modern Statistics (Çetinkaya-Rundel & Hardin) grounds the survey nonresponse and missing-data vocabulary and sequence — it is named here only as a topic pointer, with no prose, examples, figures, or exercises reproduced. The connection back to stratification (MAR on class year) reuses the Week 12 sampling design.
These notes are the course’s own synthesis, grounded in but not copied from the sources.
Public vs. graded
These notes, the examples, and the practice here are public and ungraded — study material only. No graded prompts, answer keys, rubrics, point values, or due dates appear on this site. Graded design checkpoints, weekly quizzes, design memos and homework, applied design labs, the midterm, the final design project, and the final exam live in Blackboard (the LMS), which is authoritative for due dates, submissions, and grades. If this page and Blackboard ever disagree, follow Blackboard.
Looking ahead
Next week the course stops adding design machinery and starts using it. Week 14 is a study critique and design-memo workshop: you take a claim, name its unit of analysis, identify the design that produced it, list the threats to validity — including the nonresponse and attrition gaps you bounded this week — and write a short design memo that says, in plain language, exactly what the evidence can and cannot support. Everything from random sampling and random assignment through confounding, factorial effects, and now missing data becomes a single checklist you run against a study.
See also
- Week 11 — Surveys and sampling frames — where the SRS \(\hat p = 0.45\), the sampling interval \((0.40, 0.50)\), and the nonresponse bound \([0.27, 0.67]\) first appear.
- Week 12 — Stratified and cluster sampling — class-year strata are the observed lever that makes MAR-on-year reweighting possible.
- Week 14 — Study critique and design-memo workshop — fold the missingness check into a full design critique.
- Design glossary — unit nonresponse, item missingness, attrition, MCAR, MAR, MNAR, sensitivity analysis.
- Design reference — the design families side by side, with the threats each one faces.
- Causal-diagram guide — for reasoning about why attrition breaks the balance random assignment created.