Week 12 — Stratified and cluster sampling
How sampling designs change the precision of a population estimate
The week question
Last week you drew a simple random sample of the campus study-habits survey and got an estimate with a standard error attached to it. That standard error assumed every student was drawn independently, one at a time, from the whole population. But most real surveys are not drawn that way — it is too expensive, and the population usually has structure (class years, dorms, schools) you can exploit or that gets forced on you by how you reach people. So this week’s question is: when you sample with structure instead of one student at a time — sampling within groups, or sampling whole groups — what happens to the precision of the same population estimate, and how do you account for it correctly?
This is a design-reasoning question, not a software question. The point estimate \(\hat p\) can come out the same; what changes is its standard error, and the change is driven entirely by the sampling design you chose, not by the analysis you ran afterward. Two designs that touch the same number of students can deliver wildly different precision — and one of them, analyzed carelessly, will lie to you about how precise it is.
Why this matters
The whole reason a survey earns a population claim is random sampling — the mechanism that selects units into the sample. But “random” is not one thing. A simple random sample (SRS) gives every student an equal, independent chance of selection. Real designs trade that independence away for cheaper data collection or for better precision, and each trade has a price you must report.
Two such designs dominate practice. Stratified sampling divides the population into groups (strata) and samples within each group; when the strata genuinely differ on the thing you are measuring, this lowers the variance of your estimate — you get a sharper answer for the same cost. Cluster sampling picks whole groups (clusters) and measures everyone in the chosen groups; this is far cheaper to field, but because people in the same cluster resemble each other, it inflates the variance — you get a fuzzier answer than the raw sample size suggests.
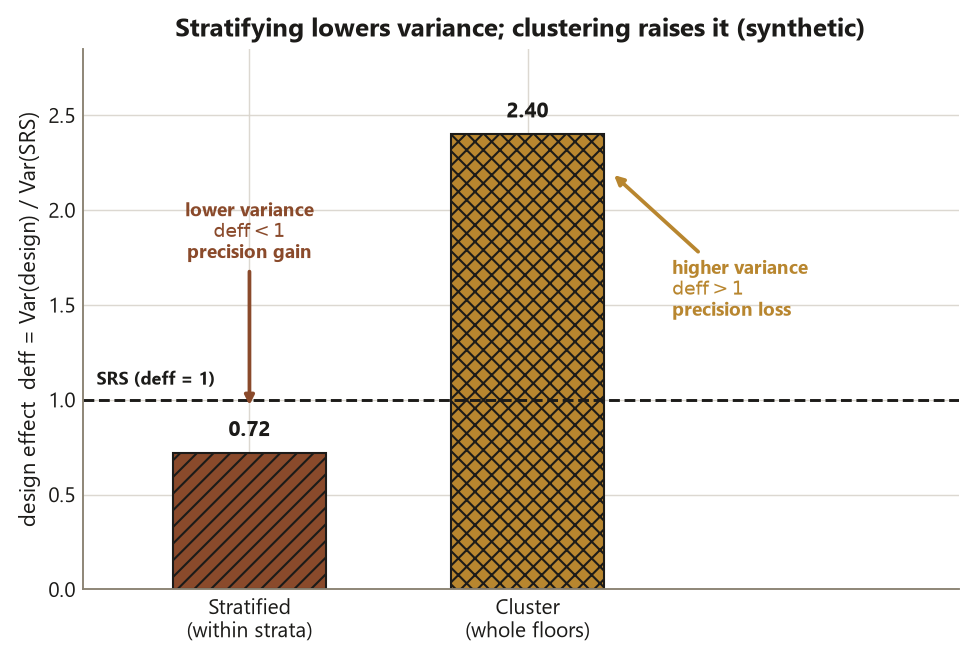
The single mechanism that quantifies both effects is the design effect, written \(\text{deff}\): the ratio of your design’s variance to the variance an SRS of the same size would have given. A stratified design can push \(\text{deff}\) below \(1\) (a precision gain); a cluster design pushes it above \(1\) (a precision loss). The error that ruins cluster studies in practice is to ignore \(\text{deff}\) entirely — to take a cluster sample and analyze it as if it were an SRS, reporting a standard error that is far too small and a confidence interval far too narrow. That is Risk 12, and it is one half of this week. The other half is Risk 3: when you sample whole floors but pretend each student is the independent unit, you have analyzed at the wrong grain. Both errors are invisible to the software — the arithmetic runs fine — and both overstate how much you actually know.
Learning goals
By the end of this week you should be able to:
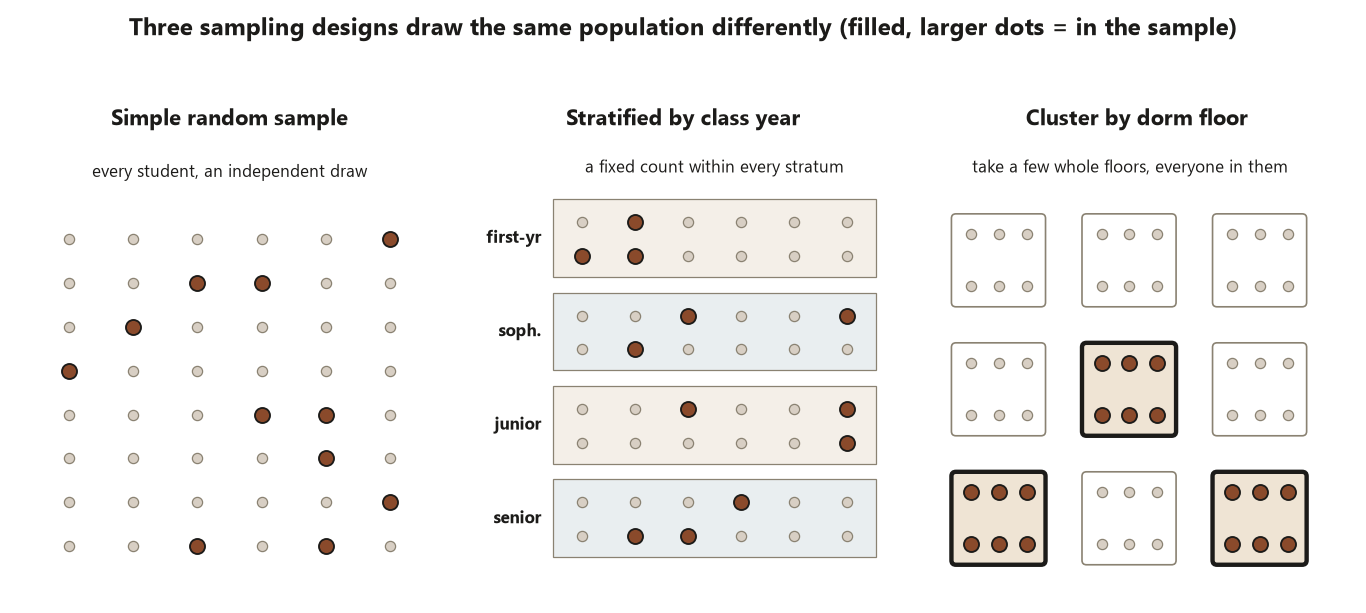
- distinguish simple random, stratified, cluster, and multistage sampling by what each design samples — individuals at random, individuals within strata, whole groups, or groups then individuals;
- explain why stratifying lowers variance when strata differ (between-stratum variation is removed) and why clustering raises variance (within-cluster similarity, measured by the intra-cluster correlation \(\rho\), makes each extra cluster member add less new information);
- compute and interpret the design effect \(\text{deff} = 1 + (m-1)\rho\) for equal clusters of size \(m\), and convert it to a corrected standard error via \(\operatorname{SE}_{\text{design}} = \operatorname{SE}_{\text{SRS}}\sqrt{\text{deff}}\);
- state plainly that a cluster sample must not be analyzed as an SRS, and identify the unit of analysis a sampling design actually used (Risk 3, Risk 12);
- read a reported standard error and ask whether the design effect was applied or silently ignored.
Core vocabulary
- Simple random sample (SRS) — every unit in the frame has an equal, independent chance of selection; the baseline design against which others are compared.
- Stratum (plural strata) — a pre-defined subgroup of the population (e.g. a class year). In stratified sampling you draw a sample within every stratum.
- Stratified sampling — sample independently within each stratum and combine. Removes between-stratum variation from the estimate, so it lowers variance when strata differ on the outcome.
- Cluster — a naturally occurring group of units (a dorm floor, a classroom, a school) that you can sample as a whole.
- Cluster sampling — randomly select whole clusters, then measure every unit inside the chosen clusters. Cheaper to field but inflates variance because cluster members resemble one another.
- Multistage sampling — sample clusters, then sample units within the chosen clusters (rather than taking all of them); a practical hybrid that controls cost while limiting the clustering penalty.
- Intra-cluster correlation \(\rho\) — how alike units in the same cluster are on the outcome (\(0\) = no more alike than random; toward \(1\) = nearly identical). It is the engine of the clustering penalty.
- Design effect \(\text{deff}\) — the ratio \(\operatorname{Var}_{\text{design}} / \operatorname{Var}_{\text{SRS}}\) for the same sample size. \(\text{deff} < 1\) is a precision gain; \(\text{deff} > 1\) is a precision loss; for equal clusters of size \(m\), \(\text{deff} = 1 + (m-1)\rho\).
- Effective sample size — the SRS size that would have given your design’s precision; for a cluster design it is \(n / \text{deff}\), which is smaller than the number of people you actually measured.
Concept development
Stratified sampling: sample within groups, remove between-group variation
Begin with the design that helps you. In stratified sampling you partition the population into strata — groups defined before you sample, on a variable you can see in the frame — and then draw an independent sample inside each stratum. For the campus survey, the natural strata are class years: first-year, sophomore, junior, senior.
The reason this lowers variance is mechanical. An SRS lets the luck of the draw deliver, say, too many seniors and too few first-years; if sleep habits differ by class year, that imbalance adds noise to your estimate. Stratifying forces the right number from each year, so the between-year differences can no longer contribute to the sampling variability at all — they are held fixed by design. What remains is only the variation within years, which is smaller whenever the years genuinely differ. The bigger the between-stratum differences relative to within-stratum spread, the more you gain, and the design effect drops below \(1\).
The design move to name is precise: you sampled individuals, but you sampled them within fixed strata, and that constraint — not any cleverness in the analysis — is what buys the precision. The claim a stratified survey supports is still a population claim about all undergraduates; stratification only sharpens the estimate of that claim, it does not change what is being claimed.
Cluster sampling: sample whole groups, pay the correlation penalty
Now the design that costs you. In cluster sampling you randomly select whole, naturally occurring groups — for the campus survey, dorm floors — and then survey everyone on each selected floor. This is far cheaper than chasing a scattered SRS across the whole campus: you visit a handful of floors instead of locating hundreds of individuals.
The price is paid through intra-cluster correlation \(\rho\). Students on the same dorm floor share an environment — the same quiet hours, the same noise, the same social rhythm — so they tend to report similar sleep. When two units in your sample are correlated, the second one tells you less that is new than an independent draw would. Measuring fifteen near-identical students on one floor is worth far less than fifteen independent students scattered across campus. So each extra cluster member adds less information, the effective sample size shrinks below the head count, and the variance of the estimate inflates above the SRS baseline. The design effect rises above \(1\).
The design move here is the dangerous one: you sampled whole floors, so the floor — not the student — is the unit the randomness operated on. If you then turn around and analyze the data as though each student were an independent draw, you have mismatched the unit of analysis to the design (Risk 3) and you will report a standard error that is far too small (Risk 12). The cluster claim is still a population claim, but its honest uncertainty is larger than the raw sample size suggests.
The design effect: one number that prices both designs
Both effects are captured by the design effect, the ratio of your design’s variance to the variance an SRS of the same size would have:
\[ \text{deff} = \frac{\operatorname{Var}_{\text{design}}}{\operatorname{Var}_{\text{SRS}}}, \qquad \operatorname{SE}_{\text{design}} = \operatorname{SE}_{\text{SRS}}\sqrt{\text{deff}}. \]
For equal-sized clusters of size \(m\) with intra-cluster correlation \(\rho\), the design effect has a clean closed form:
\[ \text{deff} = 1 + (m - 1)\,\rho. \]
Read this formula slowly, because every term earns its place. If \(\rho = 0\) — cluster members are no more alike than random strangers — then \(\text{deff} = 1\) and cluster sampling costs you nothing; it is as good as an SRS. As \(\rho\) rises toward \(1\), or as the clusters get larger (\(m\) grows), the penalty climbs: bigger, more internally similar clusters waste more of your sample. Stratified sampling does not use this exact formula (strata are not clusters), but it lives on the same scale — a well-chosen stratification yields \(\text{deff} < 1\), and you report its corrected SE the same way.
The interpretive habit to build is this: a standard error is only honest once the design effect has been applied. Two surveys can report the same \(\hat p\); the one that ignored a \(\text{deff}\) of \(2.4\) is claiming roughly \(\sqrt{2.4} \approx 1.55\) times more precision than it actually has. Multistage sampling — sample clusters, then sample within them rather than taking everyone — sits between the extremes: it keeps fieldwork cheap while limiting how much clustering you absorb, so its design effect lands above \(1\) but below the take-everyone cluster design.
Worked examples
Worked example — the study-habits survey: stratified vs cluster (recurring study, locked numbers)
Study S estimates the proportion of undergraduates who get adequate sleep (\(\ge 7\) hours). This is a population claim, so what matters is random sampling, not assignment. The locked baseline from Week 11 is the simple random sample: of \(n = 600\) invited, \(360\) responded, and the proportion reporting \(\ge 7\) hours was \(\hat p = 162/360 = 0.45\), with
\[ \operatorname{SE}_{\text{SRS}}(\hat p) = \sqrt{\frac{0.45 \cdot 0.55}{360}} \approx 0.026. \]
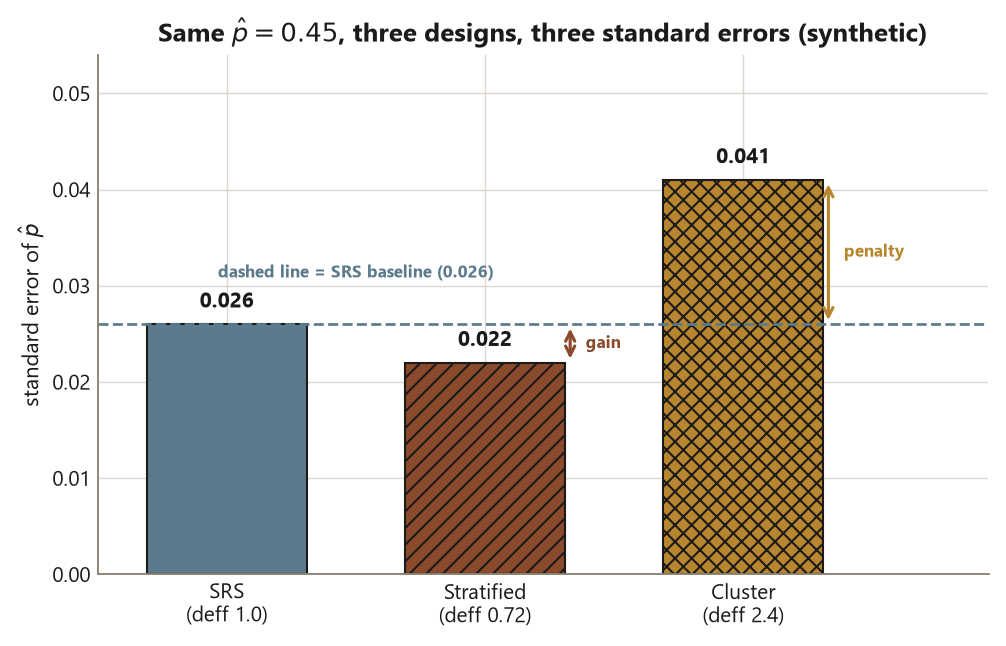
That \(0.026\) is the yardstick. Now hold the point estimate \(\hat p = 0.45\) fixed and change only the design.
Stratified design. Stratify the survey by class year and sample within each year. Because sleep differs across years (first-years and seniors keep different hours), removing the between-year variation lowers the variance, and the design effect comes out below \(1\):
\[ \text{deff}_{\text{strat}} \approx 0.72, \qquad \operatorname{SE}_{\text{strat}} = \operatorname{SE}_{\text{SRS}}\sqrt{\text{deff}_{\text{strat}}} \approx 0.026\sqrt{0.72} \approx 0.022. \]
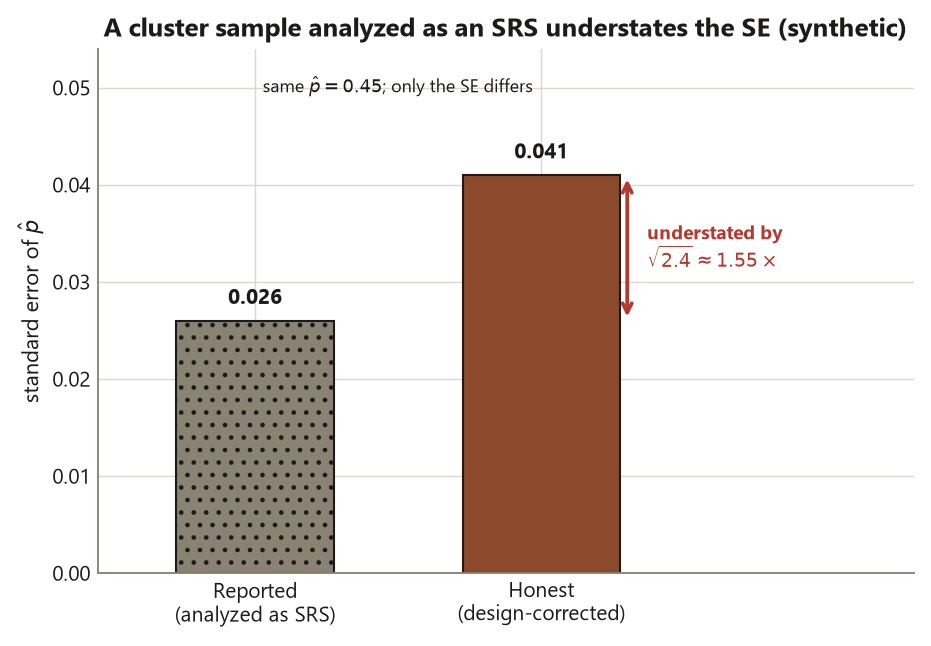
Cluster design. Instead sample 24 dorm floors (the clusters) of about \(m \approx 15\) students each (roughly \(360\) students surveyed), with intra-cluster correlation \(\rho \approx 0.10\). The design effect:
\[ \text{deff}_{\text{clust}} = 1 + (m - 1)\rho = 1 + 14(0.10) = 2.4, \qquad \operatorname{SE}_{\text{clust}} = 0.026\sqrt{2.4} \approx 0.041. \]
Here is the static R that lays the three designs side by side. It is shown as teaching and is not executed in this diagnostic.
# Study S — pricing three sampling designs for the same p-hat.
# Synthetic; seed set. Static, non-executed code (shown as teaching).
set.seed(45403)

p_hat   <- 0.45          # locked: 162 / 360 responders reporting >= 7 hours sleep
n_resp  <- 360           # locked: responders to the SRS invitation

# Baseline SRS standard error (the yardstick).
se_srs  <- sqrt(p_hat * (1 - p_hat) / n_resp)     # ~ 0.026

# Stratified by class year: strata differ -> deff < 1 (a precision GAIN).
deff_strat <- 0.72                                # locked design effect
se_strat   <- se_srs * sqrt(deff_strat)           # ~ 0.022  (< 0.026: sharper)

# Cluster by dorm floor: 24 floors of m = 15, intra-cluster correlation rho.
m          <- 15
rho        <- 0.10
deff_clust <- 1 + (m - 1) * rho                   # 1 + 14*0.10 = 2.4
se_clust   <- se_srs * sqrt(deff_clust)           # ~ 0.041  (> 0.026: fuzzier)

# Effective sample size of the cluster design: n / deff.
n_eff      <- n_resp / deff_clust                 # 360 / 2.4 = 150 effective students

# The cluster sample analyzed (WRONGLY) as an SRS would report se_srs (0.026) -- too small.
Interpretation. All three designs estimate the same population quantity, \(\hat p = 0.45\), so the claim — about all undergraduates — does not change; only the precision does. The stratified design gives \(\operatorname{SE} \approx 0.022 < 0.026\): by sampling individuals within fixed class-year strata, you removed the between-year variation and bought a sharper estimate at no extra sample. The cluster design gives \(\operatorname{SE} \approx 0.041 > 0.026\): because you sampled whole floors and floor-mates resemble one another (\(\rho \approx 0.10\)), each of the \(360\) surveyed students is worth less than an independent draw, and the effective sample size is only \(360 / 2.4 = 150\). The decisive design point is the last comment line: if you took that cluster sample and reported the SRS standard error of \(0.026\), you would be claiming about \(1.55\) times more precision than you have — analyzing a cluster sample as an SRS (Risk 12), at the wrong unit of analysis (Risk 3). The honest cluster standard error is \(0.041\), and the confidence interval built from it is correspondingly wider.
Worked example — a national reading survey clustered by school (transfer)
Move to a new context to see the same machinery at a different scale. A state education agency wants to estimate the proportion of fourth-graders who read at grade level across the state. Sending a tester to a random scatter of individual children statewide is prohibitively expensive, so the agency uses cluster sampling by school: it randomly selects whole schools and tests every fourth-grader in each chosen school. The numbers below are illustrative and clearly distinct from the locked study slice.
Suppose the agency tests \(m = 25\) children per school across a set of schools, and the proportion reading at grade level comes out \(\hat p = 0.60\) with an SRS-style standard error of \(\operatorname{SE}_{\text{SRS}} \approx 0.015\) for that head count. Children in the same school share teachers, curriculum, and neighbourhood, so the intra-cluster correlation is substantial, say \(\rho \approx 0.20\). The design effect is
\[ \text{deff} = 1 + (m - 1)\rho = 1 + 24(0.20) = 5.8, \]
so the corrected standard error is
\[ \operatorname{SE}_{\text{clust}} = \operatorname{SE}_{\text{SRS}}\sqrt{\text{deff}} \approx 0.015\sqrt{5.8} \approx 0.036, \]
and the effective sample size is only \(1/5.8 \approx 17\%\) of the children actually tested.
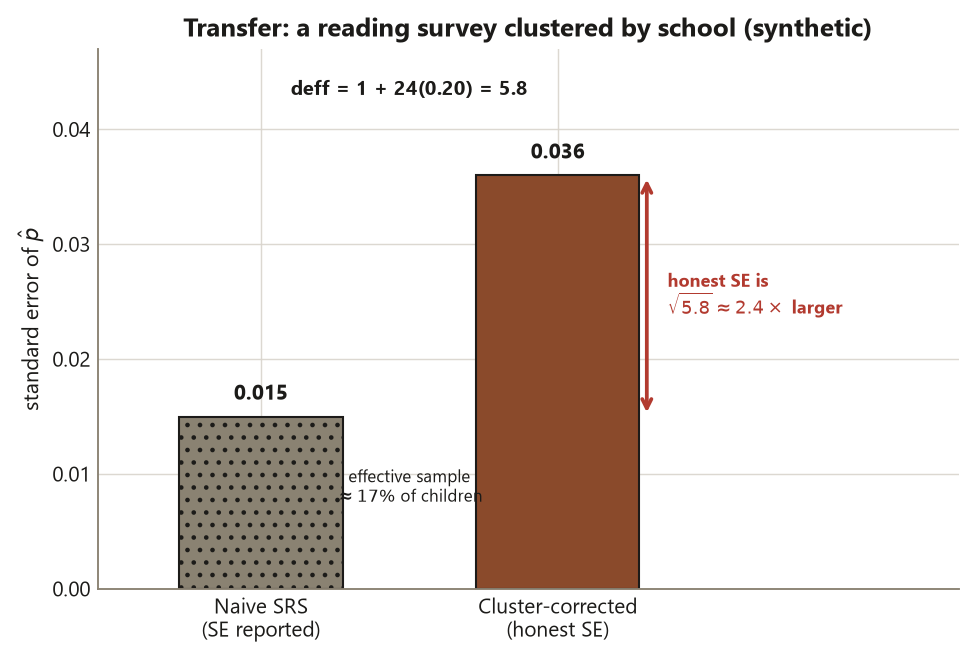
Interpretation. The agency sampled whole schools, so the school — not the child — is the unit the randomness operated on. With \(\rho \approx 0.20\) and \(25\) children per school, the design effect of \(5.8\) is severe: more than four-fifths of the apparent sample is eaten by within-school similarity, and the honest standard error (\(0.036\)) is nearly two-and-a-half times the naive SRS value (\(0.015\)). The claim this survey supports is a population claim about the state’s fourth-graders, but only with the wider, design-corrected interval. The fix the agency would reach for is multistage sampling — select schools, then sample a few children per school rather than all \(25\) — which keeps the fieldwork cheap while cutting the clustering penalty, because a smaller \(m\) shrinks \((m-1)\rho\). Reporting the \(0.015\) SRS error for a cluster design here would understate the uncertainty by a factor of more than two (Risk 12), at the wrong unit of analysis (Risk 3).
A common mistake
The signature mistake this week is to take a cluster sample and analyze it as if it were a simple random sample — ignoring the design effect entirely. The arithmetic does not complain: you compute \(\sqrt{\hat p(1-\hat p)/n}\) on the number of people you measured, get a comfortably small standard error, and report a tight confidence interval. Nothing in the output warns you that the number is a fiction. In the campus survey that fiction reports \(0.026\) when the truth is \(0.041\); in the school survey it reports \(0.015\) when the truth is \(0.036\).
Underneath the error is a unit-of-analysis confusion (Risk 3): the design sampled floors (or schools), so the cluster is the independently sampled unit, but the careless analysis treats each student (or child) as independent. Because cluster-mates are correlated, that double-counts information you do not have. The fix is a single disciplined step: identify what the design actually sampled, then apply the design effect. If you sampled whole groups, compute \(\text{deff} = 1 + (m-1)\rho\), inflate the standard error by \(\sqrt{\text{deff}}\), and report the effective sample size \(n/\text{deff}\) — not the head count. The mirror-image caution holds for the other direction: a stratified design’s \(\text{deff} < 1\) means analyzing it as an SRS understates your precision and wastes a real gain. Either way, the rule is the same — the standard error is only honest once the design effect is in it (Risk 3, Risk 12).
Low-stakes self-checks (ungraded)
These are for your own practice — ungraded, no submission.
- In one sentence each, say what is sampled in a stratified design versus a cluster design, and which one is expected to lower the variance of the estimate and why.
- For the campus cluster design with \(m = 15\) and \(\rho = 0.10\), confirm that \(\text{deff} = 2.4\) and that the corrected standard error is about \(0.041\). Then state the effective sample size and explain why it is smaller than \(360\).
- A classmate reports the campus cluster survey with a standard error of \(0.026\). Name the two risks they have triggered, and say in which direction their confidence interval is wrong (too wide or too narrow).
- Suppose a new stratification of the campus survey produced \(\text{deff} = 0.85\) instead of \(0.72\). Did the precision gain get larger or smaller, and what does that say about how different the strata are on sleep?
- In the national school survey, the agency switches from testing all \(25\) children per school to testing only \(5\) per school (multistage). With \(\rho \approx 0.20\) unchanged, recompute \(\text{deff}\) and explain why multistage sampling reduces the clustering penalty.
Reading and source pointer
This week is grounded in the instructor notes (primary), which set the first-course, applied level of the sampling-design material: stratified, cluster, and multistage sampling, the design effect, and the unit-of-analysis trap. The IMS chapters on sampling (Çetinkaya-Rundel & Hardin) ground the concepts and the sequence — what stratified, cluster, and multistage sampling are and when each is used — and the ModernDive sampling-simulation workflow (Ismay, Kim & Valdivia) grounds the reproducible R posture used in the companion lab, where you simulate the three designs and read the design effect off the spread of the estimates. No prose, examples, figures, or exercises are reproduced from any source.
These notes are the course’s own synthesis, grounded in but not copied from the sources.
Public vs. graded
These notes, the examples, and the practice here are public and ungraded — study material only. No graded prompts, answer keys, rubrics, point values, or due dates appear on this site. Graded design checkpoints, weekly quizzes, design memos and homework, applied design labs, the midterm, the final design project, and the final exam live in Blackboard (the LMS), which is authoritative for due dates, submissions, and grades. If this page and Blackboard ever disagree, follow Blackboard.
Looking ahead
Next week closes the sampling arc by turning to the threat that no sampling design can fix on its own: missing data and nonresponse. You will classify why data are missing — MCAR, MAR, or MNAR — distinguish unit nonresponse (the \(240\) who never answered the campus survey) from item missingness and from attrition in the experiment, and run a sensitivity analysis like the locked nonresponse bound \([0.27, 0.67]\), which dwarfs every sampling standard error you computed this week. The design effect tells you how precise your responders are; nonresponse asks whether the responders represent the population at all.
See also
- Week 11 — Surveys and sampling frames — the SRS baseline (\(\hat p = 0.45\), \(\operatorname{SE} \approx 0.026\)) this week’s design effects are measured against.
- Week 13 — Missing data and nonresponse — the threat that a design effect cannot fix: whether your sample represents the population.
- Lab 12 — Sampling designs by simulation — simulate SRS, stratified, and cluster sampling and read the design effect off the spread of the estimates.
- Design glossary — stratified, cluster, multistage, design effect, intra-cluster correlation, effective sample size.
- Design reference — the design families side by side.
- Causal-diagram guide — the companion reference for the causal-evidence weeks.