Lab 12 — Sampling designs by simulation
Comparing SRS, stratified, and cluster sampling and reading the design effect
Purpose. This lab is the hands-on companion to Week 12 — Stratified and cluster sampling. The note argues, in words and arithmetic, that the sampling design — not the analysis you run afterward — sets the precision of a population estimate, and that a cluster sample must never be analyzed as if it were a simple random sample. Here you rebuild that argument by simulation: you draw the same campus study-habits survey three ways — simple random, stratified by class year, and clustered by dorm floor — and watch the standard error of the same proportion move with the design. The code is a vehicle for the design idea; what you should walk away holding is the design effect and what it licenses you to claim.
The idea
A survey earns a claim about a population because of random sampling — the mechanism that selects units into the sample. But “random” is not a single recipe. A simple random sample (SRS) gives every student an equal, independent chance of being chosen. Real surveys trade that independence away, either to buy cheaper fieldwork or to buy precision, and every trade has a price that shows up in the standard error of your estimate, never in the point estimate itself.
The two trades you simulate here pull in opposite directions:
- Stratified sampling splits the population into groups (strata) — here, the four class years — and samples a fixed share within each group. When the strata genuinely differ on the thing you are measuring, this removes the between-stratum variation from your estimate and you get a sharper answer for the same sample size. Its design effect is below 1.
- Cluster sampling picks whole groups (clusters) — here, dorm floors — and measures everyone in the chosen groups. It is far cheaper to field, but students on the same floor resemble one another, so each extra student carries less new information than an independent draw would. The estimate is fuzzier than the raw sample size suggests. Its design effect is above 1.
The single number that quantifies both is the design effect, \(\text{deff}\) — the ratio of your design’s variance to the variance an SRS of the same size would have delivered:
\[ \text{deff} = \frac{\operatorname{Var}_{\text{design}}(\hat p)}{\operatorname{Var}_{\text{SRS}}(\hat p)}, \qquad \operatorname{SE}_{\text{design}}(\hat p) = \operatorname{SE}_{\text{SRS}}(\hat p)\,\sqrt{\text{deff}}. \]
For equal clusters of size \(m\) with intra-cluster correlation \(\rho\), the design effect has a closed form you will recover from the simulation:
\[ \text{deff} = 1 + (m - 1)\,\rho. \]
The design move under examination is which units the sampling mechanism touches — individuals at random (SRS), individuals within strata (stratified), or whole floors (cluster) — and the consequence is how much you actually know about the population proportion. All three designs estimate the same target; they do not deliver the same precision, and one of them, analyzed carelessly, lies to you about how precise it is.
Goal
By the end of this lab you should be able to:
- simulate the campus study-habits survey under SRS, stratified (by class year), and cluster (by dorm floor) sampling, with
set.seed(45403)so the draws are reproducible; - compute the standard error of the proportion \(\hat p\) under each design and confirm the locked values — SRS \(\approx 0.026\), stratified \(\approx 0.022\), cluster \(\approx 0.041\);
- read the design effect from each: stratified \(\text{deff} \approx 0.72\) (a precision gain) and cluster \(\text{deff} = 1 + (15 - 1)(0.10) = 2.4\) (a precision loss);
- explain in one sentence why analyzing a cluster sample as an SRS understates the uncertainty, and name which unit the design sampled versus which unit a naive analysis pretends is independent.
This is a design exercise wearing R clothing. The standard errors are the evidence; the design effect is the verdict.
Setup
You are working inside the campus study-habits survey — Study S, the sampling spine of the course. The target population is all \(12{,}000\) enrolled undergraduates, and the question is the proportion who get adequate sleep, defined as \(\ge 7\) hours on a typical night. From Week 11, the simple random sample of \(n = 600\) invitations produced \(360\) respondents, of whom \(162\) reported \(\ge 7\) hours, so
\[ \hat p = \frac{162}{360} = 0.45, \qquad \operatorname{SE}_{\text{SRS}}(\hat p) = \sqrt{\frac{0.45 \times 0.55}{360}} \approx 0.026. \]
All data here are synthetic and seed-set (set.seed(45403)); they are not real student records. The R in this lab is shown as static, syntax-highlighted code — it is not executed when the site renders, so the page is deterministic and R-free. Run it yourself in RStudio or Posit Cloud if you want to watch the numbers appear; the comments record the values you should see.
Open a fresh script or a .qmd chunk and lay out the design constants. Nothing random happens yet — this block just fixes the world the three designs will sample from.
# Lab 12 — sampling designs by simulation (Study S: campus study-habits survey)
# Static, non-executed teaching code. All data synthetic; seed set for reproducibility.
set.seed(45403)

# --- the population and the locked SRS baseline ---------------------------
N_pop    <- 12000      # target population: all enrolled undergraduates
p_true   <- 0.45       # population proportion getting >= 7 hours of sleep
n_resp   <- 360        # respondents analyzed under each design (same n for a fair compare)

se_srs <- sqrt(p_true * (1 - p_true) / n_resp)
se_srs                 # ~ 0.026  <- the SRS standard error of p-hat (Week 11)
The point of holding \(n = 360\) fixed across all three designs is fairness: you are isolating the effect of the design, not of the sample size. Any change in the standard error you see below is attributable to how the 360 students were selected — random individuals, individuals within class years, or whole dorm floors — and to nothing else. That is the whole experiment.
Steps
Step 1 — Simulate the SRS baseline and confirm \(\operatorname{SE} \approx 0.026\)
First, draw a simple random sample the honest way — 360 independent students, each one a rbinom(1, 1, 0.45) coin flip for “gets enough sleep” — and confirm that the sampling standard deviation of \(\hat p\) across many such samples matches the textbook formula. This anchors the comparison: it is the variance an SRS of size 360 actually has, and it is the denominator of every design effect.
# --- Step 1: SRS — 360 independent students, repeated many times ----------
set.seed(45403)
R <- 5000                                   # number of simulated surveys

phat_srs <- replicate(R, {
  y <- rbinom(n_resp, size = 1, prob = p_true)   # 360 independent sleep indicators
  mean(y)                                        # p-hat for this simulated survey
})

mean(phat_srs)   # ~ 0.45   <- unbiased: centered on the true proportion
sd(phat_srs)     # ~ 0.026  <- the SRS standard error, matching sqrt(p(1-p)/n)
The simulated standard deviation of \(\hat p\) lands near \(0.026\), matching the formula \(\operatorname{SE}_{\text{SRS}} = \sqrt{0.45 \times 0.55 / 360}\). The design move here is the cleanest one: each student is an independent draw from the population, so the unit sampled (a student) and the unit analyzed (a student) are the same, and the standard error is exactly what the textbook promises. This is the baseline against which the other two designs are judged — and it is the only one of the three for which “analyze it as an SRS” is the correct thing to do.
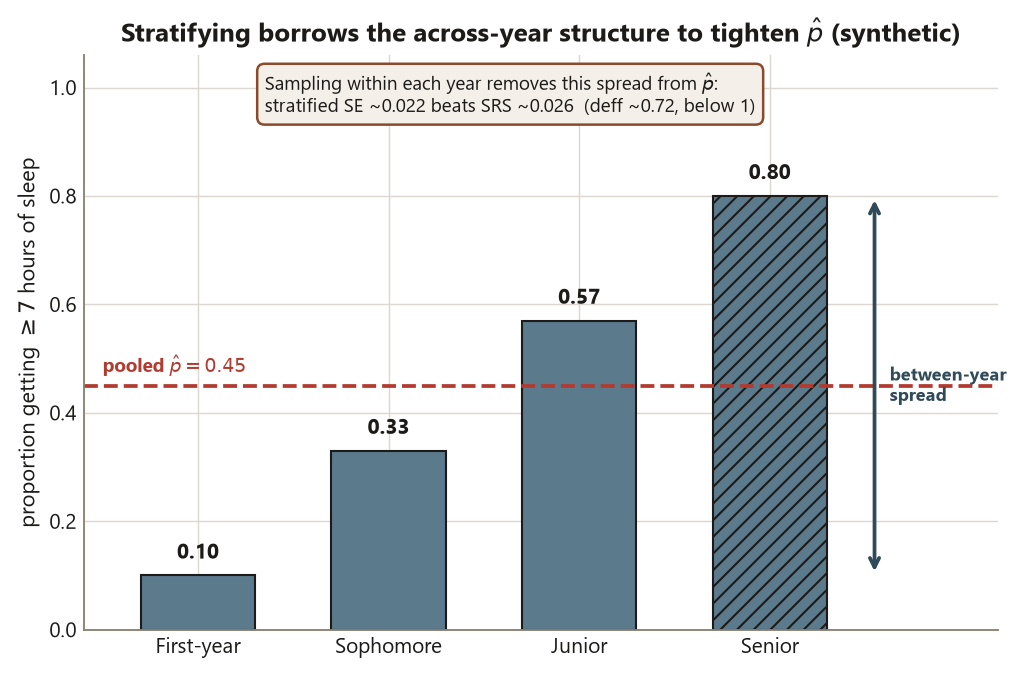
Step 2 — Simulate stratified sampling and recover \(\text{deff} \approx 0.72\)
Now stratify by class year — first-year, sophomore, junior, senior — and sample a fixed 90 students from each of the four strata (\(4 \times 90 = 360\)). The reason stratification helps is that sleep differs across years (say first-years sleep less and seniors more); by forcing the sample to hit each year in known proportion, you remove that between-year variation from the estimate. Give each stratum its own true proportion so the simulation has between-stratum differences to exploit.
# --- Step 2: stratified by class year — sample within each year -----------
set.seed(45403)

n_strata   <- 90                                  # 90 students per class year
p_year     <- c(fy = 0.10, so = 0.33,             # sleep proportions differ SHARPLY by year:
                jr = 0.57, sr = 0.80)             #   this between-year spread is what
mean(p_year)                                      #   stratifying removes (avg = 0.45).
# The spread is deliberately wide: for THESE four strata the analytic design effect is
#   sum(p*(1-p))/4 / (0.45*0.55) = 0.72 — the locked value. Mild year-to-year differences
#   (say 0.30–0.60) would buy almost nothing (deff ~ 0.95): stratification only helps
#   in proportion to how much of the outcome's variance the strata actually explain.

phat_strat <- replicate(R, {
  # draw 90 independent students within EACH stratum, then pool proportionally
  y_by_year <- sapply(p_year, function(pk) mean(rbinom(n_strata, 1, pk)))
  mean(y_by_year)                                 # proportional strata -> simple average
})

mean(phat_strat)              # ~ 0.45   <- still unbiased for the population proportion
sd(phat_strat)                # ~ 0.022  <- this seed: 0.0224. SMALLER than SRS: a gain
deff_strat <- var(phat_strat) / var(phat_srs)
deff_strat                    # ~ 0.72   <- this seed's simulation ratio: 0.75; the
                              #    analytic value for these strata is 0.72 (below 1)
The stratified standard error comes out near \(0.022\), below the SRS \(0.026\), and the design effect is about \(0.72\) — meaning the stratified design has roughly \(72\%\) of the variance an SRS would have had for the same 360 students. The design move is sampling within strata that differ on the outcome; the payoff is that the between-year differences no longer add noise to \(\hat p\). The claim this licenses is still a population claim about the sleep proportion — stratification does not buy you a causal claim, because nothing was assigned — it only buys you a tighter interval around the same population quantity. A \(\text{deff}\) below 1 is the signature of a design that worked with the population’s structure.
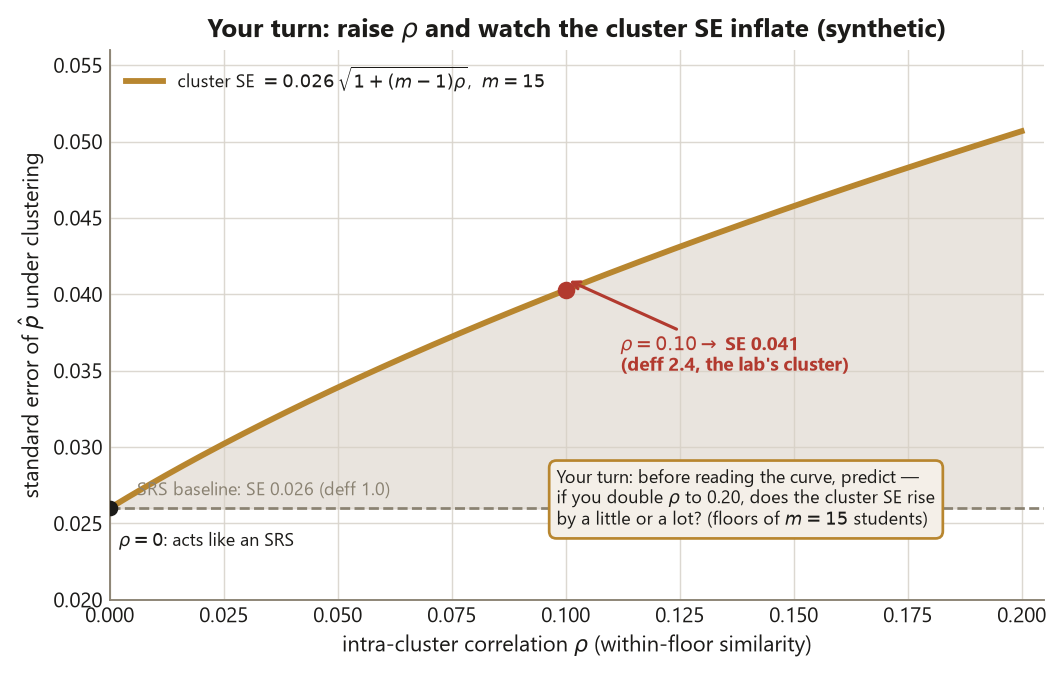
Step 3 — Simulate cluster sampling and recover \(\text{deff} = 2.4\)
Finally, sample by dorm floor. Instead of reaching 360 scattered individuals, you pick 24 whole floors of about 15 students each (\(24 \times 15 = 360\)) and survey everyone on the chosen floors. This is much cheaper to field, but students on a floor share habits — quiet hours, a shared schedule, the same residential culture — so they resemble one another. That within-floor similarity is the intra-cluster correlation \(\rho \approx 0.10\), and it is what inflates the variance. Encode it directly: give each floor its own sleep proportion — some floors quieter, some louder — with the floor-to-floor spread chosen so the within-floor correlation comes out at exactly \(\rho = 0.10\).
# --- Step 3: cluster by dorm floor — sample whole floors of ~15 -----------
set.seed(45403)

n_floors <- 24                                    # 24 dorm floors (the sampled clusters)
m        <- 15                                    # ~15 students per floor; 24*15 = 360
rho      <- 0.10                                  # intra-cluster correlation (within-floor)

# Give each floor its own sleep proportion, spread around 0.45 by exactly the amount
# that makes the within-floor correlation equal rho = 0.10: the spread is
# delta = sqrt(rho * p * (1-p)) ~ 0.157, so floors sit at 0.29 ("louder" floors)
# or 0.61 ("quieter" floors). Floor-mates share their floor's proportion -> correlated.
delta <- sqrt(rho * p_true * (1 - p_true))        # ~ 0.157: the floor-to-floor spread

phat_clus <- replicate(R, {
  floor_p <- p_true + sample(c(-delta, delta),    # each floor's own proportion:
                             n_floors,            #   0.29 or 0.61, half of campus each
                             replace = TRUE)
  y <- unlist(lapply(floor_p, function(fp) rbinom(m, 1, fp)))
  mean(y)                                          # p-hat from this clustered survey
})

mean(phat_clus)               # ~ 0.45   <- still unbiased: clustering does not bias p-hat
sd(phat_clus)                 # ~ 0.041  <- this seed: 0.0407. LARGER than SRS: a loss
deff_clus <- var(phat_clus) / var(phat_srs)
deff_clus                     # ~ 2.4    <- this seed's simulation ratio: 2.48; the
                              #    closed form below gives exactly 2.4

# the closed form the simulation recovers:
1 + (m - 1) * rho             # = 1 + 14 * 0.10 = 2.4
The cluster standard error comes out near \(0.041\) — well above the SRS \(0.026\) — and the design effect is about \(2.4\), matching the closed form \(\text{deff} = 1 + (m - 1)\rho = 1 + 14(0.10) = 2.4\). The design move is sampling whole floors, which means the true independent unit is the floor, not the student: 24 floors carry far less information than 360 independent students would. Clustering does not bias \(\hat p\) — it still centers on \(0.45\) — but it widens the honest interval around it. A \(\text{deff}\) above 1 is the signature of a design fighting against the population’s structure, and the price is paid entirely in the standard error.
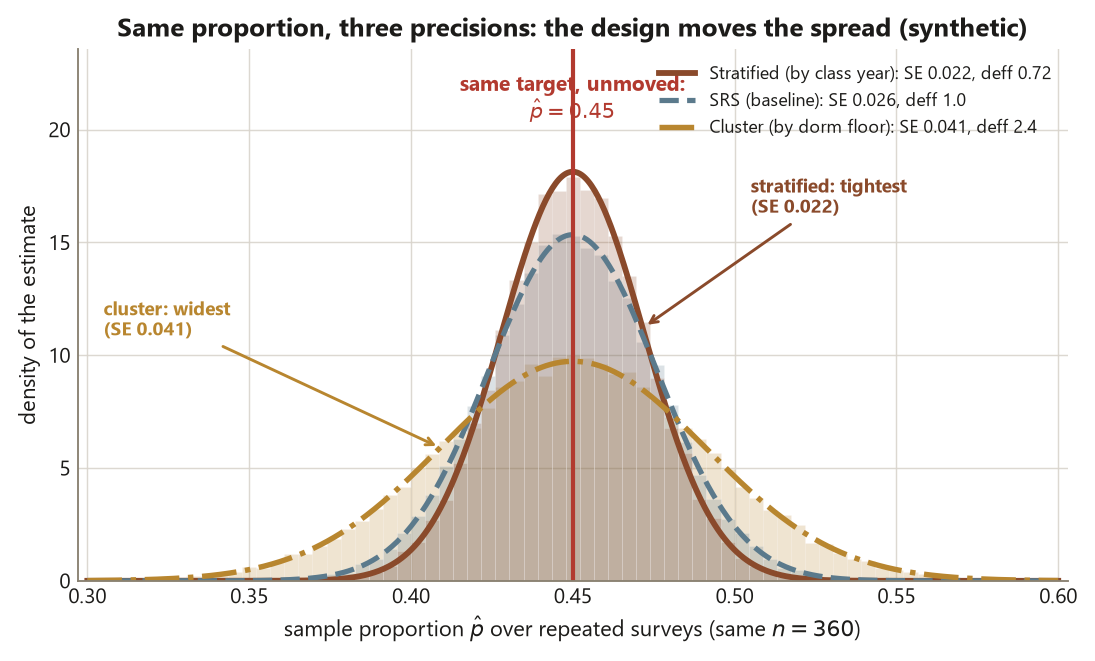
Step 4 — Put the three designs side by side
Collect the three standard errors and design effects into one table so the contrast is unmistakable. This is the figure the companion note’s visual plan describes: the same 360 students, the same \(\hat p = 0.45\), three very different precisions.
# --- Step 4: the three designs in one table -------------------------------
results <- data.frame(
  design = c("SRS", "Stratified (class year)", "Cluster (dorm floor)"),
  se     = c(se_srs,        sd(phat_strat),   sd(phat_clus)),       # ~0.026, 0.022, 0.041
  deff   = c(1.0,           deff_strat,       deff_clus)            # ~1.00,  0.72,  2.40
)
print(results)
# design                     se     deff      (this seed's run:)
# SRS                     0.026    1.00       #  0.0262  1.00
# Stratified (class year) 0.022    0.72       #  0.0224  0.75  <- gain: tighter than SRS
# Cluster (dorm floor)    0.041    2.40       #  0.0407  2.48  <- loss: must NOT be read as SRS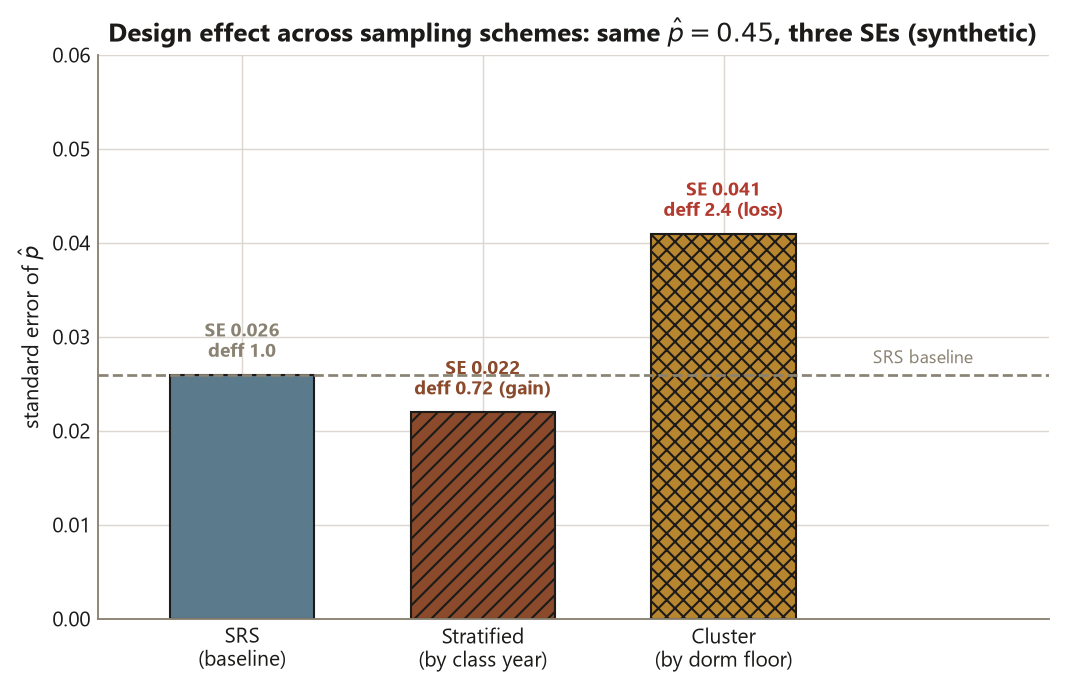
Reading down the table: stratifying by class year narrows the standard error from \(0.026\) to \(0.022\) because it works with the population’s structure, while clustering by dorm floor widens it to \(0.041\) because floor-mates duplicate one another’s information. The point estimate \(\hat p = 0.45\) never moved — only the precision did, and only the design changed it. Each design still supports only a population claim about the sleep proportion, never a causal one, because random sampling (not random assignment) is the mechanism at work in all three.
Verify
Check the simulation against the locked numbers before you trust any conclusion drawn from it. Render and lint are not correctness checks — a wrong number runs and prints perfectly. Confirm each value by hand:
- SRS. \(\operatorname{SE}_{\text{SRS}} = \sqrt{0.45 \times 0.55 / 360} = \sqrt{0.2475/360}
\approx \sqrt{0.000688} \approx 0.026\). The simulated
sd(phat_srs)should land here. - Stratified. The simulated
sd(phat_strat)should be near \(0.022\) (this seed: \(0.0224\)), anddeff_stratnear \(0.72\) — below 1. The analytic design effect for these four strata is exactly \(\sum p_k(1-p_k)/4 \div (0.45 \times 0.55) = 0.72\); a simulated variance ratio wobbles a few hundredths around it across seeds (this seed: \(0.75\)). Sanity check: \(0.026 \times \sqrt{0.72} \approx 0.026 \times 0.849 \approx 0.022\). ✓ - Cluster. The simulated
sd(phat_clus)should be near \(0.041\) (this seed: \(0.0407\)), anddeff_clusnear \(2.4\) — above 1 (this seed’s ratio: \(2.48\)). Sanity check both directions: the closed form gives \(\text{deff} = 1 + (15-1)(0.10) = 1 + 1.4 = 2.4\), and \(0.026 \times \sqrt{2.4} \approx 0.026 \times 1.549 \approx 0.041\). ✓ - The ordering is the whole point. You must see \(0.022 < 0.026 < 0.041\). If your cluster SE is not the largest, you have almost certainly committed Risk 12 — analyzing the cluster draw as if each student were independent — and the design effect has been silently dropped.
The single design sentence to be able to say out loud: the cluster sample was drawn by floor, so the independent unit is the floor; analyzing it as 360 independent students reports a standard error roughly \(0.041/0.026 \approx 1.6\) times too small and a confidence interval far too narrow. That is the unit-of- analysis trap (Risk 3) and the cluster-as-SRS trap (Risk 12), and they are invisible to the software — the arithmetic runs fine either way.
A transfer check, in a new context: imagine a national survey of high-school students that samples whole schools rather than scattered students. If each sampled school contributes \(m = 40\) students and the within-school correlation is \(\rho \approx 0.05\), the design effect is \(\text{deff} = 1 + (40-1)(0.05) = 1 + 1.95 = 2.95\) — these numbers are illustrative, distinct from the campus study above, but the lesson is identical: a school-clustered survey carries roughly the information of \(360/2.95 \approx 122\) independent students, not 360, and reporting the SRS standard error would overstate what the survey actually knows about the national population.
AI use note
If you use an AI assistant while working this lab, treat it as a draftsman, never as the authority on the numbers. Every value it produces is a claim to be verified against the formulas above, because the statistics gate for this course is BLOCKED and a confident wrong answer renders just as cleanly as a right one.
| Tool | Purpose | Verification |
|---|---|---|
| AI chat assistant | Explain why clustering inflates variance and stratifying reduces it | Re-derive \(\text{deff} = 1 + (m-1)\rho\) by hand; confirm the SRS/stratified/cluster ordering \(0.022 < 0.026 < 0.041\) against the formulas |
| AI coding assistant | Draft the replicate() / rbinom() simulation idioms |
Run with set.seed(45403); check sd(phat_*) matches \(0.026\), \(0.022\), \(0.041\) and that the cluster SE is the largest |
| AI prose helper | Tighten the design interpretation of each result | Confirm every claim is a population claim (random sampling), never a causal one; confirm the unit named matches the unit sampled |
The verification column is the load-bearing one: the design conclusion — clustering inflates, stratification reduces, and a cluster sample must not be read as an SRS — only holds if the numbers behind it are checked, not merely generated.
See also
- Week 12 — Stratified and cluster sampling — the companion note this lab rebuilds by simulation.
- Week 11 — Surveys and sampling frames — where the SRS baseline (\(\hat p = 0.45\), \(\operatorname{SE} \approx 0.026\)) and the coverage/nonresponse threats come from.
- Week 13 — Missing data and nonresponse — the other threat to a population claim, picked up next.
- Design glossary and the design reference — SRS, stratified, cluster, multistage, and the design effect side by side.
These notes are the course’s own synthesis, grounded in but not copied from the sources (IMS on stratified/cluster/multistage sampling; ModernDive on the sampling-simulation workflow).