Lab 5 — Randomization and the reference distribution
Building the distribution a randomization p-value reads from
Purpose. This lab is the hands-on companion to Week 5 — Completely randomized experiments. The note argues that in a completely randomized design it is the random assignment — not the p-value — that licenses a causal reading. Here you build the object that p-value reads from: the randomization reference distribution. You will simulate the Focus experiment’s 30/30 assignment, shuffle the treatment labels about \(10{,}000\) times to manufacture the spread of differences the design could produce when the workshop does nothing, mark the observed effect \(d = 3.0\) on it, and read off the randomization \(p\)-value (about \(0.06\)). The code is shown for study and is not executed on this site; you run it in your own R session.
The idea
A completely randomized design hands you one observed number — here the difference in mean gain scores, \(d = \bar y_T - \bar y_C = 3.0\) points — and asks you to decide whether it is bigger than the design could produce by the luck of the draw alone. The elegant feature of a randomized experiment is that you do not need to assume a sampling distribution to answer that. The assignment mechanism is itself a known, repeatable randomizer, so you can rerun it.
The reasoning runs like this. Under the null hypothesis of no effect, every student’s gain score would have come out the same whichever arm they had landed in, so the labels “treatment” and “control” are arbitrary tags pasted onto fixed outcomes. If the tags are arbitrary, then any one of the \(\binom{60}{30}\) ways of splitting these 60 students into two groups of 30 is just as legitimate as the split that actually happened. So you relabel: keep the 60 outcome numbers exactly where they are, randomly call 30 of them “treatment” and 30 “control”, and recompute \(d\). Repeat that thousands of times and you trace out the randomization reference distribution — the full set of differences the design can manufacture when the treatment is inert.
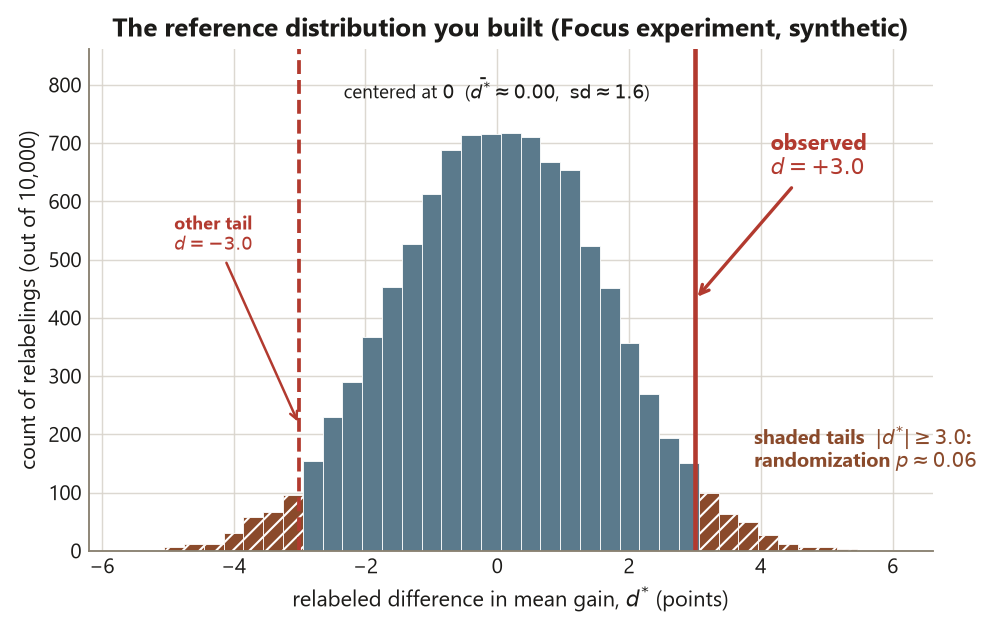
That distribution is the null made concrete. It is centered near zero (relabeling cannot create a systematic gap), and its spread tells you how big a \(d\) pure assignment luck can produce. The randomization \(p\)-value is then the fraction of relabeled differences at least as extreme as the observed \(d = 3.0\). It is a tail probability of a distribution you generated from the assignment, not a verdict on whether the study was well designed. Keep that separation in view the whole way through: the random assignment is what licenses the causal language; the reference distribution only calibrates how surprising \(3.0\) would be if the workshop did nothing.
Goal
By the end of this lab you should be able to:
- Encode a completely randomized 30/30 assignment of the Focus experiment in R with a fixed seed, naming the student as the assigned unit.
- Use
sample()to relabel the 60 fixed outcomes under the null, andreplicate()to repeat the relabeling about \(10{,}000\) times into a reference distribution. - Locate the observed \(d = 3.0\) on that distribution and compute the randomization \(p\)-value (about \(0.06\)).
- Explain why the matching theoretical \(p \approx 0.057\) and randomization \(p \approx 0.06\) both describe surprise under the null, and why neither one is what earns the causal claim.
The point of the lab is the design demonstration: random assignment is the source of the causal reading, and the reference distribution is the null built by relabeling. The code is the means, not the message.
Setup
You need only base R — no packages. Every chunk that draws randomness starts with set.seed(45403), the course-wide seed, so your run reproduces the locked Focus-experiment numbers. The data are synthetic; seed set — these are not real student records.
Fix the design facts before any code runs, because the arithmetic follows from them:
- Unit of analysis: the individual student. Sixty students were each assigned, one at a time. Every \(n\) below counts students, and the standard error must use that count (Risk 3).
- What was assigned: the Focus workshop, at random, to 30 of the 60 students; the other 30 are control. This is the mechanism that earns a causal reading.
- What was not sampled: these 60 students were not drawn at random from any population, so the experiment earns a claim about cause for units like these, not a population claim about all undergraduates (Risk 1).
- The locked slice: treatment mean \(\bar y_T = 8.0\), control mean \(\bar y_C = 5.0\), so \(d = 8.0 - 5.0 = 3.0\) points; pooled SD \(s_p \approx 6.0\); \(\operatorname{SE}(d) \approx 1.55\); \(t \approx 1.94\); two-sided theoretical \(p \approx 0.057\); randomization \(p \approx 0.06\).
set.seed(45403)

# --- Focus experiment: completely randomized design, 60 students, 30 / 30 -----
# Unit of analysis = the individual student (the thing that was assigned).
# Synthetic data; the arm means/SD are the LOCKED Week 5 slice.
n_T <- 30                                  # treatment arm size (students)
n_C <- 30                                  # control arm size   (students)

y_T <- rnorm(n_T, mean = 8.0, sd = 6.0)    # treated students' gain scores (raw draw)
y_C <- rnorm(n_C, mean = 5.0, sd = 6.0)    # control students' gain scores (raw draw)

# Pin each arm EXACTLY to the locked slice: recenter to the locked mean, rescale to
# the locked SD. A raw rnorm() draw only lands NEAR its targets — with this seed the
# raw arm means come out far from 8.0 and 5.0 — so these two lines make the locked
# numbers true by construction, and the lab agrees with the Week 5 note exactly.
y_T <- (y_T - mean(y_T)) / sd(y_T) * 6.0 + 8.0
y_C <- (y_C - mean(y_C)) / sd(y_C) * 6.0 + 5.0

d_obs <- mean(y_T) - mean(y_C)             # observed effect -> d = 3.0 points, EXACT
# d_obs is the ESTIMATE of the causal ESTIMAND (the ATE), licensed by random assignment.

c(ybar_T = mean(y_T), ybar_C = mean(y_C), d = d_obs)   # -> 8.0  5.0  3.0 (exact)
The observed difference is \(d = 3.0\) points. Because the workshop was assigned at random to individual students, this \(3.0\) is a causal estimate — one realized value of the average treatment effect — not a mere association; the design has already ruled out the pre-treatment confounding that would otherwise muddy that reading. Everything below asks one question about this one number: how big is \(3.0\) relative to what assignment luck alone could produce?
Steps
You will build the reference distribution in three moves: pool the outcomes and define the test statistic (Step 1), relabel once to see the engine turn over (Step 2), then relabel about \(10{,}000\) times and read the randomization \(p\)-value off the resulting distribution (Step 3).
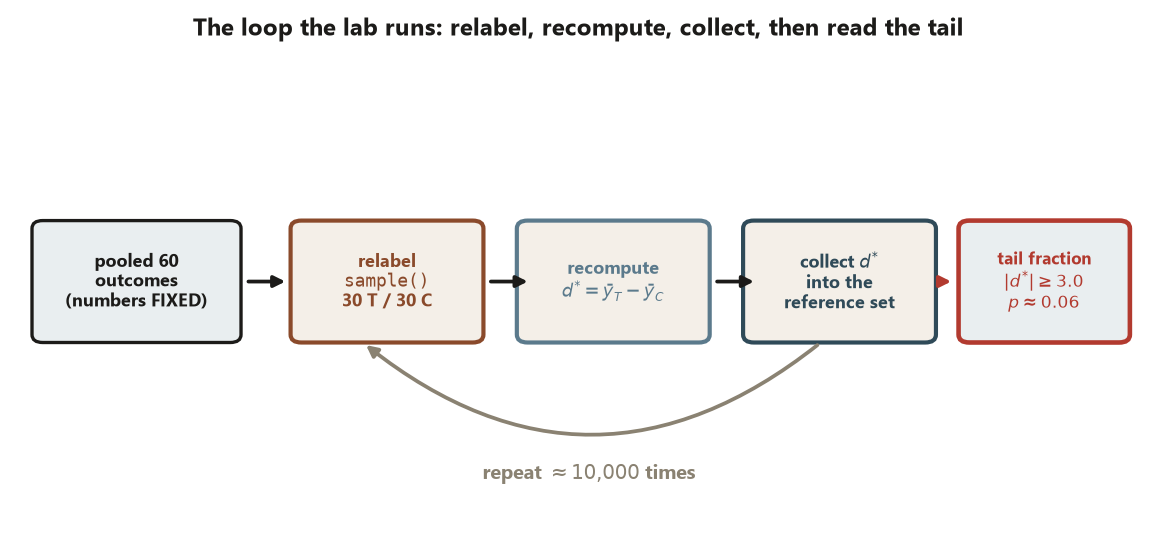
sample(), recompute the difference \(d^{*}\), and collect it into the reference set; repeat about \(10{,}000\) times, then read the fraction of collected \(d^{*}\) with \(|d^{*}| \ge 3.0\) — the randomization \(p \approx 0.06\). Synthetic; seed 45403.
Step 1 — Pool the outcomes and fix the test statistic
Under the null the labels are arbitrary, so the natural first move is to pool all 60 outcomes into one vector and decide what number you will recompute on every relabeling. That number is the same difference in means you started with — it is the test statistic.
set.seed(45403)

# Pool the 60 fixed outcomes; the labels are what will be shuffled, not the numbers.
y   <- c(y_T, y_C)                         # length 60: outcomes stay PUT
lab <- rep(c("T", "C"), each = 30)         # the ORIGINAL assignment labels

# The test statistic: difference in arm means for any labeling `g` of the pooled `y`.
diff_in_means <- function(y, g) {
  mean(y[g == "T"]) - mean(y[g == "C"])
}

d_obs <- diff_in_means(y, lab)             # recovers the observed d = 3.0 points
d_obs                                      # -> 3.0 (exact: Setup pinned the arms)
The design move here is to separate the outcomes (fixed properties of students) from the labels (the arbitrary tags assignment hands out). Pooling makes that separation literal: y holds the 60 numbers that never move, and lab holds the assignment that will be shuffled. Computing diff_in_means(y, lab) on the original labels just returns the observed \(d = 3.0\) — a sanity check that the statistic is the same one the note reports, before any shuffling begins.
Step 2 — Relabel once under the null
Now do the null’s one trick a single time: keep the 60 outcomes where they are and randomly reassign 30 “treatment” and 30 “control” tags. sample() with no size argument returns a random permutation of its input, so shuffling the label vector gives a fresh valid 30/30 split.
set.seed(45403)

# One draw from the null: the SAME 60 outcomes, a fresh random 30/30 relabeling.
lab_star <- sample(lab)                     # permute the labels; outcomes untouched
d_star   <- diff_in_means(y, lab_star)      # difference under this relabeling

table(lab_star)                             # still 30 "T" and 30 "C": a valid CRD split
d_star                                      # one value from the reference distribution
                                            #   (this seed: -0.66 — luck alone, no effect)
sample(lab) simulates one alternative random assignment that could equally well have happened under the null of no effect. Because it only reshuffles the tags, it can never create a real treatment effect — any gap it produces is pure assignment luck. The single d_star you get is one point in the reference distribution; on its own it means nothing, but ten thousand of them trace out exactly how big a difference luck alone can manufacture. Note the design discipline: you shuffle labels, never outcomes, and you keep the arm sizes at 30/30, because that is the assignment the design actually used.
Step 3 — Build the distribution and read the randomization p-value
Repeat the one-relabeling trick about \(10{,}000\) times with replicate(), collect the differences, and compare the observed \(d = 3.0\) to the whole pile. The randomization \(p\)-value is the fraction of relabeled differences at least as extreme as \(3.0\).
set.seed(45403)

# Build the randomization reference distribution: ~10,000 null relabelings.
n_perm <- 10000
perm_d <- replicate(n_perm, {
  lab_star <- sample(lab)                   # relabel under the null (outcomes fixed)
  diff_in_means(y, lab_star)                # recompute d for this relabeling
})

# Where does the observed d = 3.0 sit? Two-sided randomization p-value:
rand_p <- mean(abs(perm_d) >= abs(d_obs))   # fraction at least as extreme as 3.0
rand_p                                      # -> 0.058 with this seed (theory: 0.057)

# Quick shape check on the null distribution:
round(mean(perm_d), 2)                      # -> ~ 0.00   centered at no effect
round(sd(perm_d),   2)                      # -> ~ 1.60   just above the theoretical
                                            #    SE(d) = 1.55 — see Verify for why

# A static look at the distribution with the observed effect marked:
hist(perm_d,
     breaks = 40,
     main   = "Randomization reference distribution (Focus experiment)",
     xlab   = "Difference in mean gain (relabeled), points")
abline(v =  d_obs, lwd = 2)                 # observed d = +3.0
abline(v = -d_obs, lwd = 2, lty = 2)        # the other tail, |d| >= 3.0
The reference distribution comes out centered at about \(0\) — relabeling cannot conjure a systematic gap — with a spread (sd(perm_d) \(\approx 1.60\)) sitting just above the theoretical \(\operatorname{SE}(d) \approx 1.55\). The small excess is honest, not an error: the shuffles draw from the pooled 60 outcomes, whose spread carries the 3-point gap between the arm means on top of the within-arm SD of \(6.0\). The observed \(d = 3.0\) sits out in the tail, and the fraction of relabelings at least as extreme comes out at \(0.058\) with this seed — about \(0.06\). That is the randomization \(p\)-value: if the workshop did nothing, a difference of \(3.0\) points or larger (in either direction) would arise about \(6\%\) of the time from assignment luck alone. The two-sided form (abs(perm_d) >= abs(d_obs)) counts both tails, matching the two-sided theoretical \(p \approx 0.057\).
Read what this does and does not say. It says: the observed effect is borderline — surprising-ish, but not rare — under the no-effect null. It does not say the workshop “almost worked,” and it emphatically does not certify the design. The causal framing was already secured upstream, by the random assignment of the workshop to students; the reference distribution only sets how surprised to be by \(3.0\). A confounded study with no random assignment could hand you a tiny \(p\) from a distribution just like this one, and the small number would be describing noise inside a broken design (Risk 5).
Verify
This is the moment where the simulation and the Week 5 reasoning are supposed to meet. Check each of these against the note, and treat a mismatch as a bug in your code, not a discovery about the world — every target value is the locked, synthetic Week 5 slice.
- The observed effect is \(d = 3.0\), exactly.
diff_in_means(y, lab)from Step 1 should return \(3.0\) to the last digit, because Setup pins each arm to the locked mean and SD (the recenter and rescale lines). If you see anything else, one of those two Setup lines was skipped or edited — the rawrnorm()draws alone do not land on \(8.0\) and \(5.0\). - The null distribution is centered at \(0\).
mean(perm_d)should be near \(0.00\). A center far from zero means you shuffled the outcomes instead of the labels — relabeling alone cannot move the center. - Its spread sits just above the SE.
sd(perm_d)should be about \(1.60\) — close to, and slightly above, the \(\operatorname{SE}(d) \approx 1.55\) the note computes from \(s_p\sqrt{1/30 + 1/30}\). The excess is real and expected: the shuffles resample from the pooled 60 outcomes, whose spread includes the 3-point gap between arm means on top of the within-arm SD of \(6.0\). Randomization and theory agreeing this closely is the lesson of the week, not a coincidence to gloss over. - The randomization \(p\)-value is about \(0.06\). With the course seed,
rand_pcomes out at \(0.058\), matching the theoretical two-sided \(p \approx 0.057\); across seeds it will wobble a little around that value. If you computed a one-sided fraction (mean(perm_d >= d_obs)) you will get roughly half of it — about \(0.03\) — so be explicit about which tail count you intend. - The design claim is stated correctly. In one sentence: the workshop was assigned at random to individual students, so \(d = 3.0\) reads as a causal effect for units like these; the randomization \(p \approx 0.06\) says that effect is borderline under the null, and neither the design nor the claim generalizes to a population that was never randomly sampled. If your written conclusion uses a population verb (“undergraduates in general”) or treats the small \(p\) as proof of a good design, the reasoning — not the code — needs fixing.
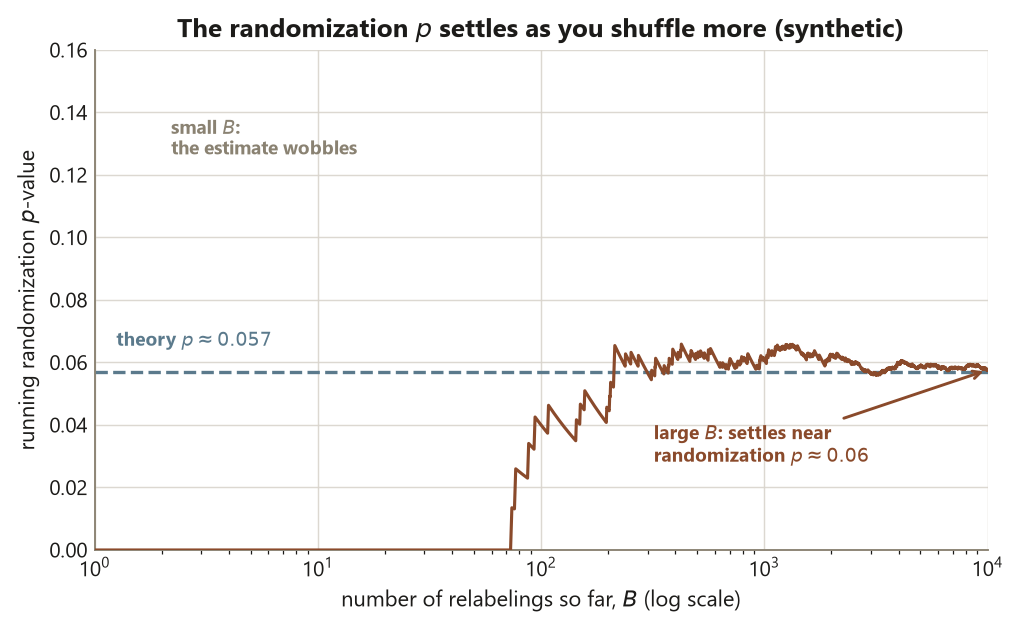
A small honest note on reproducibility: a randomization \(p\)-value is itself a simulation estimate, so across seeds or replication counts it will wobble in its last digit around \(0.06\). Increasing n_perm tightens that wobble; it does not change the design conclusion.
AI use note
If you use an AI assistant on this lab, record it briefly. The load-bearing column is Verification — how you confirmed the output yourself, against the Week 5 note and the locked numbers, rather than trusting the tool. Computation, AI-assisted or not, does not rescue a weak design or certify a number.
| Tool | Purpose | Verification |
|---|---|---|
| LLM chat assistant | Explain why sample(lab) permutes labels without touching outcomes |
Re-ran Step 2 and confirmed table(lab_star) stayed 30/30 with the 60 outcomes unchanged; reconciled the explanation against the Week 5 note’s account of relabeling under the null |
| LLM chat assistant | Suggest the two-sided vs one-sided form of the randomization p-value | Computed both mean(abs(perm_d) >= abs(d_obs)) and mean(perm_d >= d_obs), confirmed the two-sided value (~0.06) matches the note’s \(p \approx 0.057\), and stated which tail count I used |
| Code formatter / linter | Tidy the replicate() block for readability |
Diffed before/after to confirm only whitespace changed; re-ran to confirm rand_p still landed near 0.06 |
See also
- Week 5 — Completely randomized experiments — the companion note: why random assignment, not the p-value, licenses the causal reading.
- Week 6 — Blocking and paired designs — same effect \(d = 3.0\), a sharper estimate by removing nuisance variation.
- Lab 6 — Blocking versus complete randomization — watch the standard error shrink when you block, with the effect held fixed.
- Design glossary — CRD, difference in means, standard error, randomization reference distribution, p-value.
- Design reference — the design families side by side.
The graded deliverable, its rubric, and due date live in Blackboard (the LMS) — this page is study and practice only.