Week 6 — Blocking and paired designs
Sharpening the same effect by removing nuisance variation
The week question
Last week you randomized 60 students into the Focus study-skills experiment and got a real causal effect — \(d = 3.0\) points of gain — but a borderline result (\(\operatorname{SE} \approx 1.55\), \(p \approx 0.057\)). This week asks a narrower, sharper question: can you keep the same design and the same effect, yet measure it more precisely? The answer is yes, and the lever is design, not more data and not a fancier test. You remove a known, pre-treatment source of noise from the comparison — by blocking (a randomized complete block design) or by pairing — so the difference you care about stands out against a quieter background. The effect does not get bigger; your view of it gets clearer.
Why this matters
A weak signal is sometimes a small effect and sometimes a noisy measurement of an honest effect. Telling those apart is a design problem, not a p-value problem. In the Focus experiment the effect is genuinely \(d = 3.0\) — randomization earned that causal reading in Week 5 — but students vary a lot at baseline, and that between-student variation inflates the standard error. Blocking and pairing are the two classic ways to subtract that nuisance variation before it ever enters the comparison. The slogan to carry all term is “block what you can, randomize what you cannot.” You arrange units into similar groups on a variable you can see and control (the block), randomize within each group, and let randomization handle everything you cannot foresee. The payoff is precision — a smaller standard error and a tighter interval around the same estimand. The trap, and the reason this week has its own named risk, is that the variation you remove must be pre-treatment: if you block or pair on something the treatment itself changed, you no longer have an honest experiment.
Learning goals
By the end of this week you should be able to:
- Explain why a randomized complete block design (RCBD) and a paired design lower the standard error of an effect without changing the effect itself, and say in words what variation each one removes.
- Compute and compare the standard error of the difference in means under complete randomization, under blocking, and under pairing for the Focus experiment, and read each \(t\) and \(p\)-value back to the design.
- State the rule that a blocking or pairing variable must be pre-treatment, and recognize the failure mode (Risk 14) of blocking on a post-treatment variable.
- Transfer the pairing idea to a new within-subject comparison and name what was sampled, what was assigned, and what nuisance variation pairing removed.
Core vocabulary
- Nuisance variation — variation in the outcome \(Y\) that is real but not of interest (here, baseline differences between students). It widens \(\operatorname{SE}(d)\) and hides the effect; design removes it.
- Block — a group of units that are similar on a chosen pre-treatment variable (a prior-performance tier). Treatments are randomized within each block.
- Randomized complete block design (RCBD) — every treatment level appears within every block, with random assignment inside each block. It removes between-block variation from the residual.
- Paired / matched design — the extreme block of size two (or a single unit measured twice). Each pair contributes one difference, so all stable between-unit variation cancels.
- Paired difference \(d_i = Y_i(\text{treat}) - Y_i(\text{control})\) within pair \(i\); the estimate is the mean paired difference \(\bar d\), with \(\operatorname{SE} = s_d / \sqrt{n}\) where \(s_d\) is the SD of the differences and \(n\) is the number of pairs (the unit of analysis is now the pair, not the student).
- Pre-treatment vs post-treatment — measured before assignment vs after (and possibly caused by it). Only pre-treatment variables are safe to block or pair on.
Concept development
Same effect, smaller noise: what variance reduction does and does not do
Start from the completely randomized design (CRD) of Week 5. With \(n = 60\) split 30/30, pooled SD \(s_p \approx 6.0\), the standard error of the difference is
\[ \operatorname{SE}(d) = s_p \sqrt{\tfrac{1}{n_T} + \tfrac{1}{n_C}} = 6.0 \sqrt{\tfrac{1}{30} + \tfrac{1}{30}} \approx 1.55 , \]
giving \(t = 3.0 / 1.55 \approx 1.94\) and \(p \approx 0.057\). That \(6.0\) is doing two jobs at once: it carries the genuine, irreducible spread of how individual students respond, and the stale, between-student spread that was there before anyone touched a workshop. Blocking and pairing target only the second job. They do not shrink the effect — the numerator \(d = 3.0\) never moves — they shrink the SD that sits in the denominator. The estimand is untouched; the estimate is the same number reported with more confidence. This is the single most important sentence of the week: precision, not a bigger effect. Anyone who reads the smaller \(p\)-value as “the workshop got stronger” has misread the design.
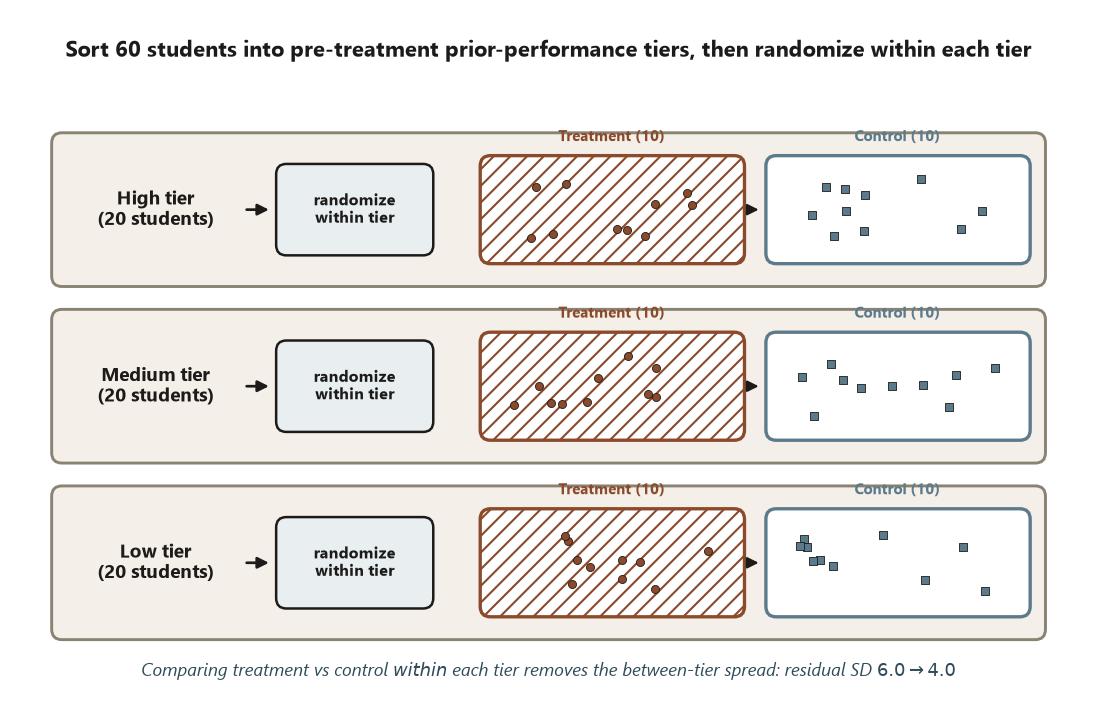
Blocking: a randomized complete block design on prior-performance tier
Students enter with different prior performance, and prior performance predicts the gain score. So sort the 60 students into three pre-treatment tiers — low, medium, high — and randomize treatment vs control within each tier. Every tier (block) contains both conditions, so when you compare treatment to control you are always comparing students who started in the same tier. The between-tier differences — the big, lumpy part of the \(6.0\) — are differenced out of the residual. For the Focus experiment that drops the residual SD from \(6.0\) to about \(4.0\):
\[ \operatorname{SE}(d \mid \text{blocked}) = 4.0 \sqrt{\tfrac{1}{30} + \tfrac{1}{30}} \approx 1.03 , \qquad t = \frac{3.0}{1.03} \approx 2.90, \qquad p \approx 0.005 . \]
The effect is still \(d = 3.0\). What changed is that the borderline \(p \approx 0.057\) became a clear \(p \approx 0.005\) purely because the design removed a known nuisance. That is “block what you can”: the tier was visible and controllable, so you controlled it by design rather than hoping randomization would balance it. You still randomize within tiers because there is plenty you cannot foresee — that is “randomize what you cannot.”
Pairing: the block of size two
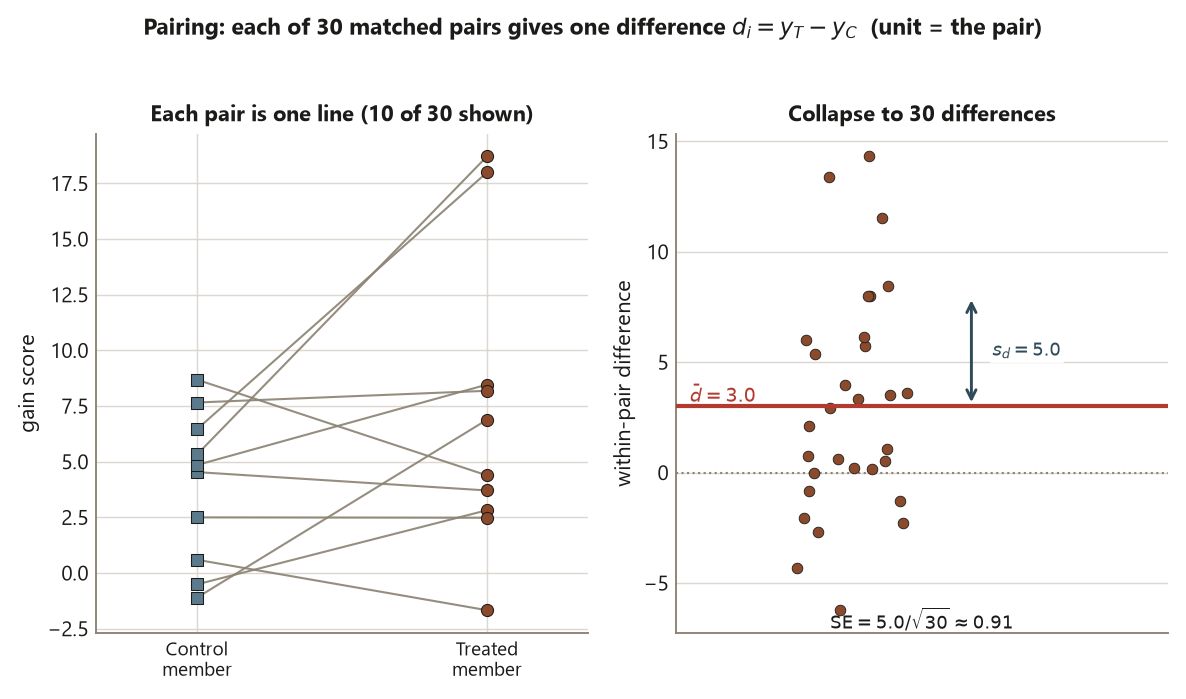
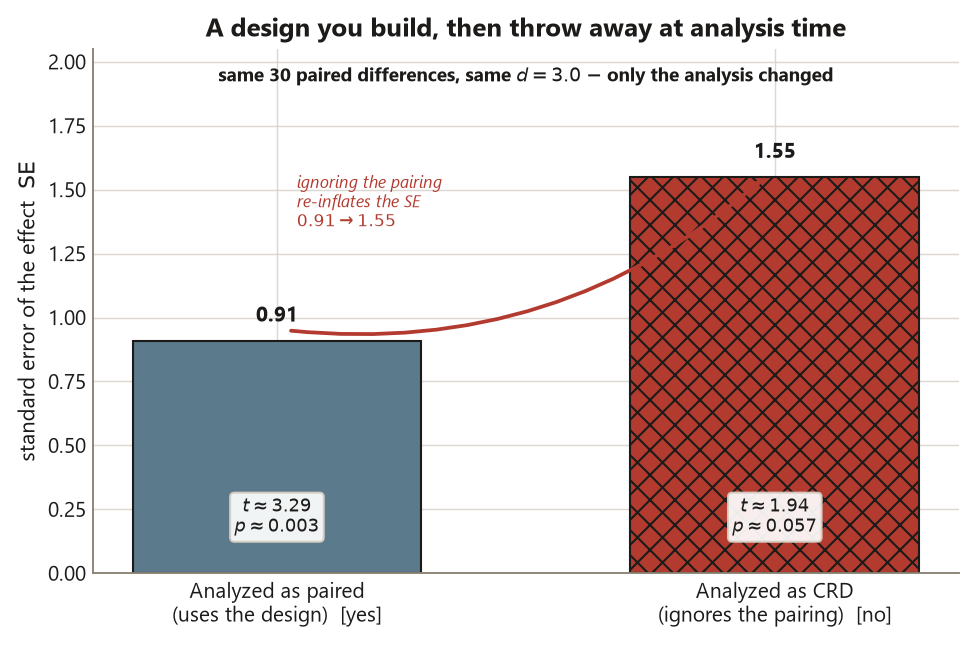
Pairing is blocking taken to its limit. Instead of three tiers, form 30 matched pairs of closely similar students (or, equivalently, measure each student before and after, so a student is paired with themselves). Within each pair, one unit is treated and one is control, and you record a single difference. Because the two members of a pair are so alike, nearly all stable between-subject variation cancels inside the difference, leaving only the within-pair spread. With mean paired difference \(\bar d = 3.0\) and SD of the differences \(s_d = 5.0\) over \(n = 30\) pairs,
\[ \operatorname{SE} = \frac{s_d}{\sqrt{n}} = \frac{5.0}{\sqrt{30}} \approx 0.91 , \qquad t = \frac{3.0}{0.91} \approx 3.29, \qquad p \approx 0.003 . \]
The effect is still \(d = 3.0\), now with the tightest SE of the three designs. The unit of analysis has moved from the student to the pair: there are 30 differences, not 60 observations, and analyzing pairs as if they were 60 independent students would be the wrong grain (Risk 3). Pairing buys precision when the paired units really are similar; if matching is loose, \(s_d\) is large and the advantage shrinks.
The pre-treatment rule, and why it is the whole game
Both moves work by removing variation that was present before assignment. That is non-negotiable. The block (prior-performance tier) and the matching variable must be pre-treatment — fixed before any student saw the workshop — so that differencing them out cannot remove any of the treatment’s own effect. If you instead block or pair on something measured after assignment, something the treatment may have changed, you are no longer running an honest experiment: you may subtract away a slice of the very effect you are trying to estimate, and the causal reading randomization gave you in Week 5 is gone. That failure mode is this week’s named trap, and it gets its own section below.
Worked examples
Worked example — the Focus experiment across three designs (recurring slice)
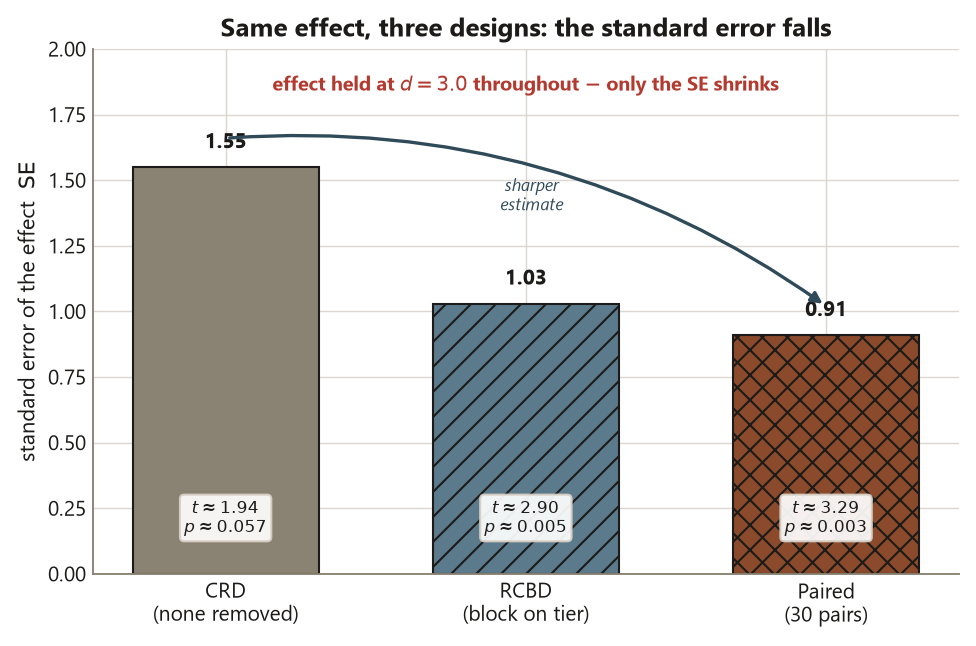
Use the locked Focus numbers. The effect is held at \(d = 3.0\) throughout; only the denominator changes.
| Design | What variation is removed | Residual / paired SD | \(\operatorname{SE}\) | \(t = 3.0 / \operatorname{SE}\) | \(p\) (two-sided) |
|---|---|---|---|---|---|
| CRD (Week 5) | none by design | \(s_p = 6.0\) | \(\approx 1.55\) | \(\approx 1.94\) | \(\approx 0.057\) |
| RCBD (blocked on tier) | between-tier | \(\approx 4.0\) | \(\approx 1.03\) | \(\approx 2.90\) | \(\approx 0.005\) |
| Paired (30 pairs) | between-subject | \(s_d = 5.0\) | \(\approx 0.91\) | \(\approx 3.29\) | \(\approx 0.003\) |
Here is the static computation. The data are synthetic; seed set. This block is shown as teaching, not executed in this diagnostic.
set.seed(45403)

# Focus experiment — effect held at d = 3.0 across three designs.
# What changes is the noise in the denominator, never the numerator.
d <- 3.0          # observed effect: treatment mean gain 8.0 - control mean gain 5.0
n_T <- 30; n_C <- 30

# --- CRD (Week 5): nothing removed by design ---
s_p <- 6.0
se_crd <- s_p * sqrt(1/n_T + 1/n_C)        # ~1.55
t_crd  <- d / se_crd                        # ~1.94  -> p ~ 0.057 (borderline)

# --- RCBD: block on PRE-treatment prior-performance tier (low/med/high) ---
# Differencing out between-tier variation drops the residual SD 6.0 -> 4.0.
s_block <- 4.0
se_block <- s_block * sqrt(1/n_T + 1/n_C)   # ~1.03
t_block  <- d / se_block                     # ~2.90  -> p ~ 0.005

# --- Paired: 30 matched pairs; analyze the 30 differences (unit = pair) ---
n_pairs <- 30
s_d <- 5.0                                   # SD of the within-pair differences
se_pair <- s_d / sqrt(n_pairs)               # ~0.91
t_pair  <- d / se_pair                       # ~3.29  -> p ~ 0.003

# se_crd ~ 1.55  >  se_block ~ 1.03  >  se_pair ~ 0.91 ; d stays 3.0 throughout
Interpretation. Across all three rows the workshop’s causal effect is the same \(d = 3.0\) points — random assignment (not the test, not the blocking) is what licenses calling it causal, exactly as in Week 5. Blocking on the pre-treatment tier removed between-tier nuisance and cut the SE from \(1.55\) to \(1.03\), turning the borderline \(p \approx 0.057\) into \(p \approx 0.005\). Pairing removed between-subject nuisance and cut the SE further to \(0.91\) (\(p \approx 0.003\)), with the unit of analysis now the pair. None of this is a stronger treatment; it is a quieter measurement of the same treatment. The smaller \(p\)-values describe the design’s precision, never the design’s strength — a confounded study with \(p = 0.003\) would still be confounded.
Worked example — a within-subject taste test (transfer; illustrative numbers)
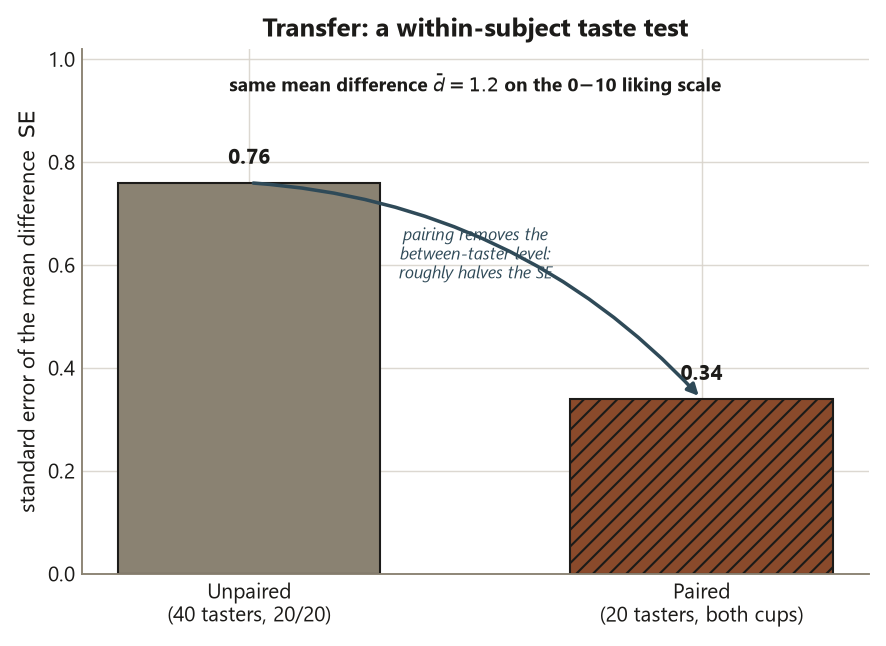
A small campus dining study compares a reformulated trail mix (treatment) against the current recipe (control) on a 0–10 liking rating. Run it two ways. In an unpaired version, 40 tasters are randomly assigned, 20 to each recipe, and you compare group means. People simply differ in how generous their ratings are, so that person-to-person spread inflates the SE — suppose \(s_p \approx 2.4\), giving \(\operatorname{SE} \approx 2.4\sqrt{1/20 + 1/20} \approx 0.76\). In a paired version, each of 20 tasters rates both recipes in a randomized order, and you keep each taster’s difference in liking. Because a generous rater is generous on both cups, that personal level cancels inside the difference. Suppose the mean paired difference is \(\bar d = 1.2\) points with \(s_d \approx 1.5\) over \(n = 20\) pairs; then
\[ \operatorname{SE} = \frac{s_d}{\sqrt{n}} = \frac{1.5}{\sqrt{20}} \approx 0.34 . \]
set.seed(45403)

# Transfer: within-subject taste test (illustrative numbers, distinct from Focus).
# Same logic — pairing each taster with themselves removes the person's rating level.
n_pairs <- 20
d_bar <- 1.2          # mean paired difference in liking (treatment - control)
s_d   <- 1.5          # SD of the within-taster differences
se_paired <- s_d / sqrt(n_pairs)             # ~0.34

s_p <- 2.4            # unpaired pooled SD across people
se_unpaired <- s_p * sqrt(1/20 + 1/20)       # ~0.76  (roughly double the paired SE)
Interpretation. What was sampled is the set of tasters; what was assigned (and randomized) is which recipe came first within each person. Pairing each taster with themselves removed the between-person nuisance — the personal rating level that is the same on both cups — and roughly halved the SE, from about \(0.76\) to about \(0.34\), on the same mean difference of \(1.2\). The matching variable here is the taster’s own identity, which is as pre-treatment as it gets. As in the Focus study, pairing sharpened the estimate without changing it; the claim is a causal one about the recipe (random assignment of order, within taster), bounded to this taster pool.
A common mistake
Blocking or pairing on a post-treatment variable (Risk 14). The temptation is to block on whatever predicts the outcome best — and after the workshop runs, the variable that predicts gain best might be something measured after assignment, like “minutes of practice the student logged during the workshop.” Block or pair on that and you are subtracting out variation the treatment itself produced: practice minutes are partly caused by being in the Focus condition, so they sit on the causal path, not before it. Differencing them away removes a slice of the effect you came to measure, and the honest causal reading that random assignment bought you in Week 5 quietly disappears. The fix is the rule of the week: the blocking or pairing variable must be pre-treatment — prior-performance tier, baseline score, matched-pair identity, anything fixed before assignment. A quick self-test: could this variable have been recorded before you assigned treatment? If not, do not block or pair on it. And remember the other half: even a correct, pre-treatment block changes only the SE, never the effect. If your “blocking” appears to move \(d\) away from \(3.0\), you have not blocked — you have biased.
Low-stakes self-checks (ungraded)
These are for your own practice. They are ungraded, with no points and no due date.
- In one sentence, say what stays the same and what changes when the Focus experiment goes from CRD to RCBD. (Aim: \(d = 3.0\) stays; the SE drops from \(\approx 1.55\) to \(\approx 1.03\).)
- The paired design reports \(n = 30\). Thirty what? Name the unit of analysis and why analyzing 60 observations instead would be the wrong grain.
- A classmate says the blocked result (\(p \approx 0.005\)) “proves the workshop works better than the CRD result suggested.” Correct the claim using the words precision and effect.
- Give one pre-treatment variable you could legitimately block on in the Focus experiment, and one post-treatment variable you must not — and say which risk the second one triggers.
- In the taste test, the unpaired SE was about \(0.76\) and the paired SE about \(0.34\) on the same difference of \(1.2\). What variation did pairing remove, and what was randomized within each taster?
Reading and source pointer
For this week, read the experiments material on blocking and matching in Introduction to Modern Statistics (Çetinkaya-Rundel & Hardin) — the sections that introduce randomized block designs and matched/paired comparisons as ways to control nuisance variation. The reference-distribution and simulation posture used in the companion lab is grounded in Statistical Inference via Data Science (ModernDive). These notes are the course’s own synthesis, grounded in but not copied from the sources.
Public vs. graded
These notes, the examples, and the practice here are public and ungraded — study material only. No graded prompts, answer keys, rubrics, point values, or due dates appear on this site. Graded design checkpoints, weekly quizzes, design memos and homework, applied design labs, the midterm, the final design project, and the final exam live in Blackboard (the LMS), which is authoritative for due dates, submissions, and grades. If this page and Blackboard ever disagree, follow Blackboard.
Looking ahead
Next week you keep one design and add a second factor. In factorial experiments you cross the Focus workshop (Factor A) with peer tutoring (Factor B) in one 2×2 design, so a single experiment estimates two main effects at once — and sets up the interaction question that follows. The blocking and pairing instincts from this week carry over: you will still want to remove nuisance variation, but now inside a richer design.