Week 12 — Categorical outcomes & contingency tables
Counts, proportions, and association — without overclaiming
The week question
For eleven weeks your response variable has been a number — a readiness score, a final exam score, a wait, a price. You compared its mean across groups, modeled it on a covariate, adjusted it. This week the response stops being a number and becomes a category. In Dataset R every student either passed or failed the redesigned quantitative-reasoning course, and each student used one of three support programs — None, Drop-in, or Structured. The data are no longer a column of scores you can average; they are counts in a table: how many passed and how many failed in each program.
The question changes shape with the data. You can no longer ask “is the mean higher?” because there is no mean to take — pass and fail are labels, not quantities. Instead you ask: does the pass rate depend on which support program a student used, and if so, by how much? That is two questions wearing one coat, and keeping them apart is the whole week. The first — does pass depend on program at all? — is a question about association, and the chi-square test answers it. The second — by how much? — is a question about effect size, and a chi-square statistic cannot answer it; you need a risk difference, a relative risk, or an odds ratio. The week’s question is therefore: how do you test whether a categorical outcome is associated with a grouping variable, how do you measure the size of that association, and what does an observational table license you to conclude?
Why this matters
Categorical outcomes are everywhere applied statistics actually lives. Did the patient recover or not? Did the customer churn or stay? Did the student pass or fail? These are the questions stakeholders ask, and they all share the same structure: a count of yes/no outcomes broken down by some grouping variable. The contingency table is the natural home for that structure, and the methods of this week are the standard toolkit for reading one.
It matters most because a contingency table tempts two opposite mistakes, and you have to resist both. The first temptation is to stop at the p-value: run a chi-square, see \(p \approx 0.024\), declare “the programs differ significantly,” and move on. But a significant chi-square tells you only that pass and program are associated — it says nothing about how large the association is or which program helps. A test of association is not a measure of magnitude. The course’s first recurring discipline — report the estimate with its uncertainty, not just a verdict — is exactly what a bare chi-square violates, so this week you pair every test with an effect measure.
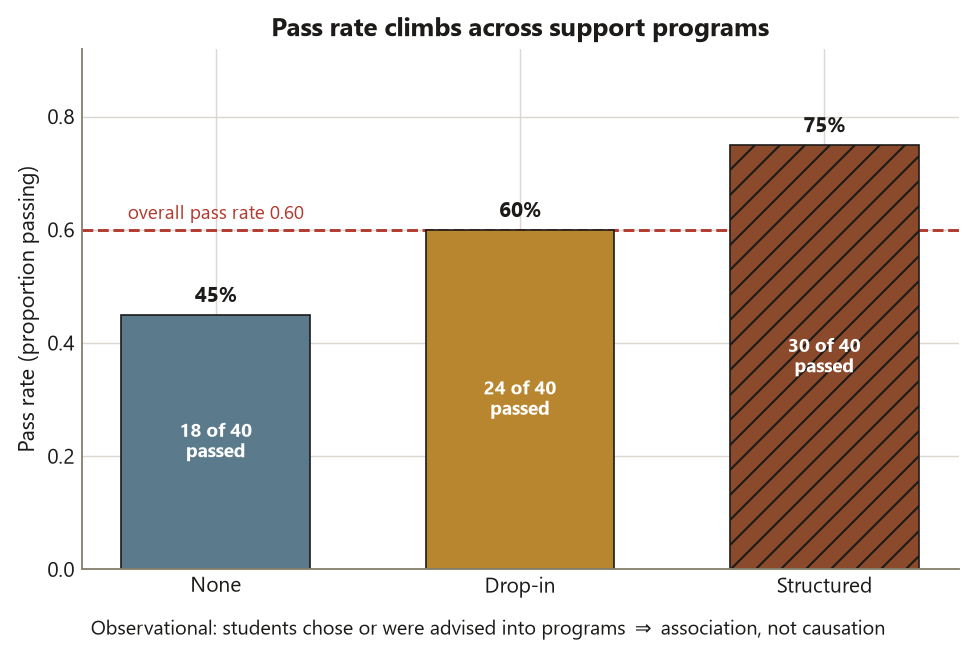
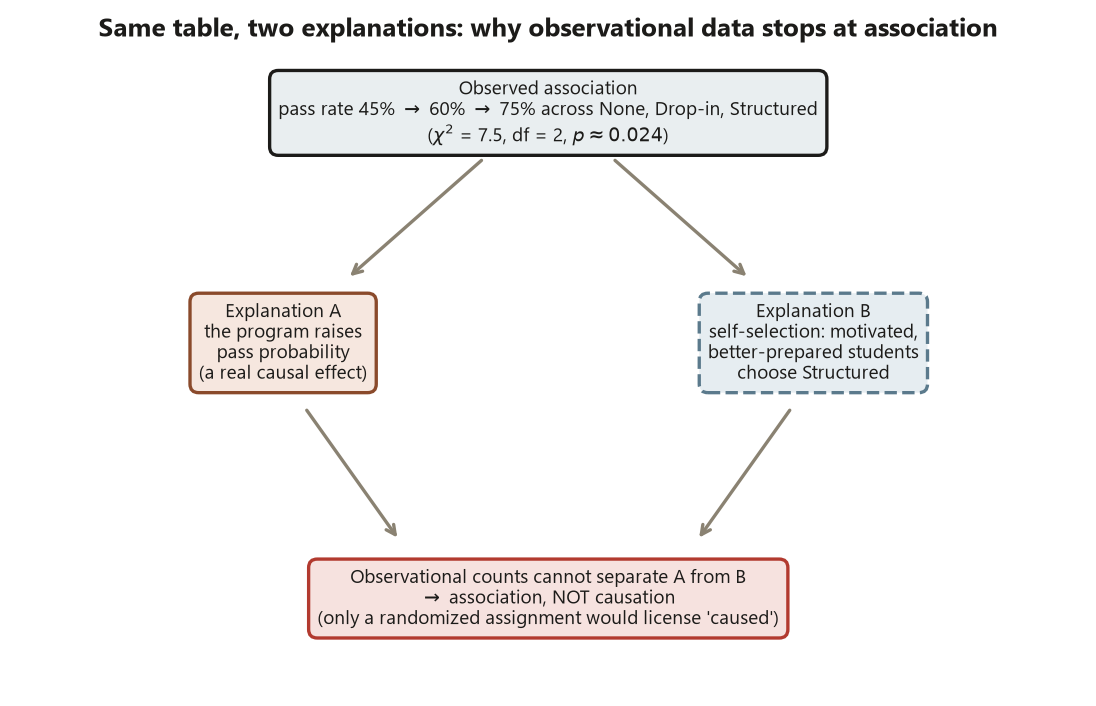
The second temptation is causal. The Structured-program students passed at \(75\%\) and the no-program students at \(45\%\) — a \(30\)-percentage-point gap that begs to be read as “the Structured program works.” But students chose their programs (or were steered into them), so the motivated, better-prepared students may have selected the more demanding program. That is self-selection, the same confounding you met in regression and ANCOVA, and it means this table buys association, not causation. The course’s second recurring discipline — keep statistical significance, practical significance, and causation distinct — is sharpest here, because the numbers are so vivid and the causal story so easy to tell. The discipline is to tell it honestly: a real, sizeable, statistically significant association, which observational data cannot promote to a cause.
Learning goals
By the end of this week you should be able to:
- Build a contingency table from two categorical variables and read it both as raw counts and as conditional proportions (row pass rates) — for Dataset R, the \(3\times 2\) table of pass/fail by program with rates \(45\%\), \(60\%\), \(75\%\).
- Compute expected counts under independence and state the rule for when the chi-square test is valid — here every expected pass count is \(24\) and every expected fail count is \(16\), all comfortably \(\ge 5\).
- Run and interpret the chi-square test of independence — \(\chi^2 \approx 7.5\) on \(2\) degrees of freedom, \(p \approx 0.024\) — as a test of association, not of magnitude or direction.
- Compute and interpret the three standard effect measures for a \(2\times 2\) comparison — the risk difference (\(0.30\)), the relative risk (\(\approx 1.67\)), and the odds ratio (\(\approx 3.67\)) for Structured vs None — and explain why the odds ratio is not the relative risk.
- Apply the blueprint’s last step to a table: separate statistical significance (the chi-square is small-\(p\)) from practical significance (a \(30\)-point pass-rate gap is large) from causation (self-selection means the table licenses association, not causation).
Core vocabulary
- Categorical (nominal) outcome — a response that records a category, not a quantity. Here the outcome is binary:
pass\(\in\) {pass, fail}. You count outcomes; you do not average them. - Contingency table — a table of counts cross-classifying two categorical variables, here a \(3\times 2\) table (three programs \(\times\) pass/fail). The cells are observed counts; the margins are the row and column totals.
- Conditional proportion / row pass rate — within a program, the fraction that passed, e.g. \(18/40 = 0.45\) for None. These conditional proportions are what you actually compare; the raw counts alone can mislead when group sizes differ.
- Independence (no association) — the null hypothesis that the pass rate is the same across programs, so knowing a student’s program tells you nothing about their pass probability. The chi-square test asks whether the data are compatible with this.
- Expected count — the count a cell would show if independence held exactly, computed as \(E = \dfrac{(\text{row total})(\text{column total})}{\text{grand total}}\). The chi-square compares observed to expected.
- Chi-square statistic — \(\chi^2 = \sum \dfrac{(O - E)^2}{E}\), summed over all cells; it measures the total squared discrepancy between observed and expected counts, scaled by what is expected. Large \(\chi^2 \Rightarrow\) observed counts are far from independence.
- Degrees of freedom — for an \(r\times c\) table, \((r-1)(c-1)\); here \((3-1)(2-1) = 2\). It sets the reference distribution the statistic is read against.
- Risk (probability) of an event — the conditional probability of the outcome in a group, e.g. risk of passing under Structured \(= 0.75\). “Risk” is the epidemiology word for a proportion; it need not be a bad event.
- Risk difference — one risk minus another, \(p_1 - p_2\); an absolute comparison on the probability scale (here \(0.75 - 0.45 = 0.30\)).
- Relative risk (risk ratio) — one risk divided by another, \(p_1/p_2\); a multiplicative comparison (here \(0.75/0.45 \approx 1.67\)).
- Odds and odds ratio — the odds of an event are \(p/(1-p)\); the odds ratio is one group’s odds divided by another’s. The odds ratio is not the relative risk and is usually farther from \(1\).
Concept development
Contingency tables and expected counts under independence
Walk the blueprint. The question is “does passing depend on support program?” — a comparison question about a categorical outcome. The structure: the unit is a student (\(40\) per program, \(N = 120\)); the response pass is binary; the explanatory/grouping variable program is categorical with three levels; the design is observational (students were not randomly assigned to programs). One categorical response, one categorical grouping variable, counts in the cells — that structure is exactly what a contingency table and the chi-square test of independence are for, so that is the method.
Start by laying out the observed counts. Dataset R gives the \(3\times 2\) table (data synthetic; seed set):
| Program | Pass | Fail | Total | Pass rate |
|---|---|---|---|---|
| None | \(18\) | \(22\) | \(40\) | \(0.45\) |
| Drop-in | \(24\) | \(16\) | \(40\) | \(0.60\) |
| Structured | \(30\) | \(10\) | \(40\) | \(0.75\) |
| Total | \(72\) | \(48\) | \(120\) | \(0.60\) |
Read the row pass rates first — they are the conditional proportions that answer the question. \(45\%\) of the None group passed, \(60\%\) of the Drop-in group, \(75\%\) of the Structured group. The pass rate climbs across the programs, which is the pattern the rest of the week quantifies. (Here the groups are equal-sized at \(40\) each, so the raw counts and the rates tell the same story; when group sizes differ, always convert to rates before comparing — the counts alone mislead.)
Now ask what the table would look like if program made no difference — the null of independence. Under independence the pass rate in every program equals the overall pass rate, \(72/120 = 0.60\). So each program’s expected pass count is
\[ E_{\text{pass}} = \frac{(\text{row total})(\text{column total})}{\text{grand total}} = \frac{40 \cdot 72}{120} = 24, \]
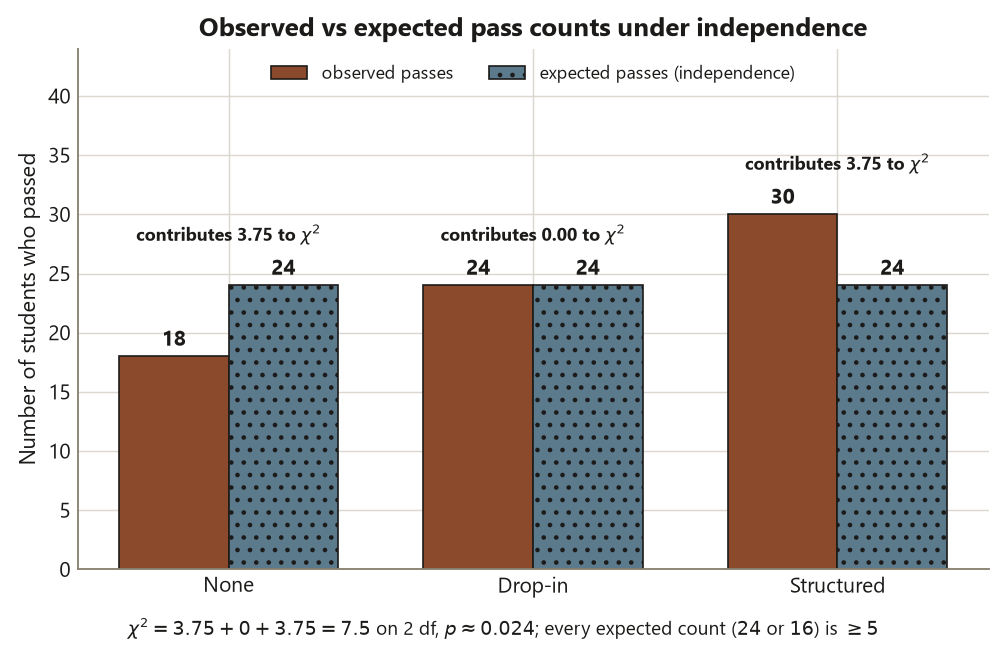
and each expected fail count is \(40 \cdot 48/120 = 16\). Every program shares the same expected pair \((24, 16)\) because the rows are equal-sized. The observed counts depart from this: None has \(18\) passes where \(24\) are expected (six short), Structured has \(30\) where \(24\) are expected (six over). The chi-square test turns those departures into a single number.
One validity gate must be checked before you trust the chi-square reference distribution: the expected counts must be large enough, the usual rule of thumb being every expected count \(\ge 5\). Here the smallest expected count is \(16\), far above \(5\), so the chi-square approximation is sound. If some expected count were small (a sparse cell), the chi-square \(p\)-value would be unreliable and you would switch to Fisher’s exact test. Note carefully: it is the expected counts, not the observed ones, that the rule governs — an observed zero is fine if its expected count clears \(5\).
The chi-square test of independence: a test of association, not magnitude
With the validity gate cleared, assemble the statistic. The chi-square compares each observed count to its expected count, squares the gap, scales by the expected count, and sums:
\[ \chi^2 = \sum_{\text{cells}} \frac{(O - E)^2}{E}. \]
For Dataset R the only programs that depart from expectation are None (short on passes) and Structured (over on passes); Drop-in sits exactly at its expected \(24/16\) and contributes nothing. Working the pass column, None contributes \((18-24)^2/24 = 36/24 = 1.5\) and Structured contributes \((30-24)^2/24 = 1.5\); the fail column contributes the same again because the fail gaps mirror the pass gaps over a base of \(16\) (\((22-16)^2/16 = 36/16 = 2.25\) for None, and \(2.25\) for Structured). Summing the contributing cells gives
\[ \chi^2 = \underbrace{1.5 + 2.25}_{\text{None}} + \underbrace{0 + 0}_{\text{Drop-in}} + \underbrace{1.5 + 2.25}_{\text{Structured}} = 3.75 + 0 + 3.75 \approx 7.5, \]
on \((3-1)(2-1) = 2\) degrees of freedom. Read against the \(\chi^2_2\) distribution, this gives \(p \approx 0.024\).
Interpret it precisely, because this is where the week’s first discipline bites. A \(p\)-value of \(0.024\) means: if pass and program were truly independent, a table this far from the expected counts would arise only about \(2.4\%\) of the time by sampling variation alone. That is evidence against independence — the pass rate does appear to depend on program. But notice what the chi-square does not tell you. It does not say how big the association is — a tiny, useless difference in a huge sample can produce a small \(p\), and a large, important difference in a small sample can fail to. It does not say which program is best — the statistic pools all the departures into one number and is direction-blind. And it does not say why — association is not causation. The chi-square answers one narrow question, “is there an association at all?”, and answers it well; the magnitude and the direction are separate jobs for the effect measures, next.
Effect measures beyond the p-value, and the observational caveat
A significant chi-square is the start of the analysis, not the end. To say how much passing depends on program, pick a pair of groups and a scale. Compare Structured vs None — the two ends of the gradient — and read the three standard effect measures, each answering “how much?” in a different way.
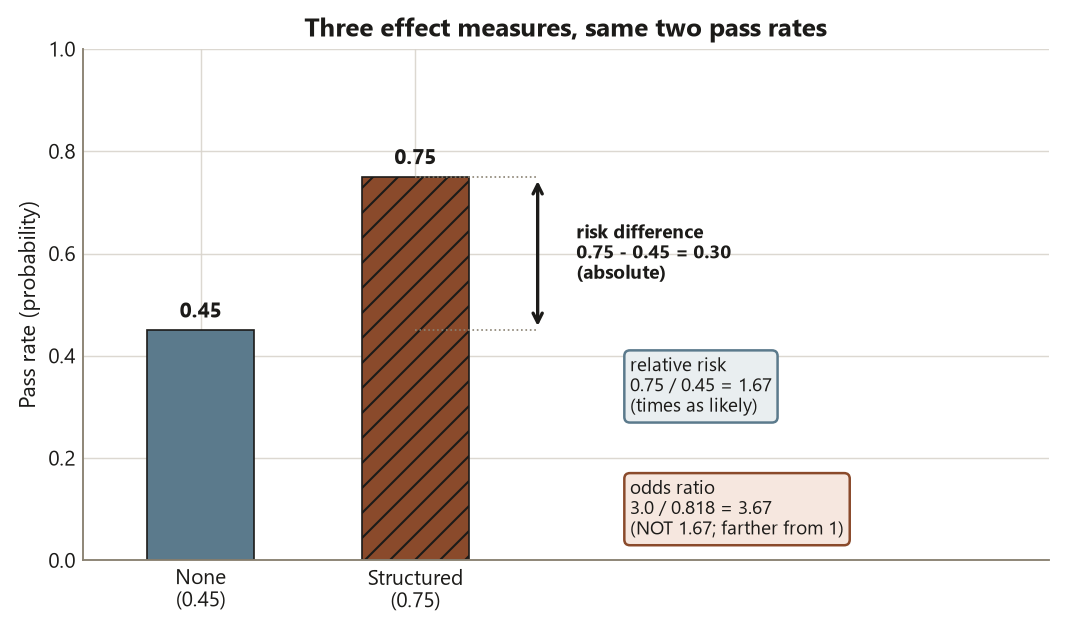
The risk difference is the absolute gap in pass probability:
\[ \text{RD} = p_{\text{Struct}} - p_{\text{None}} = 0.75 - 0.45 = 0.30. \]
Structured students passed at a rate \(30\) percentage points higher than None students. The risk difference is the most directly interpretable measure — “\(30\) more students per hundred pass” — and the one most readers grasp immediately.
The relative risk (risk ratio) is the multiplicative comparison:
\[ \text{RR} = \frac{p_{\text{Struct}}}{p_{\text{None}}} = \frac{0.75}{0.45} \approx 1.67. \]
Structured students were about \(1.67\) times as likely to pass as None students — a \(67\%\) higher pass rate. Relative risk is natural when you think in “times as likely,” but it can exaggerate when the baseline risk is small, so report it alongside the absolute risk difference, never alone.
The odds ratio compares the odds rather than the probabilities. The odds of passing are \(p/(1-p)\): for Structured, \(0.75/0.25 = 3.0\); for None, \(0.45/0.55 \approx 0.818\). So
\[ \text{OR} = \frac{\text{odds}_{\text{Struct}}}{\text{odds}_{\text{None}}} = \frac{3.0}{0.818} \approx 3.67. \]
The odds of passing are about \(3.67\) times higher under Structured than under None. Here is the trap the week names explicitly: the odds ratio \(3.67\) is not the relative risk \(1.67\), and it is much larger. The odds ratio always sits farther from \(1\) than the relative risk (more so when the outcome is common, as a \(60\%\) pass rate is), so reporting an odds ratio as if it were a “times as likely” statement overstates the effect. The odds ratio earns its keep in logistic regression next week — it is the natural currency there and survives adjustment cleanly — but as a plain-English effect size, the risk difference and relative risk are easier to read honestly. Whichever you report, say which one it is.
Then close with the blueprint’s sixth step, the observational caveat. Every effect measure above is large — a \(30\)-point gap, a \(1.67\times\) rate, a \(3.67\)-fold odds — and the chi-square says the association is statistically significant. But students self-selected into programs (or were advised into them by people who saw their preparation), so the Structured group may be more motivated and better prepared before any program effect. That confounding means the table buys association, not causation: you cannot conclude from these counts that assigning a random student to the Structured program would raise their pass probability by \(30\) points. To license that causal claim you would need a randomized assignment — which is exactly what the transfer example below contrasts. Keep the three readings distinct: statistically significant (\(p \approx 0.024\)), practically large (a \(30\)-point gap), and not causal (self-selection unaddressed).
Worked examples
Worked example — Dataset R: the pass-by-program table, end to end (recurring slice)
The question and structure. Does passing the redesigned course depend on which support program a student used, and how large is the difference? The unit is a student (\(40\) per program, \(N = 120\)); the response pass is binary; the grouping variable program is categorical with three levels; the design is observational (students chose or were advised into programs). Data are synthetic; seed set (set.seed(35203)).
The assumptions. The chi-square test of independence assumes independent observations (different students — holds here) and expected counts large enough that the chi-square approximation is good. Every expected count is \(24\) or \(16\), all \(\ge 5\), so the test is valid; no exact test is needed.
The computation. Build the table, run the chi-square, then convert to risks, relative risk, and an odds ratio for the Structured-vs-None contrast. The static R below shows the idiom; it is teaching code and is not executed here.
set.seed(35203)

# Dataset R: n = 120 students, pass = (final >= 70), program in {None, Drop-in, Structured}.
# Synthetic. Build the 3 x 2 contingency table of program (rows) by pass (cols).

tab <- table(program, pass)
tab
#            pass
# program     fail pass
#   None        22   18
#   Drop-in     16   24
#   Structured  10   30

# --- Row pass rates (the conditional proportions you actually compare) -------
prop.table(tab, margin = 1)
#            pass
# program       fail  pass
#   None        0.55  0.45
#   Drop-in     0.40  0.60
#   Structured  0.25  0.75

# --- Chi-square test of independence ----------------------------------------
chisq.test(tab)
#   X-squared = 7.5, df = 2, p-value = 0.024     # association: pass depends on program
chisq.test(tab)$expected
#            pass
# program     fail pass
#   None        16   24                          # all expected counts >= 5  ->  chi-square valid
#   Drop-in     16   24
#   Structured  16   24

# --- Effect measures: Structured vs None ------------------------------------
p_struct <- 30 / 40                              # 0.75
p_none   <- 18 / 40                              # 0.45

risk_diff <- p_struct - p_none                   # 0.30   (absolute, percentage points)
rel_risk  <- p_struct / p_none                   # ~1.67  (multiplicative, "times as likely")
odds_ratio <- (p_struct / (1 - p_struct)) /
              (p_none   / (1 - p_none))           # 3.0 / 0.818 = ~3.67  (NOT the relative risk)

# Key numbers:
#   chi-square 7.5  df 2  p ~ 0.024  (all expected = 24/16, >= 5)
#   Structured vs None:  RD 0.30   RR ~1.67   OR ~3.67   (observational -> association, not cause)
The estimate with its uncertainty. The chi-square (\(7.5\) on \(2\) df, \(p \approx 0.024\)) establishes a statistically significant association between program and passing. The effect measures size it: Structured students passed \(30\) percentage points more often than None students (risk difference \(0.30\)), at about \(1.67\) times the rate (relative risk), with about \(3.67\) times the odds (odds ratio).
The interpretation. Report it as: “Pass rate was associated with support program (\(\chi^2 = 7.5\), df \(= 2\), \(p = 0.024\)); Structured students passed at \(75\%\) versus \(45\%\) for None — a \(30\)-percentage- point difference (relative risk \(1.67\), odds ratio \(3.67\)).” Then attach the three-way discipline. The association is statistically significant (the chi-square’s small \(p\)). It is practically large — a \(30\)-point gap in pass rate is the kind of difference that matters to a student and a department. But it is not causal: students self-selected into programs, so the Structured group may have been more motivated or better prepared to begin with, and these counts cannot separate a real program effect from that selection. Report the risk difference and relative risk as the headline effect; mention the odds ratio but do not read \(3.67\) as “\(3.67\) times as likely” — that is the relative risk’s job, and the relative risk is \(1.67\).
Worked example — a recovery trial: randomized vs observational (transfer, new context)
The question and structure. A clinic compares a new treatment against a control for whether patients recovered within two weeks. The unit is a patient; the response recovered is binary; the grouping variable arm is categorical with two levels; the table is \(2\times 2\). These numbers are illustrative and distinct from Dataset R.
The assumptions. Independent patients and expected counts \(\ge 5\). Suppose the trial enrolls \(100\) treatment and \(100\) control patients, with the \(2\times 2\) table below; the smallest expected count is well above \(5\), so the chi-square is valid.
| Arm | Recovered | Not | Total | Recovery rate |
|---|---|---|---|---|
| Treatment | \(60\) | \(40\) | \(100\) | \(0.60\) |
| Control | \(40\) | \(60\) | \(100\) | \(0.40\) |
The computation. Compute the recovery risks, the relative risk, and the odds ratio.
set.seed(35203)

# Illustrative recovery trial (NOT Dataset R): treatment vs control by recovered/not.
tab2 <- matrix(c(60, 40, 40, 60), nrow = 2, byrow = TRUE,
               dimnames = list(arm = c("Treatment", "Control"),
                               outcome = c("Recovered", "Not")))

chisq.test(tab2)
#   X-squared ~ 8.0, df = 1, p ~ 0.005       # association present; expected = 50 each, >= 5

p_trt <- 60 / 100                            # 0.60
p_ctl <- 40 / 100                            # 0.40

risk_diff <- p_trt - p_ctl                   # 0.20   (20 percentage points)
rel_risk  <- p_trt / p_ctl                   # 1.50   ("1.5 times as likely to recover")
odds_ratio <- (p_trt / (1 - p_trt)) /
              (p_ctl / (1 - p_ctl))           # 1.5 / 0.667 = ~2.25   (again, OR != RR)

# Key numbers (illustrative):
#   risk difference 0.20   relative risk 1.50   odds ratio ~2.25
The estimate with its uncertainty. Treatment patients recovered \(20\) percentage points more often (risk difference \(0.20\)), about \(1.5\) times as often (relative risk), with about \(2.25\) times the odds (odds ratio) — and the chi-square confirms the association is statistically significant.
The interpretation. The table machinery is identical to Dataset R — cross-classify, check expected counts, chi-square for association, then risk difference / relative risk / odds ratio for magnitude — and only the context and numbers changed. But the conclusion the table licenses depends entirely on the design. If patients were randomly assigned to treatment or control, randomization balances the unmeasured differences between the arms on average, so the \(20\)-point recovery gap can be read as a causal effect of the treatment — randomization is what upgrades association to causation. If instead the “treatment” patients chose the new therapy (an observational table), then sicker or healthier patients may have selected in, and — exactly as in Dataset R — you are back to association, not causation. Same arithmetic, same chi-square, same relative risk; the design, not the table, is what decides whether you may say “caused.” And the odds ratio \(2.25\) is still not the relative risk \(1.50\) — read each on its own scale.
A common mistake
This week’s classic applied-methods error comes in four closely related flavors, and each turns a sound table into an overclaim.
The first is running the chi-square with small expected counts. The chi-square \(p\)-value rests on an approximation that needs the expected counts to be reasonably large — the usual rule is every expected count \(\ge 5\). If a cell’s expected count is small (a sparse table, a rare outcome), the chi-square \(p\)-value is unreliable and you should use Fisher’s exact test instead. The frequent confusion is checking the observed counts rather than the expected ones: an observed zero is perfectly fine as long as its expected count clears \(5\). Dataset R is safe — its smallest expected count is \(16\) — but always print chisq.test(...)$expected and check before you trust the \(p\)-value.
The second is stopping at the p-value and never reporting an effect. A chi-square of \(7.5\) with \(p \approx 0.024\) tells you pass and program are associated; it does not tell you the pass-rate gap is \(30\) points, that Structured beats None by \(1.67\times\), or which program is best. A bare \(p\)-value is a verdict without a magnitude, and it violates the course’s first discipline. Always pair the test with a risk difference, relative risk, or odds ratio — the estimate is the point, the test is just the screen.
The third is treating the odds ratio as a relative risk. The odds ratio for Structured vs None is \(3.67\); the relative risk is \(1.67\). They are different numbers on different scales, and the odds ratio is the larger and less intuitive of the two — it always sits farther from \(1\), especially when the outcome is common (a \(60\%\) pass rate is very common). Writing “Structured students were \(3.67\) times as likely to pass” reports the odds ratio as if it were the relative risk and overstates the effect by more than double. Say “\(3.67\) times the odds” for the odds ratio and “\(1.67\) times as likely” for the relative risk — and never swap the words.
The fourth, and the one the course returns to most often, is reading the association as causal. The \(30\)-point pass-rate gap is real, large, and statistically significant — and it is observational. Students self-selected into programs, so the Structured group may have been more motivated or better prepared before any program touched them. A significant chi-square is never proof a program caused passing; it is proof of an association, which self-selection can manufacture on its own. Keep the three things separate every time: statistical significance (\(p \approx 0.024\)), practical significance (a \(30\)-point gap), and causation (not licensed by an observational table). Reserve the causal verb for a randomized design, as the recovery-trial example shows.
Low-stakes self-checks (ungraded)
These are for your own practice — ungraded, no submission.
- From the Dataset R table, write the three program pass rates as conditional proportions, and explain in one sentence why you compare rates rather than the raw pass counts (even though here the groups are equal-sized).
- Show that the expected pass count for each program is \(24\), using the row total, column total, and grand total. Then state in one sentence the rule that makes the chi-square test valid here.
- The chi-square is \(7.5\) on \(2\) df with \(p \approx 0.024\). Write one sentence interpreting that \(p\)-value that does not say “the probability the programs are the same,” and name one thing the chi-square cannot tell you about the table.
- For Structured vs None, compute the risk difference, the relative risk, and the odds ratio from the pass rates \(0.75\) and \(0.45\), and label which is absolute, which is multiplicative on probabilities, and which is multiplicative on odds.
- A classmate reports “Structured students were \(3.67\) times as likely to pass as None students.” Name what is wrong, give the correct sentence for the odds ratio, and state the correct “times as likely” number.
- The Structured pass rate (\(75\%\)) is \(30\) points above None (\(45\%\)). Write one sentence that is honest about what this observational table can and cannot conclude, using the words association and causation. Then say what study design would change the answer.
- A different study has a \(2\times 2\) table where one expected cell count is \(3\). Name what is wrong with reporting the chi-square \(p\)-value, and say which test you would use instead.
Reading and source pointer
This week is grounded in the instructor notes (the primary course materials) for the contingency-table workflow and the test-versus-effect-measure framing, with the IMS (Çetinkaya-Rundel & Hardin) treatment of inference for two proportions and the chi-square test for the concept sequence — building a two-way table, computing expected counts, reading the chi-square, and comparing proportions. The ISLBS (Vu & Harrington) treatment of categorical data in an applied/health setting is an optional applied reference for the risk/odds vocabulary and worked categorical examples. These notes are the course’s own synthesis, grounded in but not copied from the sources. No prose, examples, exercises, figures, or solutions are reproduced from any source.
Public vs. graded
These notes, the examples, and the practice here are public and ungraded — study material only. No graded prompts, answer keys, rubrics, point values, or due dates appear on this site. Graded applied-methods checkpoints, weekly quizzes, homework and analysis memos, applied analysis labs, the midterm, the applied methods project, and the final exam live in Blackboard (the LMS), which is authoritative for due dates, submissions, and grades. If this page and Blackboard ever disagree, follow Blackboard.
Looking ahead
Next week we model a binary outcome directly with logistic regression, instead of testing a table. The contingency table this week treats pass and program as two columns to cross-classify; logistic regression makes pass the response and lets program — along with study hours and pretest — be predictors, modeling the log-odds of passing. That brings two payoffs the table cannot give. First, the odds ratio you computed by hand (\(3.67\) for Structured vs None) becomes a model coefficient you can report with a confidence interval. Second, adjustment comes built in: the raw odds ratio of \(3.67\) shrinks once you hold study hours and pretest fixed — the same confounding- and-adjustment story from regression and ANCOVA, now told for a binary outcome — and you read a predicted probability, never the raw log-odds, as the conclusion. The throughline carries straight through: association, adjustment, and the discipline that \(\text{OR} \ne \text{RR}\).
See also
- Week 11 — ANCOVA and adjustment — the same confounding-and- adjustment logic for a group comparison with a quantitative outcome.
- Week 13 — Logistic regression for binary outcomes — modeling
passdirectly, where the odds ratio becomes a coefficient and adjustment shrinks it. - Reporting and interpretation guide — effect sizes, risk vs odds, practical vs statistical, and association vs causation in one place.
- Method chooser — the question → structure → method guide that routes a categorical outcome to a contingency table.
- Methods glossary — contingency table, expected count, chi-square, risk difference, relative risk, odds ratio.