Week 8 — Multiple comparisons & planned contrasts
After a significant ANOVA: which groups, and at what error rate?
The week question
Two weeks ago the one-way ANOVA on Dataset F told you something narrow and something useful at once. The four instructional formats — Lecture (L), Lecture+Lab (LL), Online (O), and Hybrid (H) — do not all produce the same average final score; the overall \(F \approx 7.61\) on \((3, 96)\) with \(p \approx 0.0001\) rejected the claim that the four group means are equal. But that omnibus verdict is deliberately mute about the thing you actually want to know. It says “at least one format differs from at least one other,” and then it stops. It does not say which formats differ, by how much, or whether the gaps it found are large enough to matter to a department deciding how to run a course.
So the week’s question is the natural next one, and it has two parts. First: after a significant ANOVA, which specific groups differ — and how do you keep the error rate honest when you ask about several pairs at once? Second, and just as important: what if you had one specific comparison in mind before you ever saw the data — can you ask it directly, more powerfully, instead of sweeping every pair? The first part is the multiple-comparisons problem and its fix (Tukey HSD). The second is the planned contrast. Both are instances of the same blueprint you have been walking all term — a question, a structure, a method, an estimate with its uncertainty, a bounded conclusion — but here the estimate is a difference between groups or combinations of groups, and the new discipline is controlling how many times you let yourself be surprised.
Why this matters
The reason this matters is a piece of arithmetic about luck that catches almost everyone the first time. With four groups there are \(\binom{4}{2} = 6\) possible pairwise comparisons. If you ran each one as a separate test at the usual \(\alpha = 0.05\), then even if every format were truly identical, the chance that at least one of those six tests trips a false alarm is not \(5\%\) — it climbs toward \(1 - (0.95)^6 \approx 0.26\). More than a one-in-four chance of “finding” a difference that is not there, just from running six tests. The more pairs you inspect, the worse it gets. That inflated rate is the family-wise error rate, and ignoring it is how a tidy “significant difference” can be manufactured out of pure noise.
This is the practical heart of the week, and it connects straight to the course’s two standing disciplines. The first — report the estimate with its uncertainty, not just a verdict — is what keeps you honest about how big a format gap is, not merely whether some test crossed a threshold; every comparison this week comes out as a difference in points that you can compare against the Tukey critical difference. The second — keep statistical, practical, and causal significance distinct — is sharper than ever here, because Dataset F is an observational study (students were not randomly assigned to formats), so even a gap that clears every multiplicity correction buys you an association, not proof that the format caused the score difference. A clean way to say all of this: the omnibus \(F\) opens the door; multiple- comparison control decides which rooms you are actually licensed to walk into; and the study’s design decides whether “walked into” means “caused.”
Learning goals
By the end of this week you should be able to:
- Explain the multiple-comparisons problem in plain words — why running many pairwise tests at \(\alpha = 0.05\) inflates the family-wise error rate above \(0.05\) — and estimate roughly how badly, given the number of comparisons.
- Read a Tukey HSD result as a set of pairwise mean differences each reported with a confidence interval, and use the critical difference (\(\approx 6.64\) for Dataset F) to decide which pairs are significant at a controlled family-wise rate.
- State a planned contrast as a weighted combination of group means \(\hat\psi = \sum c_j \bar x_j\) with \(\sum c_j = 0\), build the weights for a pre-specified question, and interpret its estimate, standard error, \(t\)-statistic, and \(p\)-value.
- Distinguish a planned contrast (one pre-specified question, more powerful) from a post-hoc sweep (every pair, multiplicity-controlled), and say when each is the right tool — and name Bonferroni as a simple, conservative alternative to Tukey.
- For any of these comparisons, name the blueprint move: what is estimated (a difference in points), what its uncertainty is (an interval or SE), what is assumed (the ANOVA assumptions carry over), and what it cannot conclude (causation, from an observational design).
Core vocabulary
- Multiple-comparisons problem — the inflation of the error rate that happens when you run many hypothesis tests and judge each at the same \(\alpha\); the more tests, the higher the chance of at least one false positive.
- Family-wise error rate (FWER) — the probability of making at least one false rejection across the whole family of comparisons. Multiplicity corrections control this rate, not the per-test rate.
- Tukey HSD (Honestly Significant Difference) — a procedure that tests all pairwise group differences while holding the family-wise error rate at \(\alpha\); it produces a confidence interval for every pair and a single critical difference threshold when group sizes are equal.
- Critical difference — under equal \(n\), the smallest absolute mean difference that Tukey calls significant: \(q_{\alpha,k,\,df}\sqrt{\mathrm{MSE}/n}\). A pair clears it or it does not.
- Planned contrast — a single comparison specified before seeing the data, written as a weighted combination of group means \(\hat\psi = \sum c_j \bar x_j\) with weights summing to zero (\(\sum c_j = 0\)); it answers one focused question and is more powerful than an all-pairs sweep.
- Contrast coefficients \(c_j\) — the weights that encode the question; positive weights on one side, negative on the other, summing to zero, so \(\hat\psi = 0\) means “no difference between the two sides.”
- Bonferroni correction — a blunt but simple multiplicity control: test each of \(m\) comparisons at \(\alpha/m\). Easy to state, conservative (it can miss real effects), and a reasonable fallback.
- Post-hoc vs. planned — post-hoc comparisons are decided after seeing the data and must pay the full multiplicity tax; planned comparisons are decided in advance and, being few and focused, cost less power.
Concept development
The multiple-comparisons problem: why many tests inflate the error rate
Start with the danger, because the two methods this week exist to defuse it. The omnibus ANOVA was a single test with a single \(\alpha = 0.05\): under a true null of equal means, it falsely fires about \(5\%\) of the time. That is a controlled, honest rate. The trouble begins the moment you stop asking “is anything different?” and start asking “is L different from O? is LL different from H? is …?” — because now you are running a family of tests, and each one carries its own \(5\%\) risk.
The arithmetic is unforgiving. If the comparisons were independent and every format were genuinely identical, the chance of no false alarm across \(m\) tests would be \((0.95)^m\), so the chance of at least one false alarm — the family-wise error rate — is
\[ \mathrm{FWER} = 1 - (1 - \alpha)^m . \]
For the \(m = 6\) pairwise comparisons among four formats, \(\mathrm{FWER} \approx 1 - (0.95)^6 \approx 0.26\). You set out to test at \(5\%\) and quietly ended up testing at \(26\%\). (The pairwise comparisons are not perfectly independent, so this is an approximation, but it gets the moral exactly right: more comparisons, more chances to be fooled.) The fix is not to forbid asking which pairs differ — that is the whole point of running the study. The fix is to adjust the threshold so the family as a whole, not each test in isolation, holds at \(5\%\). Tukey HSD does this for the all-pairs question; Bonferroni does it crudely; a planned contrast sidesteps much of the tax by asking only one question.
Tukey HSD: all pairwise comparisons with the error rate controlled
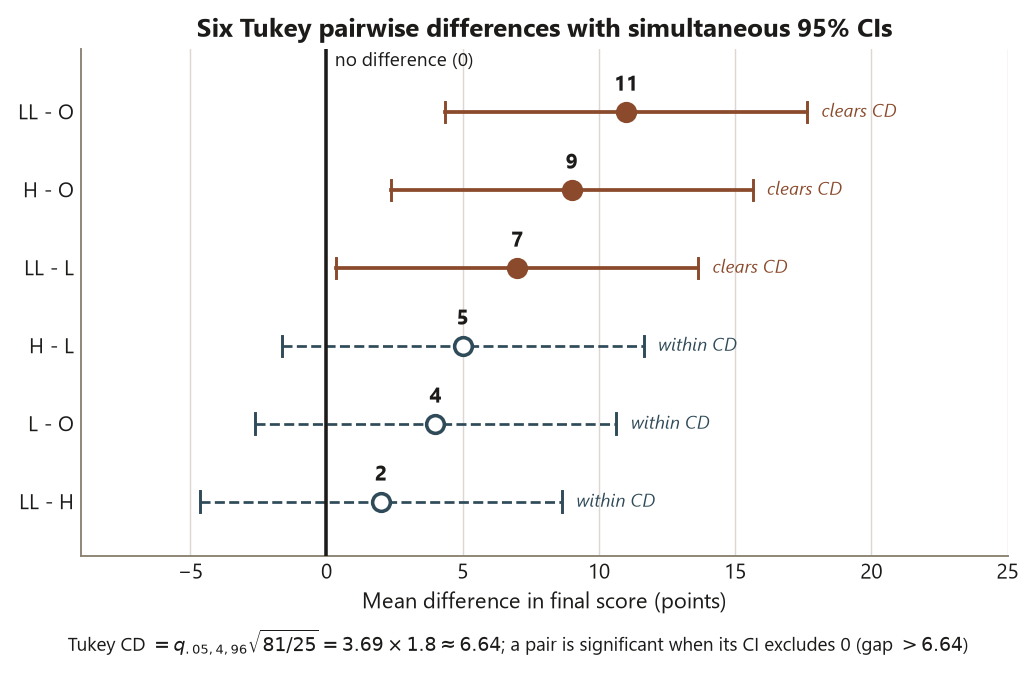
Tukey’s procedure answers “which pairs differ?” while keeping the family-wise error rate at \(\alpha\). It does this by replacing the ordinary \(t\) critical value with one from the studentized range distribution \(q\), which is built precisely for “the largest gap among \(k\) groups.” Because Dataset F has equal group sizes (\(n = 25\) per format), Tukey collapses to one clean threshold — the critical difference — and any pair whose absolute mean gap exceeds it is declared significant at the controlled rate:
\[ \mathrm{CD} = q_{\alpha,\,k,\,df}\sqrt{\frac{\mathrm{MSE}}{n}} = q_{.05,\,4,\,96}\sqrt{\frac{81}{25}} = 3.69 \times 1.8 \approx 6.64 \text{ points.} \]
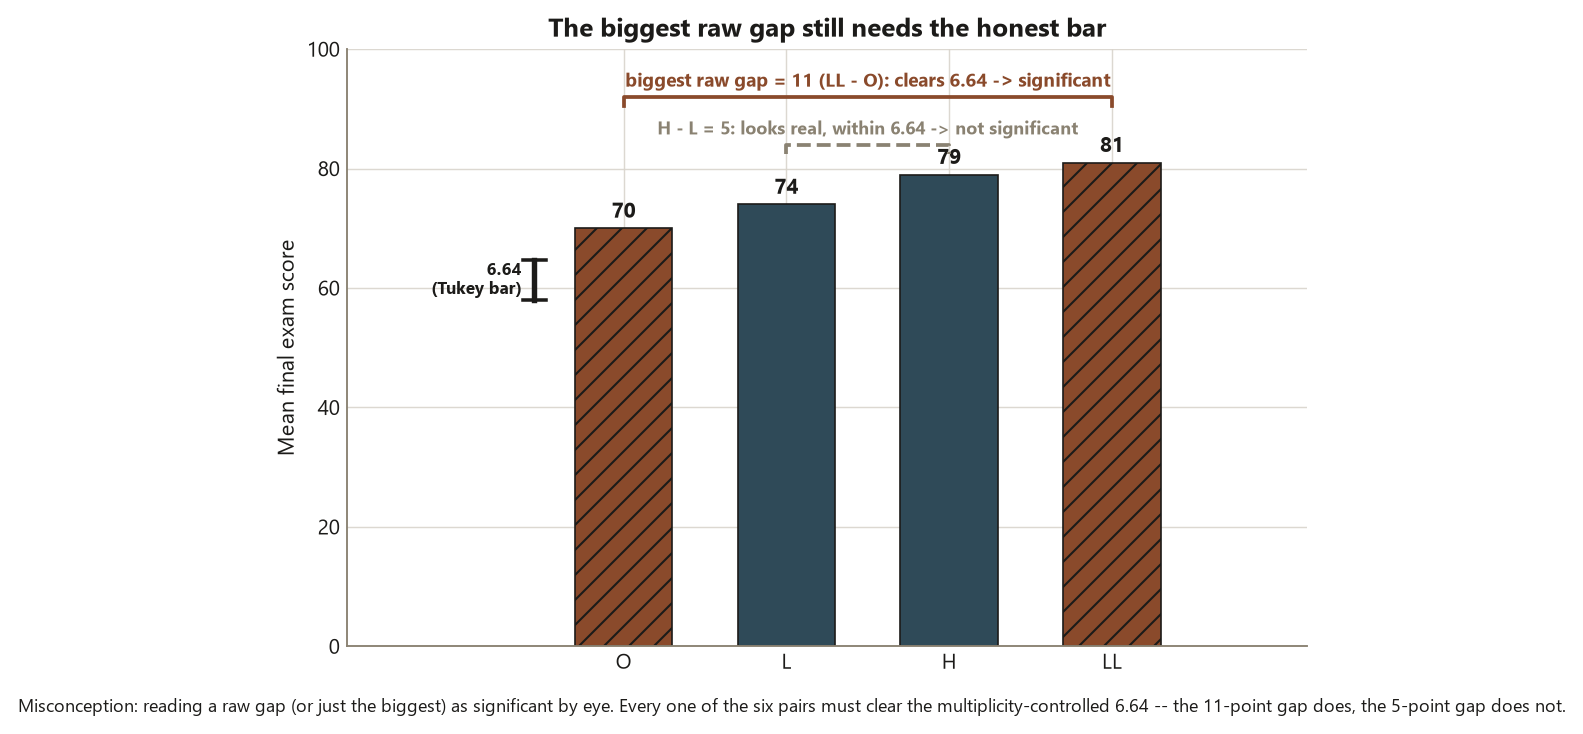
Here \(\mathrm{MSE} = 81\) is the pooled within-group variance estimate carried over from the wk-6 ANOVA (common within-group SD \(\approx 9\)), \(k = 4\) groups, and \(q_{.05,4,96} \approx 3.69\). So a pair of formats must differ by more than \(6.64\) points to clear Tukey. Now lay the six observed gaps against that bar. The group means are \(L = 74\), \(LL = 81\), \(O = 70\), \(H = 79\):
| Pair | Mean difference | Exceeds CD \(\approx 6.64\)? | Tukey verdict |
|---|---|---|---|
| LL \(-\) O | \(81 - 70 = 11\) | yes | significant |
| H \(-\) O | \(79 - 70 = 9\) | yes | significant |
| LL \(-\) L | \(81 - 74 = 7\) | yes | significant |
| H \(-\) L | \(79 - 74 = 5\) | no | not significant |
| L \(-\) O | \(74 - 70 = 4\) | no | not significant |
| LL \(-\) H | \(81 - 79 = 2\) | no | not significant |
Read the pattern as a sentence, not a table of yes/no. The three significant gaps all involve the Online format on the low side or the hands-on formats (LL, H) on the high side: \(LL - O = 11\), \(H - O = 9\), \(LL - L = 7\). The three non-significant gaps are the small ones — \(H - L = 5\), \(L - O = 4\), \(LL - H = 2\) — none of which clears \(6.64\). The blueprint discipline: each Tukey comparison is an estimate with uncertainty (a mean difference plus a confidence interval whose half-width is the critical difference), not a bare verdict, and you would report, e.g., “LL beats O by \(11\) points (Tukey \(95\%\) CI roughly \(11 \pm 6.6\), so about \(4.4\) to \(17.6\)), a difference that clears the multiplicity- controlled threshold.” And the bounded conclusion: this is an association between format and score in an observational study, so even the clean \(11\)-point gap is not proof that lab-based instruction caused the higher score — motivated or better-prepared students may have selected those formats.
Planned contrasts: ask the one question you came with
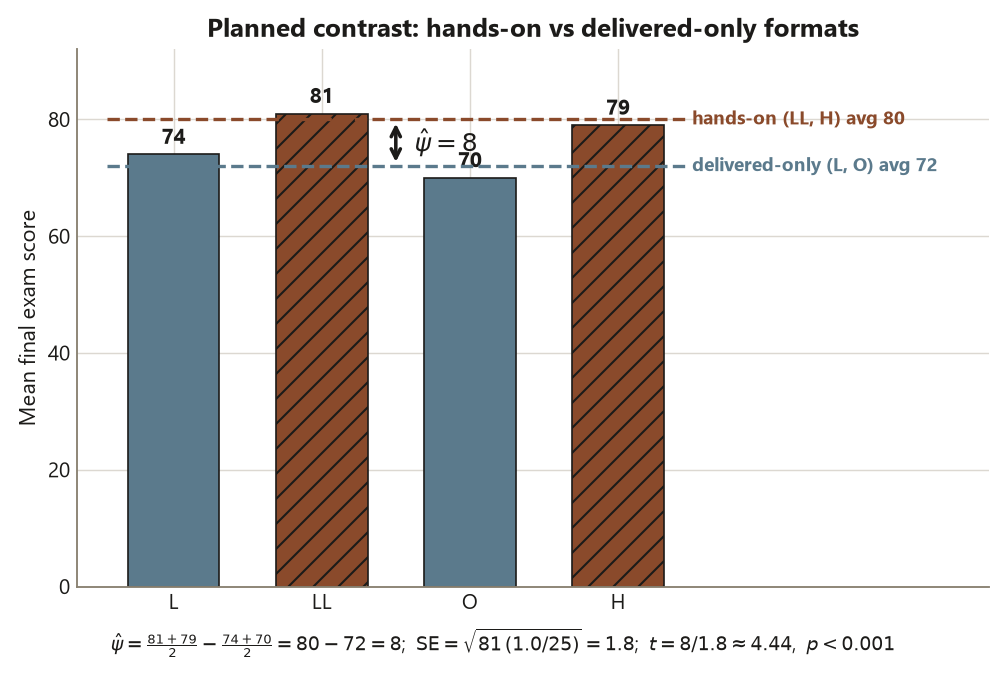
Tukey is the right tool when you genuinely want to scan all pairs. But often you do not. Suppose the department’s actual question, fixed before the data came in, was sharper: do the hands-on formats (Lecture+Lab and Hybrid) outscore the delivered-only formats (Lecture and Online)? That is one comparison, not six — and it groups the formats into two camps rather than testing them pairwise. A planned contrast expresses exactly that. You write a weighted combination of the group means whose weights sum to zero:
\[ \hat\psi = \sum_j c_j \bar x_j, \qquad \sum_j c_j = 0 . \]
For “hands-on (LL, H) versus delivered-only (L, O),” put positive weight on the hands-on side and negative on the delivered-only side, averaging within each camp. Using the order \((L, LL, O, H)\), the weights are \(c = (-\tfrac12,\, +\tfrac12,\, -\tfrac12,\, +\tfrac12)\) — they sum to zero, and \(\hat\psi = 0\) would mean “the two camps score the same on average.” Plug in the means:
\[ \hat\psi = \frac{\bar x_{LL} + \bar x_H}{2} - \frac{\bar x_L + \bar x_O}{2} = \frac{81 + 79}{2} - \frac{74 + 70}{2} = 80 - 72 = 8 \text{ points.} \]
The hands-on camp averages \(8\) points higher. Now attach its uncertainty — the move the course never lets you skip. The standard error of a contrast uses the same pooled \(\mathrm{MSE} = 81\):
\[ \mathrm{SE}(\hat\psi) = \sqrt{\mathrm{MSE}\sum_j \frac{c_j^2}{n}} = \sqrt{81 \cdot \frac{(\tfrac14 + \tfrac14 + \tfrac14 + \tfrac14)}{25}} = \sqrt{81 \cdot \frac{1.0}{25}} = \sqrt{3.24} = 1.8 , \]
so the test statistic is
\[ t = \frac{\hat\psi}{\mathrm{SE}(\hat\psi)} = \frac{8}{1.8} \approx 4.44 \quad \text{on } 96 \text{ df,} \qquad p < 0.001 . \]
An \(8\)-point hands-on advantage with \(t \approx 4.44\) and \(p < 0.001\) is strong evidence — and here is the payoff that makes planning worth it. Because you asked one pre-specified question instead of sweeping all six pairs, you pay almost no multiplicity tax, so the contrast is more powerful than the corresponding post-hoc comparison: it can detect the camp-level difference even though, pairwise, \(H - L = 5\) and \(L - O = 4\) were not individually significant under Tukey. Pooling LL with H and L with O concentrates the signal.
Two contrasts with the planned approach. First, Bonferroni as the conservative alternative: if you had several planned contrasts, you would simply test each at \(\alpha/m\) — dead simple, but it over-corrects and can miss real effects, so prefer Tukey for the all-pairs case and reserve Bonferroni for a small handful of planned questions. Second, post-hoc versus planned is a discipline question, not just a math one: a contrast is only legitimately “planned” if you wrote it down before looking at the means. Spotting that LL and H happen to be the two highest groups and then contrasting them against the rest is a post-hoc move wearing a planned costume — and it must pay the full multiplicity tax, because you let the data choose your question.
Worked examples
Worked example — Dataset F: Tukey then a planned contrast (recurring slice)
Question. After the significant one-way ANOVA, two things: (a) which of the four format pairs differ, at a controlled family-wise rate? and (b) the department’s pre-registered question — do hands-on formats (LL, H) beat delivered-only formats (L, O)?
Structure. Unit of analysis: a student. Response: final exam score (quantitative, 0–100). Grouping factor: instructional format, one factor with four levels (L, LL, O, H), \(n = 25\) each, \(N = 100\). Design: observational (students were not randomly assigned to formats) and independent (different students in each group). Data are synthetic; seed set (set.seed(35203)).
Assumptions. The Tukey and contrast inferences ride on the same ANOVA assumptions you checked in wk 7: approximately normal residuals (the QQ plot was near-linear with one mild low Online outlier you investigate rather than delete), roughly equal within-group variances (Levene’s \(p \approx 0.40\), so the pooled \(\mathrm{MSE} = 81\) is defensible), and independent observations. Those checks are what license a single pooled error term across all comparisons.
Computation and the estimate with its uncertainty. The Tukey critical difference is \(\mathrm{CD} = 3.69\sqrt{81/25} \approx 6.64\) points. Against it: \(LL - O = 11\), \(H - O = 9\), and \(LL - L = 7\) all clear the bar (significant); \(H - L = 5\), \(L - O = 4\), and \(LL - H = 2\) do not (not significant). The planned contrast for hands-on vs delivered-only gives \(\hat\psi = 80 - 72 = 8\) points, \(\mathrm{SE} = 1.8\), \(t = 8/1.8 \approx 4.44\) on \(96\) df, \(p < 0.001\). The static R below shows the idioms; it is not executed on this site.
set.seed(35203)

# Dataset F: final score by instructional format (L, LL, O, H), n = 25 each, N = 100.
# Synthetic; group means L=74, LL=81, O=70, H=79; pooled MSE = 81 (within-SD ~ 9).
fit <- aov(final ~ format, data = dataset_F)
summary(fit)
#                Df Sum Sq Mean Sq F value   Pr(>F)
# format          3   1850   616.7    7.61   0.0001 ***   (omnibus from wk 6)
# Residuals      96   7776    81.0

# (a) All-pairs, family-wise error controlled at 0.05:
TukeyHSD(fit, conf.level = 0.95)
#            diff  lwr   upr   p adj      (CD ~ 6.64; |diff| > CD => significant)
# LL-O         11  4.4  17.6   <.001  *   significant
# H-O           9  2.4  15.6    .004  *   significant
# LL-L          7  0.4  13.6    .034  *   significant
# H-L           5 -1.6  11.6    .20       not significant
# L-O           4 -2.6  10.6    .39       not significant
# LL-H          2 -4.6   8.6    .86       not significant

# (b) ONE planned contrast: hands-on (LL, H) vs delivered-only (L, O).
# Order (L, LL, O, H); weights sum to zero, average within each camp:
library(emmeans)
emm <- emmeans(fit, ~ format)                      # group means with SEs
contrast(emm, list("handson_vs_delivered" =
                     c(L = -0.5, LL = 0.5, O = -0.5, H = 0.5)))
# contrast               estimate   SE  df t.ratio p.value
# handson_vs_delivered        8.0  1.8  96   4.44   <.0001     psi-hat = 8 points
Conclusion. Tukey flags exactly the three large gaps — all involving Online’s low mean or the two hands-on formats’ high means — and refuses to flag the three small ones, which is the multiplicity control doing its job: it stops you from over-reading the \(5\)- and \(4\)-point gaps. The planned contrast then answers the department’s actual question crisply: hands-on formats score about \(8\) points higher on average (SE \(1.8\), \(t \approx 4.44\), \(p < 0.001\)), a difference that is both statistically clear and — on a 100-point exam — practically meaningful (roughly \(0.9\) within-group SD). But hold the line on causation: students chose their formats, so this is an association, not evidence that hands-on instruction caused the gain. The blueprint closes where it always does — an estimate, its uncertainty, and a bounded claim.
Worked example — three doses versus a control (transfer, new context)
Question. A nutrition-science lab runs a one-way study of a supplement on a continuous outcome — say a biomarker measured after eight weeks — with four groups: a Control and three active doses, Low, Medium, and High, \(n = 20\) per group, \(N = 80\). The pre-specified question, written into the protocol before data collection, is: do the active doses, as a group, differ from the control? These numbers are illustrative and distinct from Dataset F.
Structure. Unit: a participant. Response: the biomarker (quantitative). Grouping factor: dose, one factor with four levels. Design: if doses were randomly assigned, this is experimental — a difference here would support a causal reading, unlike Dataset F. Synthetic, seed-set illustrative values.
Choosing the contrast for the planned question. “Active doses vs control” is not a single pairwise gap; it pools the three active arms against the one control. Put a weight of \(-1\) on Control and \(+\tfrac13\) on each active dose, so the weights sum to zero and \(\hat\psi\) compares the average active response to the control. Using the order \((\text{Control}, \text{Low}, \text{Medium}, \text{High})\):
\[ c = \left(-1,\ \tfrac13,\ \tfrac13,\ \tfrac13\right), \qquad \hat\psi = \frac{\bar x_{\text{Low}} + \bar x_{\text{Med}} + \bar x_{\text{High}}}{3} - \bar x_{\text{Control}} . \]
Suppose the group means are Control \(= 50\), Low \(= 53\), Medium \(= 56\), High \(= 60\) (units of the biomarker), with a pooled \(\mathrm{MSE} = 64\) (within-SD \(\approx 8\)). Then the active average is \((53 + 56 + 60)/3 = 56.3\), so \(\hat\psi = 56.3 - 50 = 6.3\). Its standard error is
\[ \mathrm{SE}(\hat\psi) = \sqrt{\mathrm{MSE}\sum_j \frac{c_j^2}{n}} = \sqrt{64 \cdot \frac{(1)^2 + 3(\tfrac13)^2}{20}} = \sqrt{64 \cdot \frac{1 + \tfrac13}{20}} = \sqrt{64 \cdot 0.0667} \approx 2.07 , \]
so \(t = 6.3 / 2.07 \approx 3.05\) on \(76\) df (\(p \approx 0.003\)). The static R:
set.seed(35203)

# Dose study: Control + Low/Medium/High, n = 20 each, N = 80. Synthetic; illustrative.
# Means: Control=50, Low=53, Medium=56, High=60; pooled MSE = 64 (within-SD ~ 8).
fit2 <- aov(biomarker ~ dose, data = dose_study)

library(emmeans)
emm2 <- emmeans(fit2, ~ dose)
# Planned: average of the three active doses vs Control (weights sum to zero):
contrast(emm2, list("active_vs_control" =
                     c(Control = -1, Low = 1/3, Medium = 1/3, High = 1/3)))
# contrast            estimate    SE  df t.ratio p.value
# active_vs_control       6.3  2.07  76    3.05   0.003    psi-hat = 6.3
Conclusion. The single planned contrast answers the protocol’s question directly: the active doses, on average, raise the biomarker about \(6.3\) units (SE \(2.07\), \(t \approx 3.05\), \(p \approx 0.003\)) above control. Because you specified this one comparison in advance, you spend almost no multiplicity budget and keep more power than a six-pair Tukey sweep would. And because the doses were randomly assigned here, the conclusion can — unlike Dataset F — reach toward causation. The design move is identical to the Dataset F contrast: name the question first, write weights that sum to zero, estimate the weighted mean difference, attach its SE, and bound the claim by the study’s design. Same logic, new context.
A common mistake
This week’s classic error is p-value hunting — and it has two faces, both of which manufacture significance out of multiplicity.
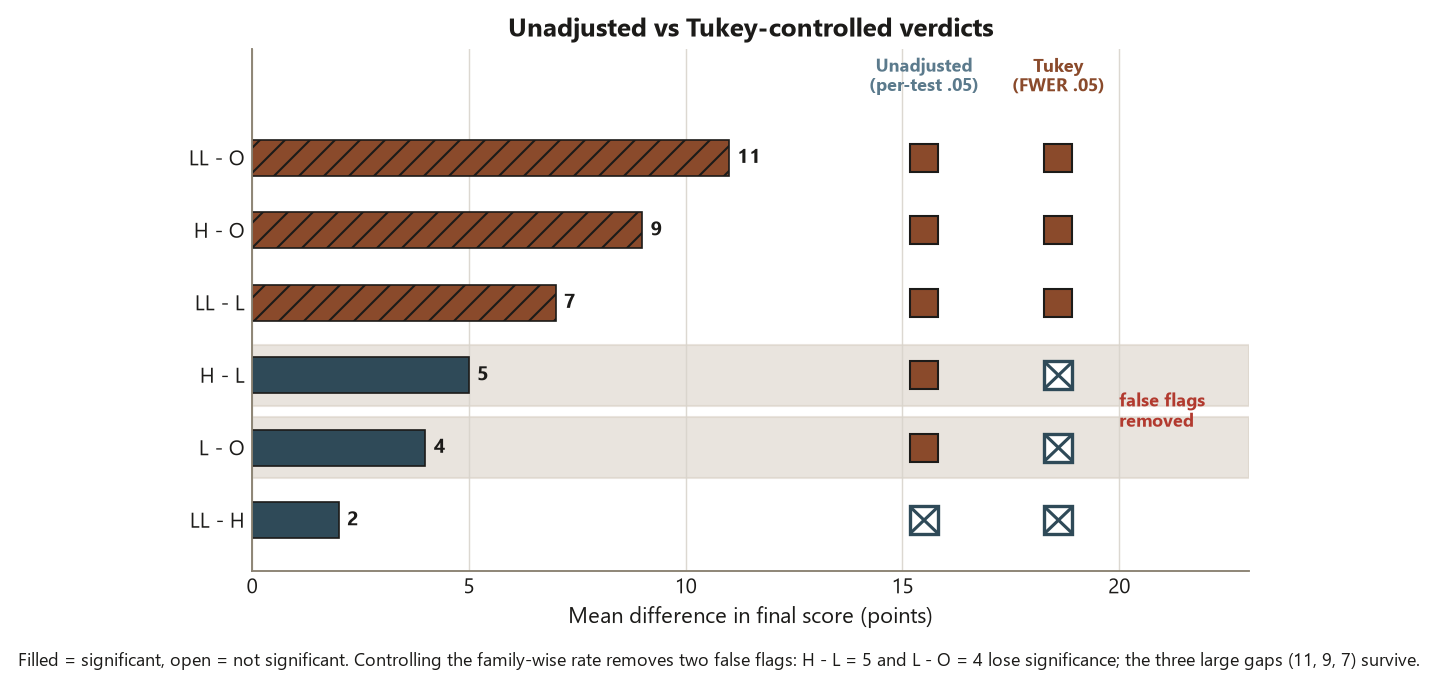
The first face is running many unadjusted comparisons and keeping only the “significant” ones. A student runs all six pairwise \(t\)-tests on Dataset F at \(\alpha = 0.05\) each, notices that three (or four, on a noisy day) came back with \(p < 0.05\), reports those, and quietly drops the rest. The trouble is the \(26\%\) family-wise error rate from the start of the week: with six tests at \(5\%\) apiece, finding some “significant” pairs is nearly expected even when no format differs at all. Reporting the survivors as if each were a clean \(5\%\) result is not analysis — it is a filter that selects for luck. The fix is to control the family-wise rate: use Tukey for the all-pairs question (its critical difference of \(6.64\) already bakes in the correction, which is exactly why it refuses to flag \(H - L = 5\) and \(L - O = 4\)), or Bonferroni if you have only a few comparisons. A quick self-diagnostic: if you cannot say, before looking, how many comparisons you intended to make, you are almost certainly p-value hunting.
The second face is the post-hoc sweep when a single planned contrast was the real question. Here the error runs the other way: you did have one focused question — hands-on vs delivered-only — but instead of asking it directly, you ran all six pairwise comparisons, found that \(H - L\) and \(L - O\) were not individually significant, and concluded “the formats mostly don’t differ.” That throws away power. The camp-level contrast (\(\hat\psi = 8\), \(t \approx 4.44\), \(p < 0.001\)) is far more sensitive than the scattered pairwise gaps, precisely because it pools the signal and asks once. The flip side of the same coin is the most seductive version of p-value hunting: eyeballing the means, noticing LL and H are highest, and then “planning” a contrast against the rest. A contrast is only planned if it was written down before the data spoke; choosing it from the data and calling it planned is post-hoc dressed as pre-registered, and it must pay the full multiplicity tax. Decide your question first; let the method, not the means, set the threshold.
Low-stakes self-checks (ungraded)
These are for your own practice — ungraded, no submission.
- With four formats there are six pairwise comparisons. In one sentence, explain why testing all six at \(\alpha = 0.05\) does not keep the overall error rate at \(5\%\), and give the rough family-wise rate.
- The Dataset F Tukey critical difference is \(\approx 6.64\) points. Which of the six pairs clear it, and which do not? Write the verdict for \(H - L = 5\) and explain in one sentence why it is not significant even though \(5 > 0\).
- Write the contrast coefficients (in the order \(L, LL, O, H\)) for “hands-on (LL, H) vs delivered-only (L, O),” confirm they sum to zero, and compute \(\hat\psi\) from the means \(L = 74\), \(LL = 81\), \(O = 70\), \(H = 79\).
- The planned contrast gives \(t \approx 4.44\), \(p < 0.001\), yet pairwise \(H - L\) and \(L - O\) were not Tukey-significant. In one or two sentences, explain how the contrast can be significant when those pairs were not.
- A classmate inspects the four means, sees LL and H are highest, and then tests “LL+H vs L+O” as a “planned” contrast. Name what is wrong and what they should do instead.
- Dataset F is observational. Write one sentence interpreting the \(8\)-point hands-on advantage that does not claim the format caused the difference, and name one reason students might self-select into hands-on formats.
Reading and source pointer
This week is grounded in the instructor notes (the primary course materials) for the multiple-comparisons problem, the Tukey HSD reading of Dataset F, and the planned-contrast framing, with the IMS (Cetinkaya-Rundel & Hardin) treatment of multiple comparisons after ANOVA for the concept sequence — why pairwise testing inflates the error rate and how Tukey and related corrections control the family-wise rate. ISLBS (Vu & Harrington) is named as an optional applied reference for post-hoc comparisons in a health-flavored setting; it is not required. These notes are the course’s own synthesis, grounded in but not copied from the sources. No prose, examples, exercises, figures, or solutions are reproduced from any source.
Public vs. graded
These notes, the examples, and the practice here are public and ungraded — study material only. No graded prompts, answer keys, rubrics, point values, or due dates appear on this site. Graded applied-methods checkpoints, weekly quizzes, homework and analysis memos, applied analysis labs, the midterm, the applied methods project, and the final exam live in Blackboard (the LMS), which is authoritative for due dates, submissions, and grades. If this page and Blackboard ever disagree, follow Blackboard.
Looking ahead
Next week we add a second factor. So far every comparison has lived inside one grouping variable; in week 9 we cross two factors — Delivery {In-person, Online} × Prior background {Weak, Strong} — and meet the interaction, the effect that says a factor’s impact depends on the level of the other. The headline discipline arrives with it: when the interaction is significant, you read it before the main effects, because reporting an “average” main effect can be misleading when the effect is not the same across the other factor. The blueprint is the same; the structure grows a dimension.
See also
- Week 6 — Many-group comparisons & one-way ANOVA — the omnibus \(F \approx 7.61\) that this week follows up on.
- Week 7 — Assumptions, diagnostics & the midterm — the residual, Levene, and independence checks that license the pooled \(\mathrm{MSE} = 81\) used here.
- Week 9 — Two-way ANOVA & interaction — a second factor and the interaction you read before the main effects.
- Lab 8 — ANOVA with multiple comparisons — the companion lab that runs the Tukey and contrast machinery in R.
- Reporting and interpretation guide — effect sizes, confidence intervals, and keeping statistical, practical, and causal claims distinct.