Lab 10 — Confounding and adjustment by simulation
Generating data from a causal diagram to see adjustment work — and a bad control fail
Purpose. This lab is the hands-on companion to Week 10 — Causal diagrams and backdoor reasoning. There you reasoned, on paper, that the tutoring-center diagram tells you to adjust for the pre-treatment confounder
PriorAbilityand to leave the post-treatment variableHoursStudiedalone. Here you build a dataset from that very diagram and watch the consequences play out: the naive comparison overstates the effect, adjusting for the confounder recovers it, and adding the post-treatment “bad control” quietly breaks it again. The point of the lab is not the R — it is that the diagram, not the regression output, is what tells you which variables to adjust for.
The idea
In an observational study you do not get to assign treatment, so you cannot lean on randomization to break the backdoor paths. You have to reason about them, and the cheapest way to check that reasoning is to simulate. When you generate the data yourself, you know the true effect — you typed it in — so you can ask a sharp question of each analysis: does it recover the number I put in?
That is the move this lab makes. You will write down the tutoring-center diagram as a small data-generating recipe, with a true causal effect of Use on Outcome of exactly \(+3.0\) points baked in. Then you will run three analyses on the same simulated data:
- a naive difference in means (no adjustment), which leaves the backdoor open;
- an adjusted estimate that conditions on the pre-treatment confounder
PriorAbility, which closes the backdoor; - a bad-control estimate that also conditions on the post-treatment mediator
HoursStudied.
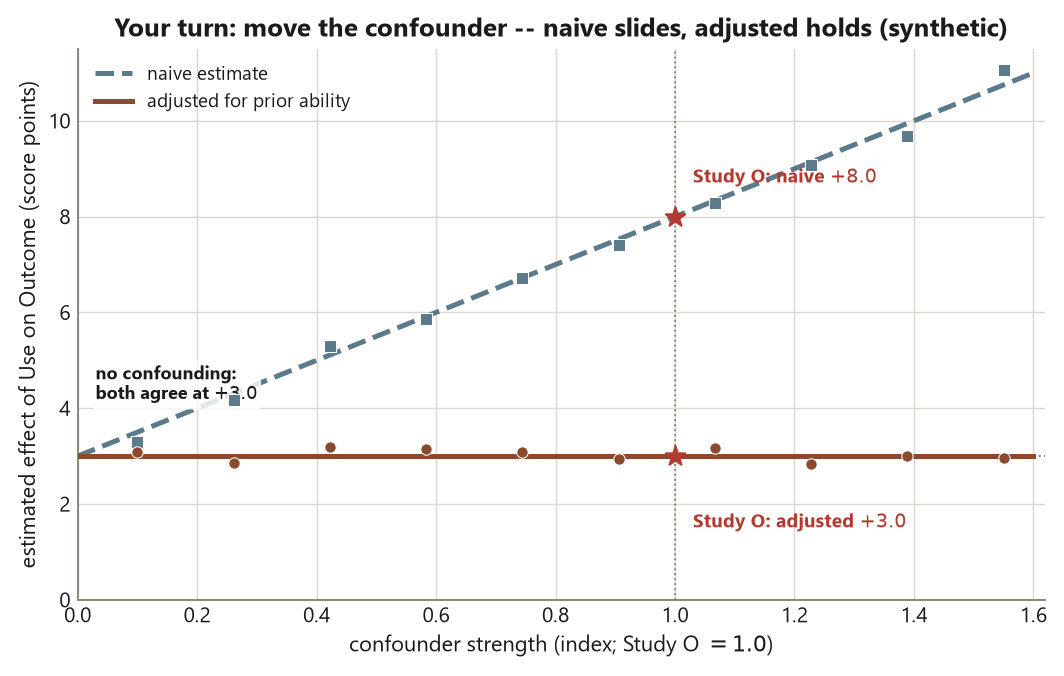
Because you know the truth is \(+3.0\), you can see directly which analysis is honest. The naive estimate lands near \(+8.0\) — the locked Study O naive difference — because confounding inflates it by about \(+5.0\). The correct adjustment lands near \(+3.0\). The bad control drifts below \(+3.0\), biased toward zero, even though the code ran without a single warning. That silence is the whole lesson: a bad control does not throw an error. The diagram is the only thing that would have stopped you.
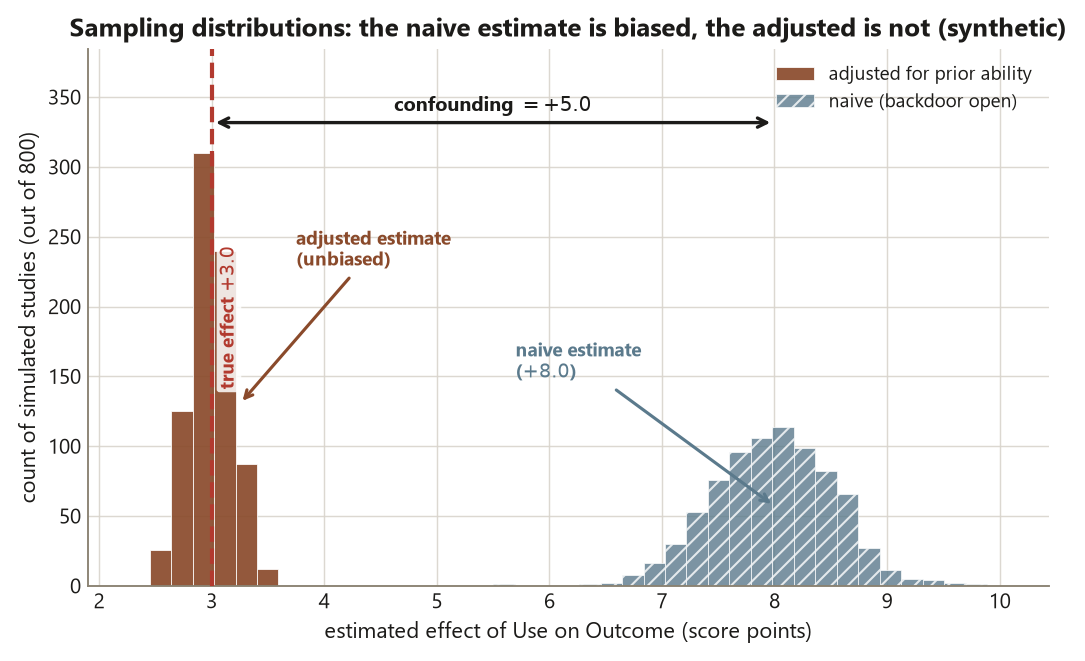
PriorAbility — clusters on the truth at \(+3.0\). The \(+5.0\) gap between the two centers is exactly the confounding leaking through the open backdoor. Synthetic; seed 45403.
This keeps the course’s central distinction in view. Random assignment would have closed every backdoor for you by design and earned a causal claim outright. Here you have only observation plus a defensible adjustment set, which is the closest an observational study can come — and only for the confounders you actually measured.
Goal
By the end of this lab you should be able to:
- generate a small dataset from a stated causal diagram, encoding a known true effect and a known confounder, with
set.seed(45403)so the result is reproducible; - compute the naive, confounder-adjusted, and bad-control estimates of the same effect, and read which one recovers the truth;
- explain, in design language, why the naive estimate is inflated (an open backdoor through a pre-treatment confounder) and why the bad control is biased (conditioning on a post-treatment mediator);
- connect the simulated numbers back to the locked Study O slice — naive \(+8.0\), adjusted \(+3.0\) — and state plainly what claim each estimate does and does not support.
Throughout, the code is in service of the design point. You are not learning lm(); you are using lm() to make a design idea visible.
Setup
You need only base R — no packages — because every step is a small, readable idiom (rnorm, rbinom, group means, lm). The data are synthetic and seed set (set.seed(45403)); they are not real student records.
The recurring slice is Study O, the tutoring-center observational study from the bible. The locked facts you will reproduce or honor:
- Users \(n = 120\), non-users \(n = 180\), total \(n = 300\).
- The naive mean difference is users \(82.0\) minus non-users \(74.0 = +8.0\) points.
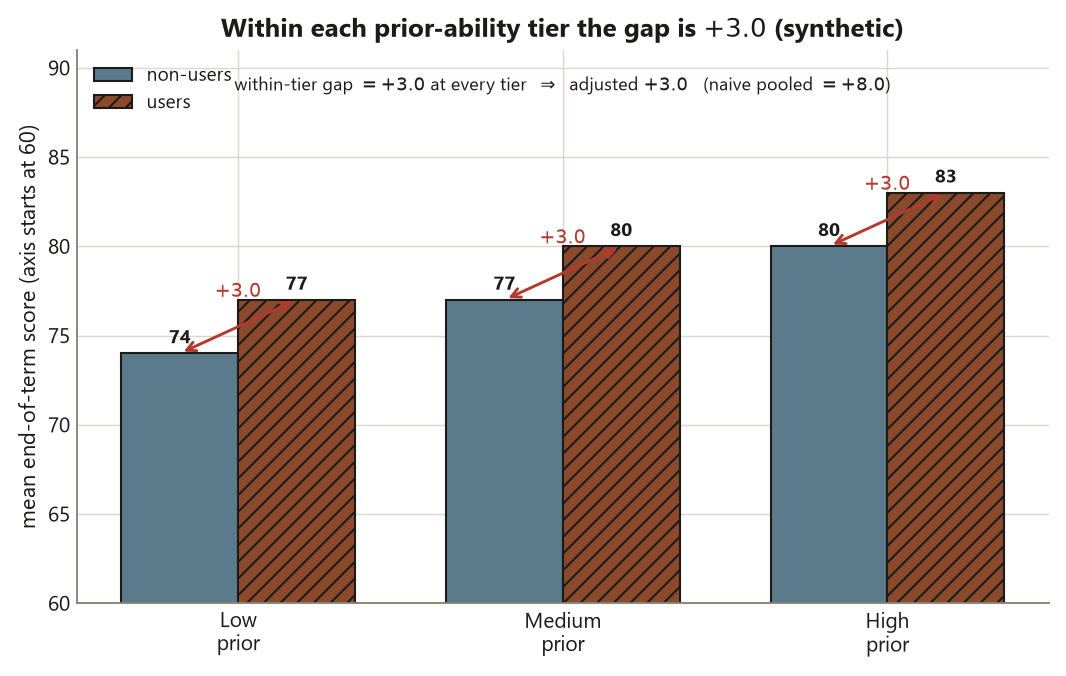
- Stratifying on the pre-treatment prior-ability tier gives the adjusted \(+3.0\); confounding inflated the naive estimate by \(+5.0\).
- The intended parallel: that adjusted \(+3.0\) deliberately matches Study E’s randomized experimental effect \(d = 3.0\) — careful adjustment approximates what random assignment guarantees, but only when the confounder is measured and the diagram is right.
The diagram you are simulating from (authored as accessible text, exactly as in the week note):
Nodes. Use (treatment \(Z\) — used the center, yes/no), Outcome (response \(Y\) — end-of-term score), PriorAbility (a pre-treatment covariate — preparation and motivation before the term), HoursStudied (hours studied during the term).
Edges.
PriorAbility -> Use— more-prepared, more-motivated students are likelier to choose the center.PriorAbility -> Outcome— more-prepared students score higher anyway, with or without the center.Use -> Outcome— the causal effect we want, set to \(+3.0\).Use -> HoursStudied -> Outcome— using the center leads to more studying, which lifts the score.
The backdoor path is Use <- PriorAbility -> Outcome; PriorAbility is the confounder that opens it. HoursStudied sits on the causal path Use -> HoursStudied -> Outcome, so it is a post-treatment mediator — the classic bad control. The correct adjustment set is \(\{\text{PriorAbility}\}\), and emphatically not \(\{\text{PriorAbility}, \text{HoursStudied}\}\).
Steps
Read each block, make sure you can say in words what every line does, then run it in your own R session. The chunks are shown for study and are not executed on this site.
Step 1 — Generate data from the diagram
Translate each arrow in the diagram into one line of code. The order matters and it mirrors the diagram: a cause must be drawn before its effect. PriorAbility comes first (it causes everything downstream), then Use (caused by PriorAbility), then HoursStudied (caused by Use and PriorAbility), then Outcome (caused by Use, PriorAbility, and — through the mediator — HoursStudied). The true total Use -> Outcome effect is the \(+3.0\) split across two legs on the outcome line: a direct 2.2 * use plus the part that rides the mediator, 1.0 * hours (and use lifts hours by 0.8, so that leg adds \(1.0 \times 0.8 = 0.8\), for \(2.2 + 0.8 = 3.0\)). The confounder’s total pull on the outcome is still \(+5.0\) — a direct 4.5 * prior plus the \(1.0 \times 0.5 = 0.5\) that rides through hours — and that \(+5.0\) is what leaks into the naive estimate. Splitting the effect this way is what makes the bad control do something: because real signal flows through hours, conditioning on hours removes it.
# Study O — tutoring-center DAG: generate data FROM the assumed diagram.
# Synthetic; seed set. Static, non-executed code (shown for study).
set.seed(45403)

n <- 300                                   # 300 students total (the locked Study O size)

# PriorAbility: a PRE-treatment confounder — common cause of BOTH Use and Outcome.
prior  <- rnorm(n, mean = 0, sd = 1)

# Use: more-prepared students are likelier to use the center  (PriorAbility -> Use).
#   plogis() turns the linear score into a probability; rbinom() flips the coin.
#   The two constants are CALIBRATED to the locked slice: the intercept -0.54 sets
#   the overall use rate near 40% (so E[users] = 120 of 300, the locked 120/180),
#   and the slope 1.34 makes self-selection strong enough that users sit a full
#   1.0 SD above non-users in prior ability — which is exactly what pushes the
#   naive comparison to the locked +8.0 (see the outcome line below).
use    <- rbinom(n, size = 1, prob = plogis(-0.54 + 1.34 * prior))

# HoursStudied: POST-treatment mediator on the path Use -> HoursStudied -> Outcome.
#   Use lifts hours by 0.8; that lift is the FIRST leg of the mediated path.
hours  <- 0.8 * use + 0.5 * prior + rnorm(n)

# Outcome: baseline 76 + a DIRECT Use effect (2.2) + the mediated effect through
#   hours (1.0 * hours) + the confounder's pull (4.5 * prior). Two checks built in:
#   - TOTAL Use effect = 2.2 (direct) + 1.0 * 0.8 (through hours) = +3.0  (locked adjusted).
#   - TOTAL prior pull = 4.5 (direct) + 1.0 * 0.5 (through hours) = +5.0  (the confounding
#     that leaks into the naive +8.0). So the reduced form is 76 + 3.0*use + 5.0*prior,
#     and with the 1.0-SD user/non-user prior gap: naive = 3.0 + 5.0*(1.0) = +8.0,
#     users near 76 + 3 + 5*(0.6) = 82.0 and non-users near 76 + 5*(-0.4) = 74.0.
#   Because part of the +3.0 travels Use -> HoursStudied -> Outcome, holding hours
#   fixed (adjusting for it) SUBTRACTS that slice, so the bad control lands below +3.0.
outcome <- 76 + 2.2 * use + 1.0 * hours + 4.5 * prior + rnorm(n)

study_o <- data.frame(use, prior, hours, outcome)
nrow(study_o)            # 300  (matches the locked total)
table(study_o$use)       # near the locked 120 / 180 (this seed: 114 users, 186 non-users)
Interpretation. You have built a world in which the true total causal effect of using the center is exactly \(+3.0\) points — split across the outcome line into a direct \(2.2\) and a mediated \(0.8\) that travels Use -> HoursStudied -> Outcome — and in which PriorAbility is a pre-treatment common cause of both Use and Outcome. That is the design move: you have assigned nothing (students “chose” Use through a probability that depends on prior), so the data are observational and a backdoor path is open by construction. The total count is \(300\), the locked Study O size. Nothing has been estimated yet; you have only encoded the diagram’s assumptions as a recipe.
Step 2 — The naive estimate (backdoor left open)
Now compare users to non-users with no adjustment at all — the analysis a hurried reader would run. This is a plain difference in group means, which lm(outcome ~ use) reports as the use coefficient.
# NAIVE difference in means: users vs non-users, NO adjustment. Backdoor OPEN.
set.seed(45403)   # seed restated so this block reproduces standalone

mean_user    <- mean(study_o$outcome[study_o$use == 1])   # ~ 82.0  (this seed: 81.9)
mean_nonuser <- mean(study_o$outcome[study_o$use == 0])   # ~ 74.0  (this seed: 73.7)
naive_diff   <- mean_user - mean_nonuser                  # ~ +8.0  (this seed: +8.27; confounded)

naive_lm <- coef(lm(outcome ~ use, data = study_o))["use"]
naive_lm                                                  # same number, via lm
Interpretation. The naive difference is about \(+8.0\) — the locked Study O naive number, with user mean near \(82.0\) and non-user mean near \(74.0\). But you know the true effect is \(+3.0\), so this estimate is inflated by roughly \(+5.0\). That \(+5.0\) is not noise: it is confounding flowing through the open backdoor Use <- PriorAbility -> Outcome. Stronger students both choose the center and score higher, so the naive comparison credits the center for ability it never created. The design reading is blunt: with no random assignment and no adjustment, \(+8.0\) is an association, not a causal effect. A small p-value on this coefficient would not change that — significance cannot close a backdoor (Risk 5).
Step 3 — Adjust for the confounder, then add a bad control
Run the two remaining analyses on the same data. The first adds the pre-treatment confounder PriorAbility to the model — the correct adjustment set — which closes the backdoor. The second also adds the post-treatment mediator HoursStudied, the bad control the diagram warned against.
# ADJUSTED for the confounder only: closes the backdoor. CORRECT adjustment set.
set.seed(45403)

adjusted <- coef(lm(outcome ~ use + prior, data = study_o))["use"]
adjusted                       # ~ +3.0  (this seed: +2.80; recovers the TRUE effect)

# BAD CONTROL: ALSO adjust for the post-treatment mediator HoursStudied.
#   The code runs cleanly — no warning, no error — but the estimate is now wrong.
#   Its target is the DIRECT effect (2.2), not the total +3.0 you asked for.
bad_control <- coef(lm(outcome ~ use + prior + hours, data = study_o))["use"]
bad_control                    # < +3.0  (this seed: +2.00; biased toward 0 —
                               #  "looks careful," answers the wrong question)

# Side by side, so the three numbers tell the story at a glance.
round(c(naive = naive_lm, adjusted = adjusted, bad_control = bad_control), 2)
#   naive   adjusted  bad_control      (this seed: 8.27, 2.80, 2.00 —
#   ~ 8.0     ~ 3.0      < 3.0          open backdoor, closed backdoor, mediator removed)
Interpretation. Adjusting for PriorAbility recovers about \(+3.0\) — the locked adjusted Study O effect, and the total effect you actually built into the simulation. The design move is exact: you stratified on a pre-treatment common cause to block the backdoor path, leaving the causal path Use -> Outcome open. This is the observational analysis at its best, and it lands on the same \(+3.0\) as Study E’s randomized \(d = 3.0\) — the intended parallel. The bad-control fit, which also conditions on the post-treatment mediator HoursStudied, pulls the use coefficient below \(+3.0\). By holding studying fixed you have subtracted off the slice of the effect that travels through Use -> HoursStudied -> Outcome, so you are no longer estimating the total effect you asked for — you have measured a partial “direct effect holding studying fixed” instead (Risk 4). The estimate looks more careful because it has more variables in it, but it answers a different, narrower question, and nothing in the output flags the switch.
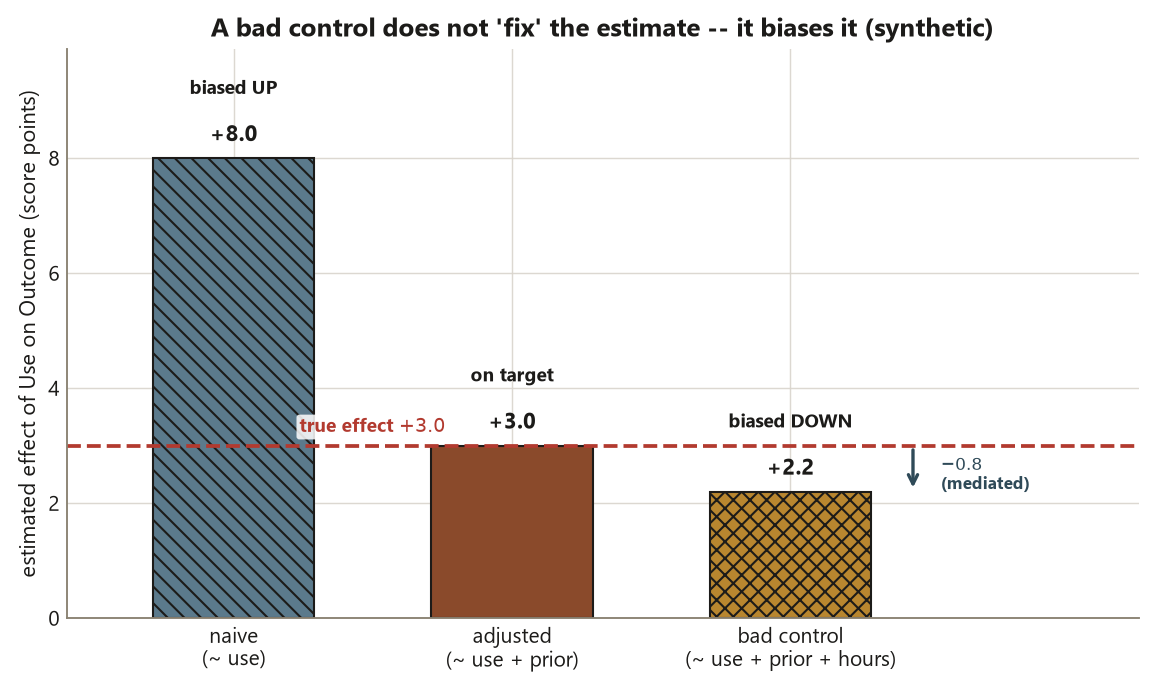
Use effect: the naive \(+8.0\) (backdoor open, biased up), the correctly adjusted \(+3.0\) (on the true effect), and the bad control that also conditions on the post-treatment HoursStudied and lands at \(+2.2\) — biased below the truth. Conditioning on the mediator subtracts the \(0.8\) that travels Use to HoursStudied to Outcome. Synthetic; illustrative.
Verify
This is where computation and reasoning meet. Check three things, in order:
- The counts match the design.
nrow(study_o)is \(300\) andtable(study_o$use)splits into users and non-users near the locked \(120 / 180\) — with the course seed you get exactly \(114 / 186\). If the total is not \(300\), yournis wrong and every downstream number is comparing the wrong-sized world. - The three estimates are ordered as the diagram predicts. With the course seed you should see
naive\(= +8.27\) (open backdoor; the estimator centers on the locked \(+8.0\)),adjusted\(= +2.80\) (backdoor closed; centers on the true \(+3.0\)), andbad_control\(= +2.00\) (mediator removed real signal; its target is the direct \(2.2\)). The naive-minus-adjusted gap — \(5.5\) this seed, \(\approx +5.0\) in expectation — is the confounding the locked slice names. A single \(n = 300\) run wobbles around these centers (the naive by roughly \(\pm 1\) point across seeds; the 800-run figure at the top shows the centers themselves). Ifadjustedlands far from \(+3.0\), re-check that theoutcomeline carries2.2 * use + 1.0 * hours(a direct \(2.2\) plus the \(0.8\) that rides throughhours, totalling the locked \(+3.0\)) and thatset.seed(45403)ran before the data were generated. - The truth is recoverable only by the correct set. Because you built in the true total effect of \(+3.0\), the single honest answer is the one that returns it. Confirm that only
outcome ~ use + priordoes so — not the naive model (too big, backdoor open) and not the bad-control model (too small, mediator adjusted). The verification is therefore a design check, not a fit check: a higher \(R^2\) on the bad-control model does not make it the right model.
A sentence to write for yourself once the numbers check out: “The naive \(+8.0\) is an association inflated by an open backdoor through prior ability; the adjusted \(+3.0\) is the causal effect, recoverable because the confounder was measured and is pre-treatment; the bad-control number is biased toward zero because HoursStudied is post-treatment.” If you can write that, the lab has done its job — and notice that the diagram, not any line of regression output, is what licensed every word of it.
A standing caveat to carry forward: this simulation succeeds because you know the confounder and measured it. In a real study, an unmeasured common cause would leave a backdoor open that no adjustment can close, and the estimate would be wrong with no warning at all. That irreducible limit of observational evidence is exactly why random assignment — which closes every backdoor by design — is worth so much (Risk 15).
Transfer challenge (ungraded)
For a new context, sketch and simulate a different diagram: regular exercise (\(Z\)) on a cardiovascular-health score (\(Y\)), with Age as a pre-treatment confounder (Age -> Exercise, Age -> Health) and OwnsTracker as a collider (Exercise -> OwnsTracker <- Health). The numbers here are illustrative and distinct from the locked slice. Generate the data with the true Exercise -> Health effect set to \(+4\), then estimate it three ways: naive, adjusted for Age, and — the trap — restricted to tracker owners (which conditions on the collider). Predict before you run it that the age-adjusted estimate lands near \(+4\) while selecting on OwnsTracker drives it toward \(+1\) or below, because conditioning on a common effect opens a spurious path. This is the mirror image of the mediator case: a mediator removes real signal, a collider manufactures fake signal, and both are bad controls (Risk 4, Risk 7).
AI use note
If you used an AI assistant anywhere in this lab, log it here. The load-bearing column is Verification — how you confirmed the output yourself, against the diagram and the locked numbers, rather than trusting it.
| Tool | Purpose | Verification |
|---|---|---|
| AI chat assistant | Explain why adjusting for HoursStudied biases the estimate |
Confirmed against the week note: HoursStudied is post-treatment on Use -> HoursStudied -> Outcome, so it is a mediator; re-ran the three models and saw bad_control fall below the true \(+3.0\) |
| AI coding helper | Draft the lm() calls for the naive, adjusted, and bad-control models |
Read each formula against the diagram — ~ use (open backdoor), ~ use + prior (correct set), ~ use + prior + hours (bad control) — and checked the estimates ordered \(\approx 8.0 > \approx 3.0 > \text{bad}\) |
| AI assistant | Sanity-check that the simulated naive difference reproduces the locked \(+8.0\) | Computed the user/non-user means by hand from study_o and matched them to the locked \(82.0 / 74.0\); did not accept the AI’s number without recomputing |
The rule for this course: AI may help you draft or explain code, but you own the design reading. An assistant cannot tell you whether a variable is pre- or post-treatment — only the diagram and your knowledge of the study can, and that judgment is the part being learned.
See also
- Week 10 — Causal diagrams and backdoor reasoning — the companion note where this diagram and the \(+8.0 \to +3.0\) reasoning are developed.
- Week 9 — Observational studies — where the naive-vs-adjusted shrinkage first appears.
- Causal-diagram guide — the standalone reference for drawing and reading DAGs.
- Design glossary — confounder, mediator, collider, adjustment set, bad control.
- Lab 6 — Blocking vs complete randomization — the experimental counterpart, where random assignment closes the backdoor for you.
The graded deliverable, its rubric, and due date live in Blackboard (the LMS) — this page is study and practice only.