Week 8 — Interactions in designed studies
When the effect of one factor depends on another factor
The week question
Last week you ran a 2×2 factorial experiment and read off two main effects — a tidy average effect for each factor on its own. This week asks a sharper question that the factorial design was built to answer, and that no one-factor experiment can: does the effect of one factor depend on the level of the other factor? When the answer is yes, you have an interaction, and a single averaged “main effect” can quietly hide the most interesting part of the story.
Concretely: in the Focus study-skills experiment, the workshop (factor A) raises the gain score. Peer tutoring (factor B) also raises it. But is the workshop’s boost the same size whether or not a student also gets tutoring? If the workshop helps more when paired with tutoring, the two factors reinforce each other, and the design move this week is to detect, measure, and report that dependence rather than average it away.
Why this matters
The whole point of running both factors in one randomized experiment — instead of two separate one-factor experiments — is that a factorial design lets you estimate the interaction. Two separate experiments can each give you a main effect, but neither can tell you whether the factors work differently together than apart. That joint information is the factorial design’s signature payoff, and the interaction is where it lives.
It matters for the claim you are allowed to make. Because A and B were randomly assigned here, you earn causal language: the workshop causes a gain, and the interaction tells you that the size of that caused effect changes with tutoring. If you reported only “the workshop adds about 4.5 points on average” you would be giving a number that is true on average but matches neither real condition a student is actually in — a student without tutoring gets a smaller boost, and a student with tutoring gets a larger one. Decisions get made on cell means, not on an average that describes no one.
It also matters defensively. Reading a lone main effect when a real interaction is present is a named design error (Risk 8), and it is easy to commit because the main-effect number is the one statistical software prints first. This week trains you to check the interaction before you state a main effect.
Learning goals
By the end of this week you should be able to:
- Define an interaction as “the effect of one factor depends on the level of the other,” and distinguish it from a main effect.
- Compute a 2×2 interaction as a contrast of contrasts from the four cell means, and read its sign as synergy (positive) or antagonism (negative).
- Read an interaction plot — recognize that non-parallel lines signal an interaction and parallel lines signal its absence.
- Explain why a lone “main effect of A” can mislead when the interaction is large, and decide when to report the cells rather than the averaged effect.
- Name the design context: what was randomly assigned, what claim the randomization licenses, and why an interaction estimate from this design is causal while the same pattern in observational data would not be.
Core vocabulary
- Factor / level — a deliberately varied condition (factor A = Focus workshop; factor B = peer tutoring) and its settings (here each is no/yes).
- Cell — one combination of factor levels (e.g. workshop-yes, tutoring-no); its mean is a cell mean. With two two-level factors there are \(2\times2=4\) cells.
- Simple effect — the effect of one factor at a fixed level of the other (e.g. the workshop effect among tutored students only). Interactions are about how simple effects differ.
- Main effect — the effect of one factor averaged over the levels of the other.
- Interaction (AB) — the degree to which the simple effect of A changes across the levels of B (equivalently, of B across A). It is symmetric: \(A\times B\) and \(B\times A\) are the same number.
- Synergy / antagonism — a positive interaction means the factors reinforce (the combined effect exceeds the sum of separate effects); a negative interaction means they offset.
- Interaction plot — cell means plotted with one factor on the x-axis and one line per level of the other factor; non-parallel lines indicate an interaction.
Concept development
An interaction is a contrast of contrasts
Start with the four cell means from the Focus 2×2 factorial (the locked recurring slice; synthetic, seed set). Each is a mean gain score in points, with factor A = workshop and factor B = tutoring:
\[ \begin{aligned} \bar y_{\text{no,no}} &= 5.0, &\qquad \bar y_{\text{yes,no}} &= 8.0, \\ \bar y_{\text{no,yes}} &= 7.0, &\qquad \bar y_{\text{yes,yes}} &= 13.0. \end{aligned} \]
A simple effect of the workshop is a single contrast: hold tutoring fixed, then subtract. Without tutoring, turning the workshop on moves the gain from \(5.0\) to \(8.0\), a simple effect of \(8 - 5 = 3.0\) points. With tutoring, it moves the gain from \(7.0\) to \(13.0\), a simple effect of \(13 - 7 = 6.0\) points. The workshop helps in both conditions — but it helps twice as much when tutoring is also present.
The interaction asks whether those two simple effects are equal. It is the difference between the two contrasts, scaled by one half so it is symmetric in A and B:
\[ AB = \tfrac{1}{2}\big[(\,\bar y_{\text{yes,yes}} - \bar y_{\text{no,yes}}\,) - (\,\bar y_{\text{yes,no}} - \bar y_{\text{no,no}}\,)\big] = \tfrac{1}{2}\big[(13 - 7) - (8 - 5)\big] = \tfrac{1}{2}(6 - 3) = +1.5 . \]
The interaction is \(+1.5\) points. Because A and B were randomly assigned to the 60 students, this is a causal statement: the workshop’s causal effect on the gain score is larger by about \(1.5\) points when a student is also tutored. The half-point scaling is a convention so the number sits on the same per-factor scale as a main effect; what carries the meaning is its sign and size, not the factor of \(\tfrac12\).
Synergy versus antagonism — read the sign
The sign of the interaction names the kind of dependence:
- Positive (synergy): the factors reinforce. Here \(AB = +1.5 > 0\): the workshop and tutoring together do more than you would predict by adding their separate boosts. The combined cell (\(13.0\)) overshoots the “no-interaction” prediction of \(5 + 3 + 2 = 10\) (baseline plus each simple effect) by exactly \(3\) points, and \(\tfrac12 \times 3 = 1.5\) — the same \(+1.5\), seen as overshoot.
- Negative (antagonism): the factors offset; one is less useful when the other is already present (a ceiling, redundancy, or interference). The combined cell would undershoot the additive prediction.
- Zero (additivity): the simple effects are equal, the factors act independently, and a single main effect tells the whole story. This is the only case in which reporting a lone main effect is safe.
So the sign is not a technicality. Positive here means a real-world recommendation — pair the workshop with tutoring — that neither factor’s main effect, taken alone, would have surfaced.
Why a lone main effect can mislead
Recall last week’s main effects for the same cells: the main effect of A (the workshop, averaged over tutoring) is
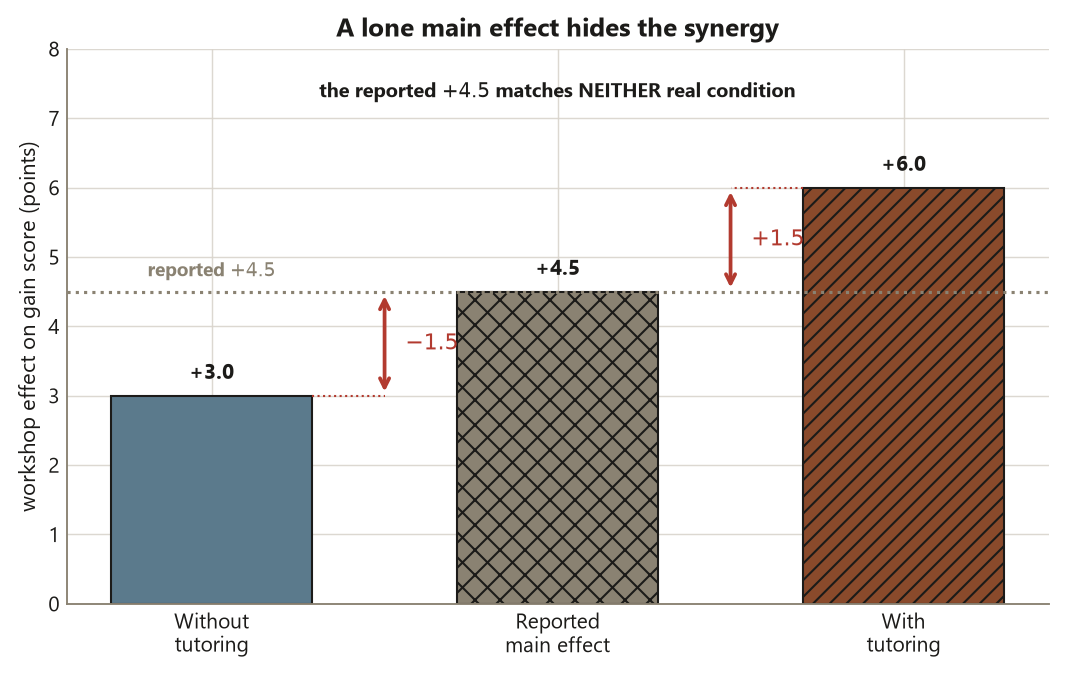
\[ A = \tfrac{(8 + 13)}{2} - \tfrac{(5 + 7)}{2} = 10.5 - 6.0 = +4.5 , \]
and the main effect of B (tutoring) is \(\tfrac{(7+13)}{2} - \tfrac{(5+8)}{2} = 10.0 - 6.5 = +3.5\). The headline “+4.5 points for the workshop” is a genuine average — but it describes no student who actually exists in the study. A student without tutoring gets only \(+3.0\); a student with tutoring gets \(+6.0\). The \(+4.5\) is the midpoint of two different realities, and the gap between them is precisely what the \(+1.5\) interaction measures: the simple effects spread \(\pm 1.5\) around the main effect (\(4.5 - 1.5 = 3.0\) and \(4.5 + 1.5 = 6.0\)). When that spread is large relative to the effect, the cells are the story and the average is a summary that hides it (Risk 8). The discipline this week is: compute the interaction first, and only collapse to a main effect once you have confirmed the interaction is negligible.
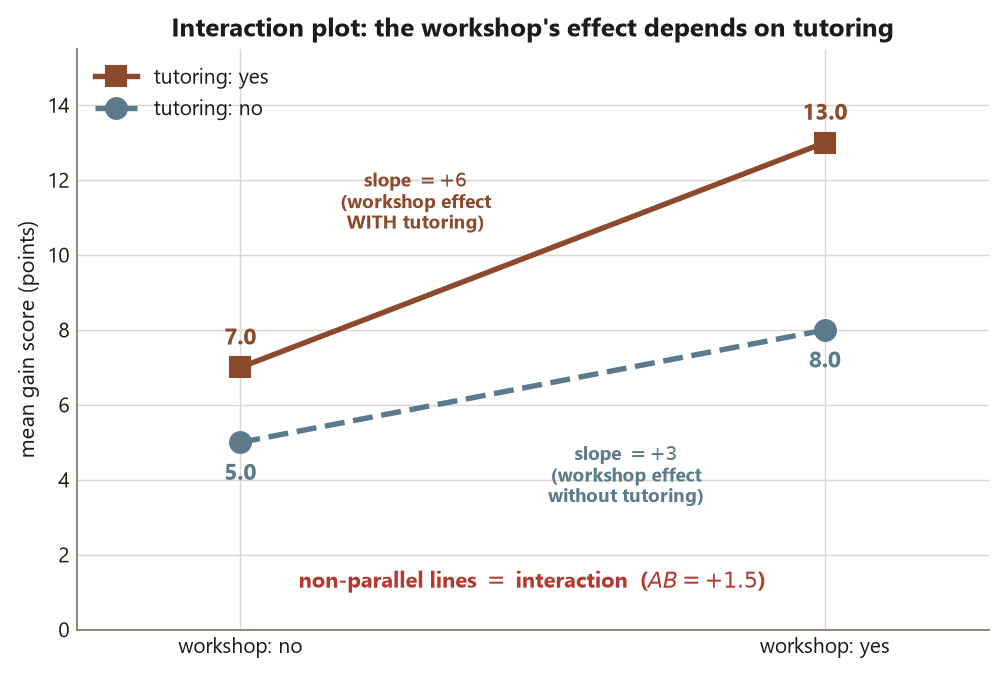
The interaction plot — look for non-parallel lines
The fastest way to see an interaction is to plot the four cell means. Put one factor (say tutoring) on the x-axis, and draw one line per level of the other factor (one line for workshop-no, one for workshop-yes), connecting that factor’s two cell means:
gain
 13 |                                  • (workshop-yes, tutoring-yes)
    |                            ,-'
  8 | • (workshop-yes, no)  ,-'
    |                  ,-'
  7 |              ,-----------------• (workshop-no, tutoring-yes)
  5 | •-----------'   (workshop-no, tutoring-no)
    +----------------------------------------- tutoring
        no                          yes
This sketch deliberately puts tutoring on the x-axis, whereas the rendered figures put the workshop on the x-axis; because an interaction is symmetric in \(A\) and \(B\), both axis choices show the same non-parallelism, so drawing it both ways is a check rather than a contradiction.
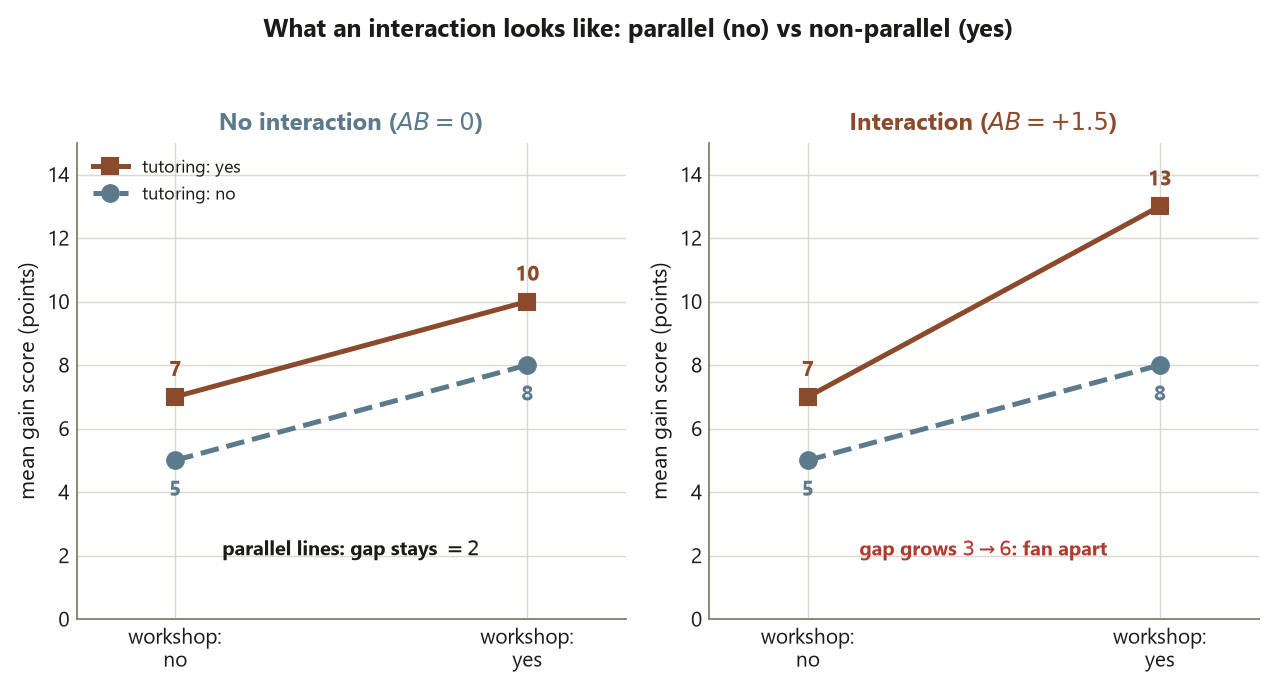
The two lines are not parallel: the workshop-yes line rises more steeply (from \(8\) at tutoring-no to \(13\) at tutoring-yes, a rise of \(13 - 8 = 5\)), while the lower workshop-no line rises only by \(7 - 5 = 2\). Non-parallel lines = interaction. If the interaction were zero, the two lines would be parallel — the vertical gap between them constant across tutoring levels — and you could read a single workshop effect off either line. The amount of non-parallelism is the interaction: here the vertical gap between the lines (the workshop effect, read at a fixed tutoring level) grows from \(8 - 5 = 3\) at tutoring-no to \(13 - 7 = 6\) at tutoring-yes. That gap doubles — it widens by \(6 - 3 = 3\) points — and the interaction is exactly half of that widening, \(\tfrac12 \times 3 = +1.5\). The lines fan apart, which is the synergy made graphical. (The plotted figure is shown as static, non-executed in this diagnostic; its R is below and is not run.)
Worked examples
Worked example — the Focus 2×2 interaction (recurring study slice)
Design. A completely randomized 2×2 factorial experiment: \(n = 60\) students, each randomly assigned to one of four cells crossing the Focus workshop (A: no/yes) with peer tutoring (B: no/yes). Random assignment is what licenses causal language; the outcome \(Y\) is the timed problem-solving gain score in points. The unit of analysis is the individual student — the grain at which assignment happened (Risk 3).
Computation. From the four locked cell means \(5.0,\ 8.0,\ 7.0,\ 13.0\):
# Focus 2x2 factorial — interaction as a contrast of contrasts
# Synthetic cell means (gain in points); set.seed used only to dramatize
# the random ASSIGNMENT of 60 students to the four cells (not executed here).
set.seed(45403)

# Cell mean gains: rows = workshop A (no/yes), cols = tutoring B (no/yes)
cell <- matrix(c(5.0, 7.0,    # A = no  : (B=no, B=yes)
                 8.0, 13.0),  # A = yes : (B=no, B=yes)
               nrow = 2, byrow = TRUE,
               dimnames = list(A = c("no","yes"), B = c("no","yes")))

simple_A_at_Bno  <- cell["yes","no"]  - cell["no","no"]   # 8 - 5  = 3.0
simple_A_at_Byes <- cell["yes","yes"] - cell["no","yes"]  # 13 - 7 = 6.0

AB <- 0.5 * (simple_A_at_Byes - simple_A_at_Bno)          # 0.5*(6 - 3) = +1.5
mainA <- mean(cell["yes",]) - mean(cell["no",])           # 10.5 - 6.0 = +4.5
mainB <- mean(cell[,"yes"]) - mean(cell[,"no"])           # 10.0 - 6.5 = +3.5

# simple_A_at_Bno  = 3.0   (workshop effect WITHOUT tutoring)
# simple_A_at_Byes = 6.0   (workshop effect WITH tutoring)
# AB    = +1.5  (positive synergy)
# mainA = +4.5 ; mainB = +3.5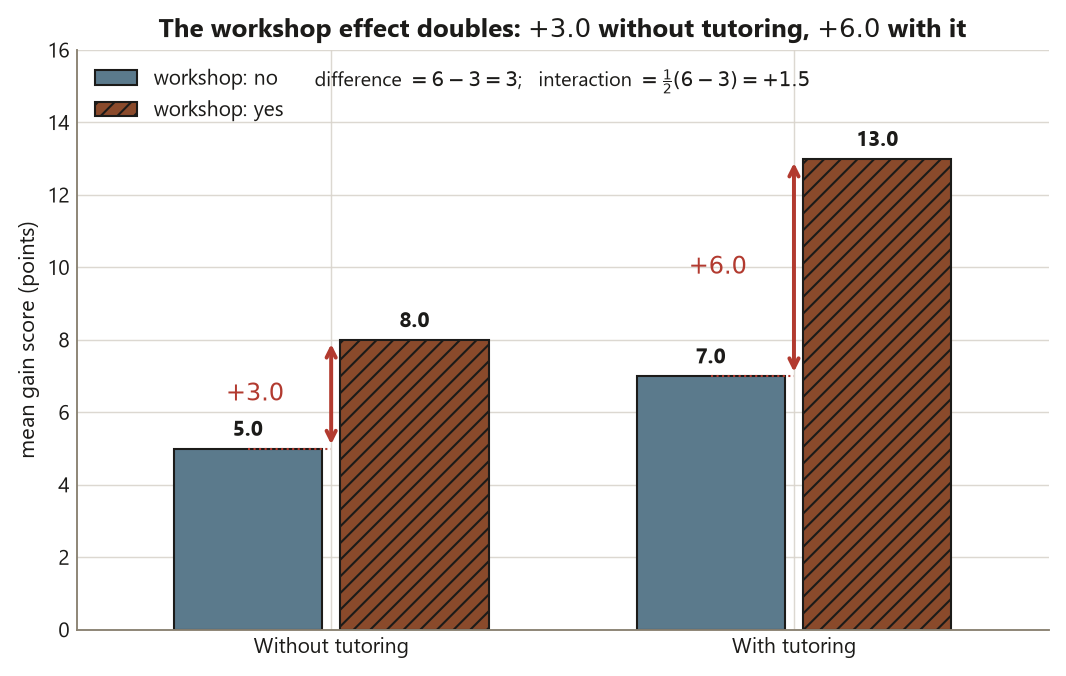
Interpretation. The interaction is \(AB = +1.5\) points, a positive synergy: the workshop’s caused effect on the gain score is \(3.0\) points without tutoring but \(6.0\) points with tutoring, so the two interventions reinforce each other. Because students were randomly assigned, this is a causal claim about the program — adding tutoring makes the workshop work harder — not merely an association. What the claim is not: it is not a population estimate (these 60 students were not drawn by random sampling from a defined population, so the size of the synergy need not generalize beyond this study), and it is not a license to report only the \(+4.5\) main effect, which describes the average of two real conditions and matches neither.
Worked example — a drug × diet trial (transfer to a new context)
Design. A different randomized 2×2 factorial in a clinical context. Researchers randomly assign \(200\) patients across four cells crossing a blood-pressure drug (A: placebo/drug) with a prescribed low-sodium diet (B: usual/low-sodium). The outcome is the drop in systolic blood pressure (mm Hg) over eight weeks; numbers below are illustrative and distinct from the Focus study. Suppose the cell mean drops are:
\[ \bar y_{\text{placebo,usual}} = 2,\quad \bar y_{\text{drug,usual}} = 4,\quad \bar y_{\text{placebo,low}} = 5,\quad \bar y_{\text{drug,low}} = 13 . \]
Computation. The drug’s simple effect is \(4 - 2 = 2\) mm Hg on the usual diet, but \(13 - 5 = 8\) mm Hg on the low-sodium diet. The interaction is
\[ AB = \tfrac{1}{2}\big[(13 - 5) - (4 - 2)\big] = \tfrac{1}{2}(8 - 2) = +3 \ \text{mm Hg}, \]
while the drug’s main effect, averaged over diet, is \(\tfrac{(4+13)}{2} - \tfrac{(2+5)}{2} = 8.5 - 3.5 = +5\) mm Hg.
Interpretation. This is a strong positive interaction: the drug barely moves blood pressure on the usual diet (\(+2\)) but is highly effective when paired with the low-sodium diet (\(+8\)). Because the drug and diet were randomly assigned, the synergy is a causal finding — the drug essentially requires the diet to work well. Reporting only the \(+5\) main effect would badly mislead a clinician: prescribing the drug without the diet delivers roughly \(+2\), not \(+5\). As with Focus, the design move is to read the cells, name the interaction, and only then decide whether an averaged main effect is a fair summary (here it is not). The same pattern observed without random assignment — say, in patients who chose their own diets — would be an association open to confounding, not a causal synergy.
A common mistake
Reading a main effect when a large interaction is present (Risk 8). The tempting move is to glance at the workshop’s “+4.5 points” — the number software prints first — and report it as the effect of the workshop. But when \(AB = +1.5\) is non-trivial relative to the effect, that average describes neither real condition: the workshop adds \(+3.0\) without tutoring and \(+6.0\) with it. Stating the \(+4.5\) alone is technically a true average and practically a misdirection, because the recommendation that actually follows from the data — pair the workshop with tutoring — lives in the interaction, not the main effect.
The fix is an order-of-operations rule: compute and inspect the interaction before stating any lone main effect. Draw the interaction plot; if the lines are clearly non-parallel, report the cells (or the simple effects) and treat the main effect as, at most, a coarse summary you flag as such. Only when the interaction is negligible — lines effectively parallel — does a single main effect tell the whole story. A related slip is forgetting that the interaction is symmetric: “the workshop’s effect depends on tutoring” and “tutoring’s effect depends on the workshop” are the same \(+1.5\) finding seen from two sides, not two separate results.
Low-stakes self-checks (ungraded)
These are for your own practice — ungraded, no submission.
- From cell means \(\bar y_{\text{no,no}}=5\), \(\bar y_{\text{yes,no}}=8\), \(\bar y_{\text{no,yes}}=7\), \(\bar y_{\text{yes,yes}}=13\), write the two simple effects of the workshop and confirm the interaction equals \(+1.5\). Which condition shows the larger workshop effect?
- Suppose instead the with-tutoring cell were \(10.0\) (not \(13.0\)). Recompute the interaction. Is it positive, negative, or zero? Would a lone main effect of A now be a fair summary?
- In words, what would the interaction plot look like if \(AB = 0\)? Sketch the two lines and describe their relationship.
- State, for the Focus study, exactly which design feature lets you call the \(+1.5\) a causal synergy rather than an association — and name one thing the study still cannot claim.
- In the drug × diet transfer example, explain to a clinician in one sentence why “the drug lowers blood pressure by 5 mm Hg” is a misleading thing to say.
Reading and source pointer
For background on interaction between factors in designed experiments, see the experiments material in Introduction to Modern Statistics (Çetinkaya-Rundel & Hardin) — the sections that introduce factorial structure and how a factor’s effect can depend on another factor. The primary source for this week is the course’s own instructor notes, which carry the Focus 2×2 example, the contrast-of- contrasts computation, and the read-the-cells discipline. These notes are the course’s own synthesis, grounded in but not copied from the sources. No prose, examples, figures, or exercises are reproduced from any source.
Public vs. graded
These notes, the examples, and the practice here are public and ungraded — study material only. No graded prompts, answer keys, rubrics, point values, or due dates appear on this site. Graded design checkpoints, weekly quizzes, design memos and homework, applied design labs, the midterm, the final design project, and the final exam live in Blackboard (the LMS), which is authoritative for due dates, submissions, and grades. If this page and Blackboard ever disagree, follow Blackboard.
Looking ahead
Next week the course pivots from experiments to observational studies, where the units were not randomly assigned. You will meet the tutoring-center study — students who chose to use the center versus those who did not — and see why a naive \(+8.0\) difference is an association, not a causal effect, until you reckon with the confounding that self-selection introduces. The factorial discipline carries over: just as an interaction warns you not to trust a lone main effect, confounding will warn you not to trust a lone difference in means.
See also
- Week 7 — Factorial experiments — the main effects this week’s interaction sits on top of.
- Week 9 — Observational studies — association versus causation when nothing was assigned.
- Design glossary — factor, level, main effect, interaction, synergy/antagonism.
- Design reference — the design families (CRD, RCBD, paired, factorial) side by side.
- Causal-diagram guide — how randomization licenses the causal reading of an interaction.