Week 7 — Factorial experiments and the midterm
Two factors at once: main effects, efficiently estimated
The week question
You can run a randomized experiment on one treatment at a time — the Focus workshop in Week 5, then a separate trial for peer tutoring later. But suppose you want to study both the workshop and tutoring, and you only have so many students. Should you run two separate one-factor experiments, or can you study both factors in a single design and get more for the same effort? The week’s question is: when you vary two factors at once in one randomized experiment, what can you estimate, and what makes the factorial design more efficient than running the factors one at a time?
The short answer is that a 2×2 factorial design lets you estimate the main effect of each factor — its average effect across the levels of the other factor — using every unit for both contrasts. The same students inform both estimates. That is the efficiency. The catch, which we set up here and pay off in Week 8, is that an average effect can hide a story that lives in the cells.
Why this matters
Real interventions rarely arrive alone. A campus does not just run a study-skills workshop; it also runs tutoring, advising, supplemental instruction, and more. If you study these one at a time, you learn each factor’s effect in isolation but you spend a separate experiment on each, and you never learn whether they work together. A factorial design changes both of those. It studies several factors in one experiment, so each unit contributes to every main-effect estimate, and it makes the combination of factors visible.
This matters for the design memo you will eventually write because the choice between “one factor at a time” and “factorial” is a design choice with consequences for what your evidence can claim. A factorial design, randomized, still earns causal claims about each factor — random assignment is what licenses that — but it earns them more cheaply, and it opens the door to a question a one-factor design cannot even ask: does the effect of one factor depend on the other? Holding that question open is the whole reason the midterm covers factorial designs and the reason Week 8 exists.
The midterm is Friday, October 9, in class (a calendar fact only — see the boundary footer below for where the graded contract actually lives). It covers everything through factorial designs: statistical questions, units, measurement, random sampling versus random assignment, bias, confounding, validity, completely randomized experiments, blocking, and paired and factorial designs. This week’s note is the last new design family before that line.
Learning goals
By the end of this week you should be able to:
- Identify the factors and levels in a multi-factor experiment, and name the experimental unit that was randomly assigned to a treatment combination.
- Read a 2×2 cell-means table and lay out which cells go into each contrast.
- Compute the main effect of a factor as its average effect across the levels of the other factor, and interpret the number as a causal statement licensed by random assignment.
- Explain why a factorial design is more efficient than running one factor at a time.
- Recognize that a lone main effect can mislead when an interaction is present (Risk 8), and know to check the cells before reporting an average effect — the move you will make fully in Week 8.
Core vocabulary
- Factor. A treatment variable the experimenter deliberately sets. In the Focus 2×2, the two factors are \(A\) = the study-skills workshop and \(B\) = peer tutoring.
- Level. A setting a factor can take. Each factor here has two levels, no and yes, which is what makes the design “2×2.”
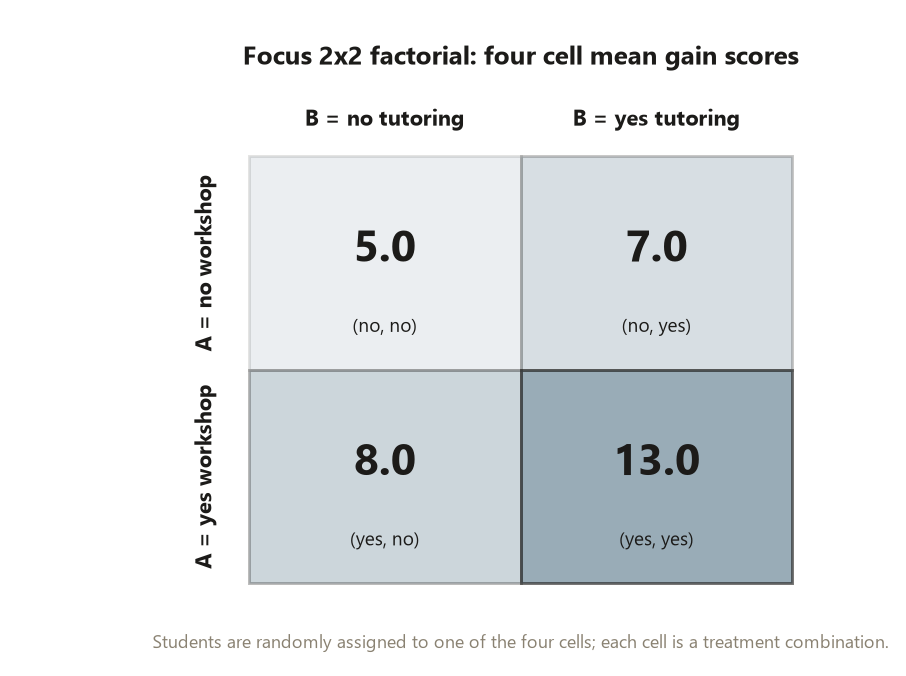
- Treatment combination (cell). One choice of level for every factor — here, one of the four combinations (no, no), (yes, no), (no, yes), (yes, yes). Units are randomly assigned to cells; the cell is the treatment.
- Cell mean. The mean outcome among the units assigned to one cell. The four cell means are the raw material for every factorial contrast.
- Main effect. The average effect of moving one factor from its low to its high level, averaged over the levels of the other factor. There is one main effect per factor.
- Interaction. The extent to which the effect of one factor depends on the level of the other. Previewed here, computed in Week 8. A non-trivial interaction is the reason a main effect can be a half-truth (Risk 8).
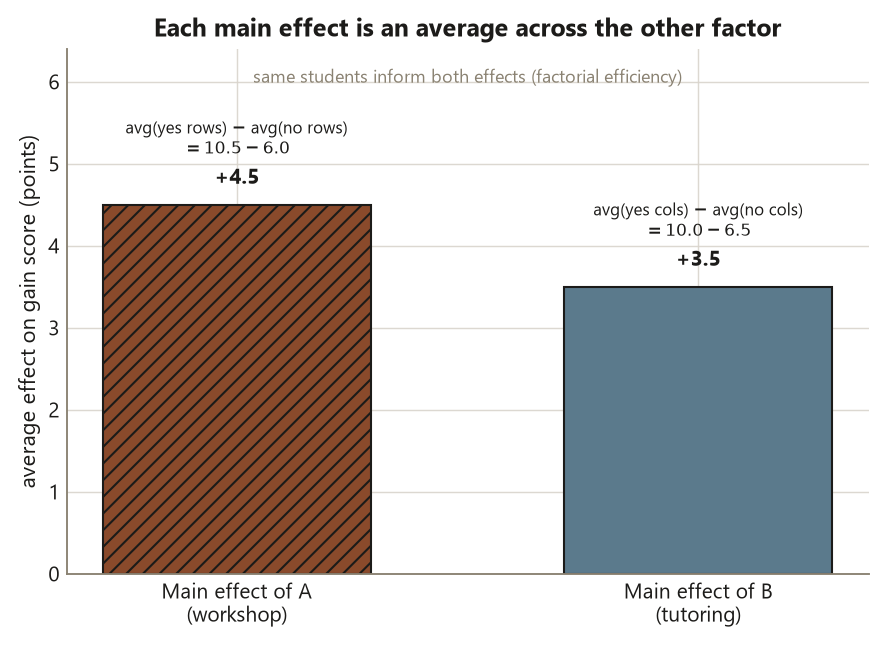
- Factorial efficiency. Because every unit contributes to both main-effect contrasts, a factorial design estimates several effects from one experiment — more information for the same number of units.
Concept development
Factors, levels, and the experimental unit
A factorial experiment varies more than one factor in the same study. In the Focus 2×2 (Study E, our recurring randomized experiment — synthetic; seed set), there are two factors, each with two levels:
- Factor \(A\) — the study-skills workshop, at levels no and yes.
- Factor \(B\) — peer tutoring, at levels no and yes.
The two factors with two levels each produce \(2 \times 2 = 4\) treatment combinations — the four cells. Students are randomly assigned to a cell. That random assignment is the design move that licenses causal language about each factor: because the cells are formed by a chance mechanism, the groups are comparable in expectation on everything pre-treatment, so a difference between them is attributable to the treatment, not to who happened to land where. The experimental unit is the individual student — the grain at which assignment happened, and therefore the grain at which you must analyze (Risk 3). The outcome \(Y\) is the timed problem-solving gain score in points, the same outcome the Focus experiment has used since Week 5.
Note what is not happening: students were not randomly sampled from a population, so the design earns a causal claim about these students, not a population-coverage claim about all undergraduates. Sampling and assignment are independent design choices, and this experiment uses assignment only.
The main effect: an average across the other factor’s levels
The four cell mean gains in the Focus 2×2 are locked numbers:
| \(B\) = no tutoring | \(B\) = yes tutoring | |
|---|---|---|
| \(A\) = no workshop | \(5.0\) | \(7.0\) |
| \(A\) = yes workshop | \(8.0\) | \(13.0\) |
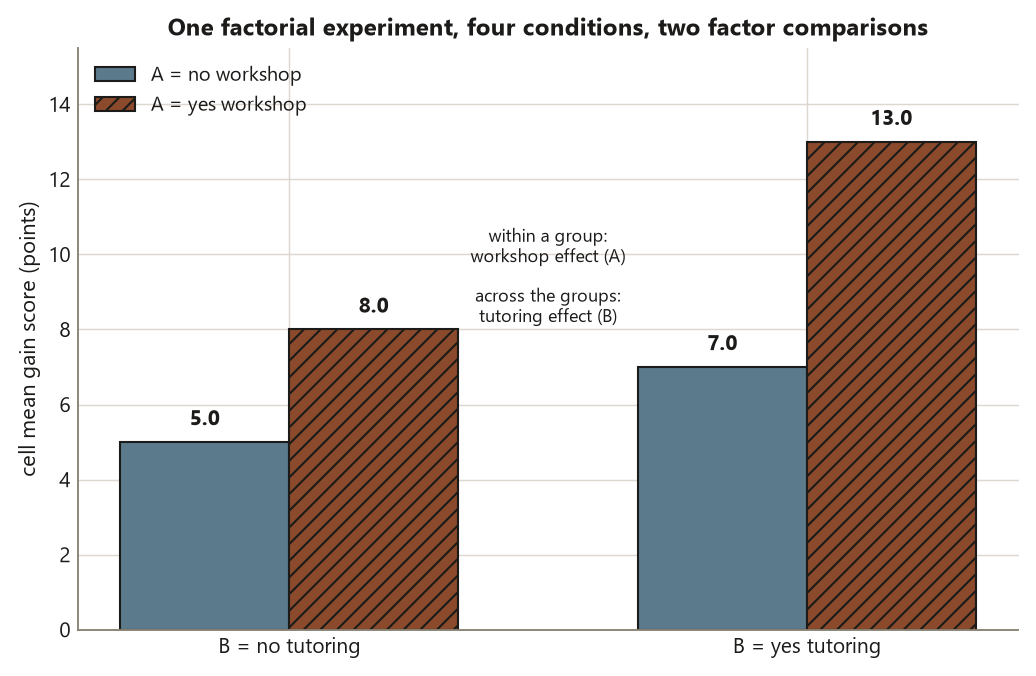
The main effect of \(A\) asks: averaging over whether tutoring was present, how much does the workshop move the gain score? You average the two “workshop = yes” cells and subtract the average of the two “workshop = no” cells:
\[ \text{main effect of } A = \frac{(8.0 + 13.0)}{2} - \frac{(5.0 + 7.0)}{2} = 10.5 - 6.0 = +4.5 . \]
The workshop raises the gain score by \(+4.5\) points on average across tutoring levels. Because assignment to the workshop was random, this is a causal statement about the workshop’s average effect in this experiment — not merely an association.
The main effect of \(B\) is symmetric — average over whether the workshop was present:
\[ \text{main effect of } B = \frac{(7.0 + 13.0)}{2} - \frac{(5.0 + 8.0)}{2} = 10.0 - 6.5 = +3.5 . \]
Peer tutoring raises the gain score by \(+3.5\) points on average across workshop levels — again a causal average effect, licensed by random assignment to tutoring. Each main effect is the average effect of one factor; the word “average” is doing real work, because it averages over the other factor’s two levels.
Why factorial beats one-factor-at-a-time
Suppose instead you ran two separate experiments — one comparing workshop versus none (holding tutoring off), and a second comparing tutoring versus none (holding the workshop off). To get the same precision on each effect, each of those one-factor experiments would need its own full set of units, and you would learn nothing about the (yes, yes) cell where both are on.
In the 2×2 factorial, every unit contributes to both main-effect contrasts at once. The students in the (yes, yes) and (yes, no) cells help estimate the workshop effect; the students in the (yes, yes) and (no, yes) cells help estimate the tutoring effect; the (yes, yes) students do double duty. So one experiment with the same total number of units delivers two main effects, each using all the data — roughly the information of two separate experiments for the price of one. That is factorial efficiency, and it is a design argument, not a software one.
There is a second, larger payoff that one-factor-at-a-time designs structurally cannot deliver: because the factorial design includes the (yes, yes) cell, it can ask whether the two factors combine in a way that differs from the sum of their separate effects. That question is the interaction, and it is the reason a main effect alone can mislead.
Reading the cells before trusting an average (the interaction preview)
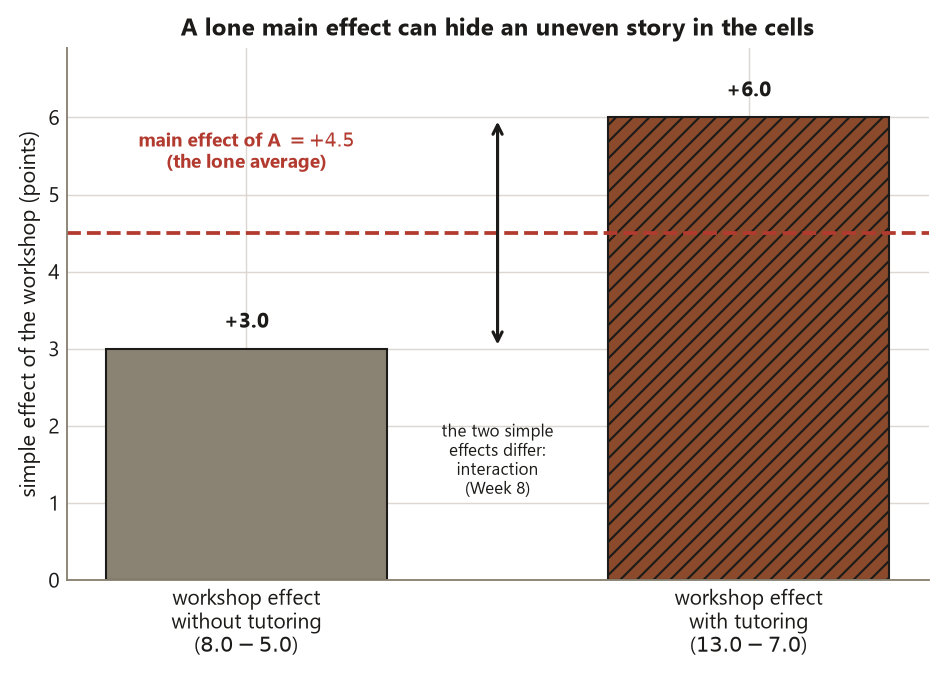
Look again at the cell means. Without the workshop, tutoring moves the gain from \(5.0\) to \(7.0\), a lift of \(+2.0\). With the workshop, tutoring moves the gain from \(8.0\) to \(13.0\), a lift of \(+5.0\). Tutoring’s effect is not the same at both levels of the workshop — it is larger when the workshop is also present. Equivalently, the workshop’s effect is \(+3.0\) without tutoring (\(8.0 - 5.0\)) and \(+6.0\) with it (\(13.0 - 7.0\)).
That difference between simple effects is exactly what an interaction measures, and it is non-zero here. When an interaction is present, the single number “main effect of \(A = +4.5\)” is a true average but a potentially misleading summary: it averages a \(+3.0\) and a \(+5.0\) into one figure that describes neither cell exactly. The discipline this week is to check the cells before you report a lone main effect — and to flag, honestly, that the average may be hiding a dependence. Week 8 computes the interaction number itself and shows how to read and plot it; this week you only need to notice that the cells are not telling one flat story.
Worked examples
Worked example — the Focus 2×2 factorial (recurring study slice)
Design. Study E, the Focus study-skills experiment, run as a 2×2 factorial. Factor \(A\) = workshop (no/yes), factor \(B\) = peer tutoring (no/yes). Students are randomly assigned to one of the four cells; the unit is the student; the outcome is the timed problem-solving gain score in points. Data are synthetic; seed set.
Cell means (locked). \((\text{no}, \text{no}) = 5.0\), \((\text{yes}, \text{no}) = 8.0\), \((\text{no}, \text{yes}) = 7.0\), \((\text{yes}, \text{yes}) = 13.0\).
Computation. The two main effects are average contrasts over the other factor’s levels:
\[ \begin{aligned} \text{main effect of } A &= \tfrac{1}{2}(8.0 + 13.0) - \tfrac{1}{2}(5.0 + 7.0) = 10.5 - 6.0 = +4.5, \\[4pt] \text{main effect of } B &= \tfrac{1}{2}(7.0 + 13.0) - \tfrac{1}{2}(5.0 + 8.0) = 10.0 - 6.5 = +3.5 . \end{aligned} \]
The same arithmetic in static, non-executed R (shown as teaching code, not run on this site):
set.seed(45403)  # locked course seed; data are synthetic

# Focus 2x2 factorial cell mean gains (points), Study E
cells <- matrix(
  c(5.0, 7.0,    # A = no workshop : (B=no, B=yes)
    8.0, 13.0),  # A = yes workshop: (B=no, B=yes)
  nrow = 2, byrow = TRUE,
  dimnames = list(A = c("no", "yes"), B = c("no", "yes"))
)

# Main effect of A: average the A=yes row, minus average the A=no row
main_A <- mean(cells["yes", ]) - mean(cells["no", ])   # 10.5 - 6.0 = +4.5

# Main effect of B: average the B=yes column, minus average the B=no column
main_B <- mean(cells[, "yes"]) - mean(cells[, "no"])   # 10.0 - 6.5 = +3.5

# Simple effects of A, to see whether the average tells one story
simple_A_noB  <- cells["yes", "no"]  - cells["no", "no"]   #  8 - 5  = +3.0
simple_A_yesB <- cells["yes", "yes"] - cells["no", "yes"]  # 13 - 7  = +6.0

# main_A = +4.5 ; main_B = +3.5
# simple_A_noB = +3.0 ; simple_A_yesB = +6.0  -> not equal -> interaction is present
Interpretation. The main effect of \(A = +4.5\) points says the workshop raises the gain score by \(4.5\) points on average across tutoring levels, and because students were randomly assigned to the workshop, this is a causal average effect for these students — not an association and not a population claim, since no random sampling occurred. The main effect of \(B = +3.5\) points says the same for tutoring. But the simple effects of the workshop — \(+3.0\) without tutoring and \(+6.0\) with it — are not equal, which is the fingerprint of an interaction. So you would report the two main effects and note that the cells disagree about the workshop’s size, deferring the interaction’s exact magnitude to Week 8. Reporting only “\(+4.5\)” as if it told the whole story would be the Risk-8 error.
Worked example — a 2×2 garden trial (transfer, new context)
Design. A community garden runs a small randomized trial on tomato yield (kilograms per plot). Factor \(A\) = extra watering (no/yes), factor \(B\) = fertilizer (no/yes). Twenty plots are randomly assigned, five to each of the four cells; the unit is the plot. These numbers are illustrative and distinct from the Focus study.
Cell means (illustrative). \((\text{no}, \text{no}) = 4.0\), \((\text{yes}, \text{no}) = 6.0\), \((\text{no}, \text{yes}) = 5.0\), \((\text{yes}, \text{yes}) = 9.0\) kg.
Computation.
\[ \begin{aligned} \text{main effect of watering } A &= \tfrac{1}{2}(6.0 + 9.0) - \tfrac{1}{2}(4.0 + 5.0) = 7.5 - 4.5 = +3.0, \\[4pt] \text{main effect of fertilizer } B &= \tfrac{1}{2}(5.0 + 9.0) - \tfrac{1}{2}(4.0 + 6.0) = 7.0 - 5.0 = +2.0 . \end{aligned} \]
Interpretation. Extra watering raises yield by \(+3.0\) kg on average across fertilizer levels, and fertilizer by \(+2.0\) kg on average across watering levels. Because plots (the unit) were randomly assigned to treatment combinations, these are causal average effects for this garden — design earns the claim, not the arithmetic. And the cells again hint at synergy: watering lifts yield by \(+2.0\) kg without fertilizer (\(6.0 - 4.0\)) but \(+4.0\) kg with it (\(9.0 - 5.0\)), so the lone main effect of watering averages two unequal simple effects. Same design, same reading discipline, a different field — you check the cells before you trust the average.
A common mistake
Reading a main effect as the whole story when a large interaction is present (Risk 8). The main effect of \(A\) in the Focus study is a perfectly correct average: \(+4.5\) points. The mistake is treating that average as if it described every cell equally — as if the workshop adds \(4.5\) points whether or not a student also gets tutoring. The cells say otherwise: the workshop adds \(+3.0\) without tutoring and \(+6.0\) with it. When those simple effects differ, a single main-effect number summarizes a dependence it cannot show, and a reader who stops at “\(+4.5\)” will mis-state the design’s finding.
The fix is a habit, not a formula: look at the cell means and the simple effects before you report a lone main effect. If the simple effects of a factor are roughly equal across the other factor’s levels, the main effect is a fair summary. If they diverge — as they do here — say so, report the cells, and carry the interaction forward (Week 8) rather than burying it inside an average. The design still earns causal language, because assignment was random; what is at stake is which causal statement you are entitled to make.
Low-stakes self-checks (ungraded)
These are self-checks only — no points, no submission, nothing to turn in.
- In the Focus 2×2, write down which two cells go into the “workshop = yes” average and which two go into the “workshop = no” average for the main effect of \(A\). Then do the same for the main effect of \(B\).
- Recompute the main effect of \(B\) from the cell means \(5.0, 8.0, 7.0, 13.0\) and confirm you get \(+3.5\). In one sentence, say what design feature lets you call it a causal effect rather than an association.
- The simple effects of the workshop are \(+3.0\) (no tutoring) and \(+6.0\) (with tutoring). Without computing the interaction number, explain in a sentence why reporting only “main effect \(= +4.5\)” could mislead a reader.
- For the garden trial, identify the experimental unit and state why a yield claim here is causal but not a population claim about all gardens.
- Explain, in your own words, why one 2×2 factorial experiment is more efficient than two separate one-factor experiments using the same total number of units.
Reading and source pointer
For this week, read the multi-factor / factorial experiments material in Introduction to Modern Statistics (Çetinkaya-Rundel & Hardin) — the treatment of factors, levels, and reading effects from a multi-way design — alongside the primary instructor notes, which lead on the 2×2 layout, the main-effect contrasts, and the efficiency argument. These notes are the course’s own synthesis, grounded in but not copied from the sources. The interaction itself is introduced and computed next week; this week’s pointer is to the design and the main effects only.
Public vs. graded
These notes, the examples, and the practice here are public and ungraded — study material only. No graded prompts, answer keys, rubrics, point values, or due dates appear on this site. Graded design checkpoints, weekly quizzes, design memos and homework, applied design labs, the midterm, the final design project, and the final exam live in Blackboard (the LMS), which is authoritative for due dates, submissions, and grades. If this page and Blackboard ever disagree, follow Blackboard.
Looking ahead
Next week, we compute the interaction itself — the \(AB\) contrast that puts a number on the dependence the cells have been hinting at — and learn to read and plot it, so you can tell at a glance when a main effect is a fair summary and when it hides the real story. With the midterm (Friday, October 9, in class) covering everything through factorial designs, Week 8 closes out the experimental spine before the course turns to observational studies, where random assignment is gone and confounding takes center stage.
See also
- Week 6 — Blocking and paired designs — the precision-sharpening designs that precede the factorial.
- Week 8 — Interactions in designed studies — where the interaction this week previews is computed and plotted.
- Design glossary — factor, level, main effect, interaction, and the sampling-versus-assignment distinction in one place.
- Study-design reference — the design families (CRD, RCBD, paired, factorial) side by side.
- Causal-diagram guide — for the observational weeks ahead, where the causal reasoning gets a diagram.