Week 1 — Statistical questions and units of analysis
Questions, units of analysis, and the claim a study is trying to make
The week question
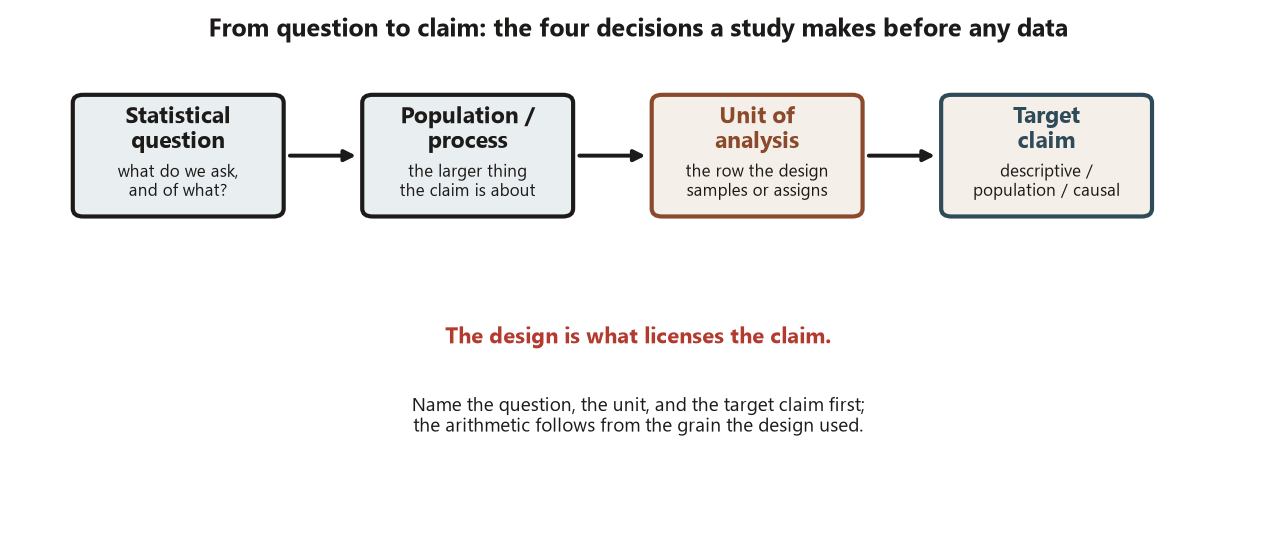
Before any data are collected, any test is run, or any model is fit, a study has already made four quiet decisions. What is the question? What is the population or process the question is about? What is the unit of analysis — the entity that one row of data describes? And what claim does the study intend to make — a description, a statement about a population, or a statement about cause? This week’s question is simple to ask and easy to get wrong: for a given study, can you name the question, the unit, and the target claim, and then say which design could support that claim? Everything else in the course — randomization, blocking, confounding, sampling — is machinery in service of getting that triple right.
Why this matters
A statistical analysis does not begin with a p-value or a procedure. It begins with a question attached to a population or process, a unit of analysis, a measurement, and a design that determines what the data can and cannot support. If you misname the unit, every standard error downstream is computed at the wrong grain. If you ask a causal question of a design that only earns a population description, you will read a number as proof of cause when it is nothing of the kind. The whole point of this course is to recognize what a study design can and cannot support — and that recognition starts here, with the question and the unit, not with the arithmetic.
Two recurring traps are already in view this week. The first is the wrong unit of analysis: treating individuals as the unit when the design actually acted on classrooms, floors, or pairs. The second, which we only preview, is confusing random sampling with random assignment — two different mechanisms that license two different kinds of claim. Getting the question and the unit right is the cheapest, highest-leverage move in all of study design, because it costs nothing but attention and it protects every later step.
Learning goals
By the end of this week you should be able to:
- State a study’s statistical question in plain words, naming the population or process it concerns.
- Identify the unit of analysis — the entity a single row of data describes — and explain why it must match the entity the design samples or assigns.
- Classify a target claim as descriptive, population, or causal, and say which kind of design could support each.
- Distinguish, in words only for now, the population or process from the sample that represents it.
- Preview the difference between random sampling (which earns population claims) and random assignment (which earns causal claims) without yet developing either.
- Spot the wrong-unit-of-analysis trap before it corrupts a downstream computation.
Core vocabulary
- Statistical question — a question naming a population or process, a unit of analysis, a comparison or quantity of interest, and a target claim.
- Population / process — the larger thing the claim is about: all enrolled undergraduates, or the ongoing process by which a workshop changes a score. Distinct from the sample.
- Sample — the units actually observed; a stand-in for the population, only as trustworthy as the mechanism that produced it.
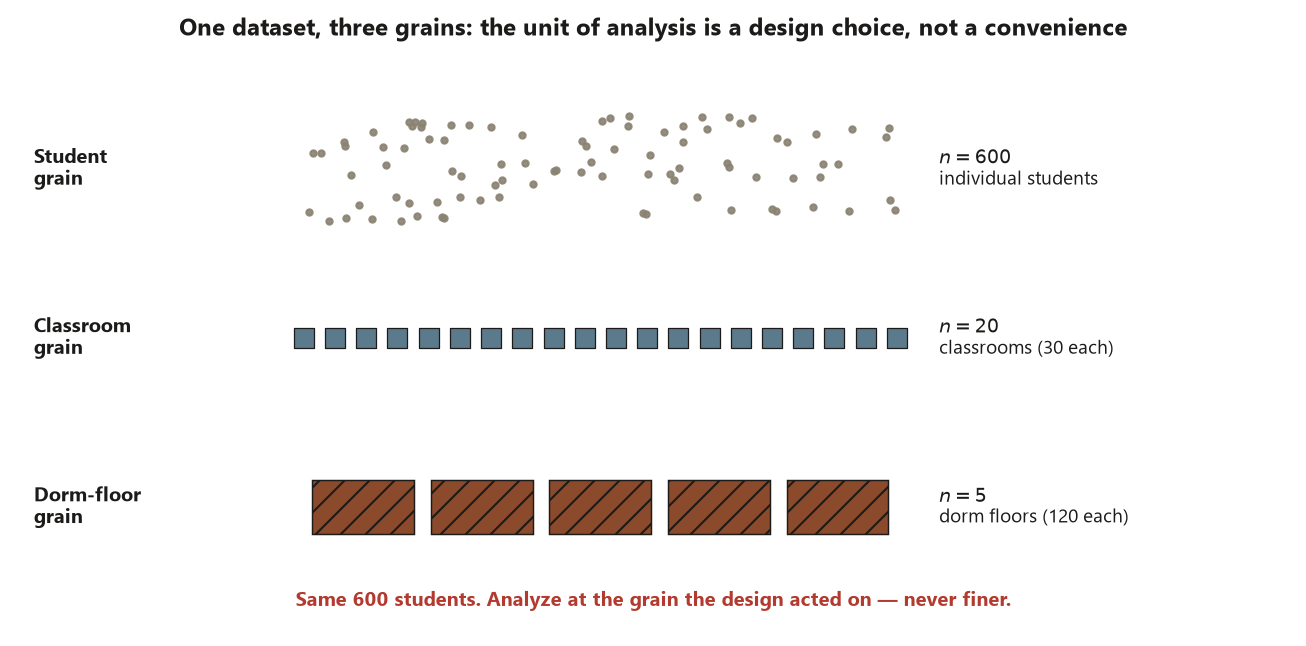
- Unit of analysis — the entity that one row of data describes and that the design samples or assigns (a student, a classroom, a dorm floor). Analyze at this grain, never finer.
- Descriptive claim — a summary of the observed data themselves, with no leap beyond them.
- Population claim — a statement about a population, earned by how units were sampled.
- Causal claim — a statement that an exposure changes an outcome, earned by how treatment was assigned.
- Random sampling — the mechanism that selects units into the sample; previewed this week.
- Random assignment — the mechanism that allocates treatment to units; previewed this week.
- Confounder — a pre-treatment common cause of the exposure and the outcome; named here, developed later.
Concept development
The statistical question names a population, a unit, and a claim
A well-posed statistical question is not “is the workshop good?” It is a sentence with named parts. Among first-year students in this program (the population/process), does completing the Focus workshop (the exposure) raise the timed problem-solving gain score (the outcome) for a student (the unit of analysis) — and is that a causal claim or only an association? Writing the question this way forces you to commit to a unit and a claim before you touch data. The same substantive curiosity — “does the campus help students learn better?” — becomes three different studies depending on which question you actually ask and which design you can run.
The claim type is the spine. A descriptive claim stays inside the observed data: “in our sample, workshop students gained 3 more points.” A population claim leaps from sample to population: “among all enrolled undergraduates, the proportion sleeping at least seven hours is about 0.45.” A causal claim leaps from association to mechanism: “the workshop causes a 3-point gain.” Each leap is licensed by a different feature of the design, and using a number for a leap its design cannot support is the original sin this course is built to prevent.
The unit of analysis is the row the design samples or assigns
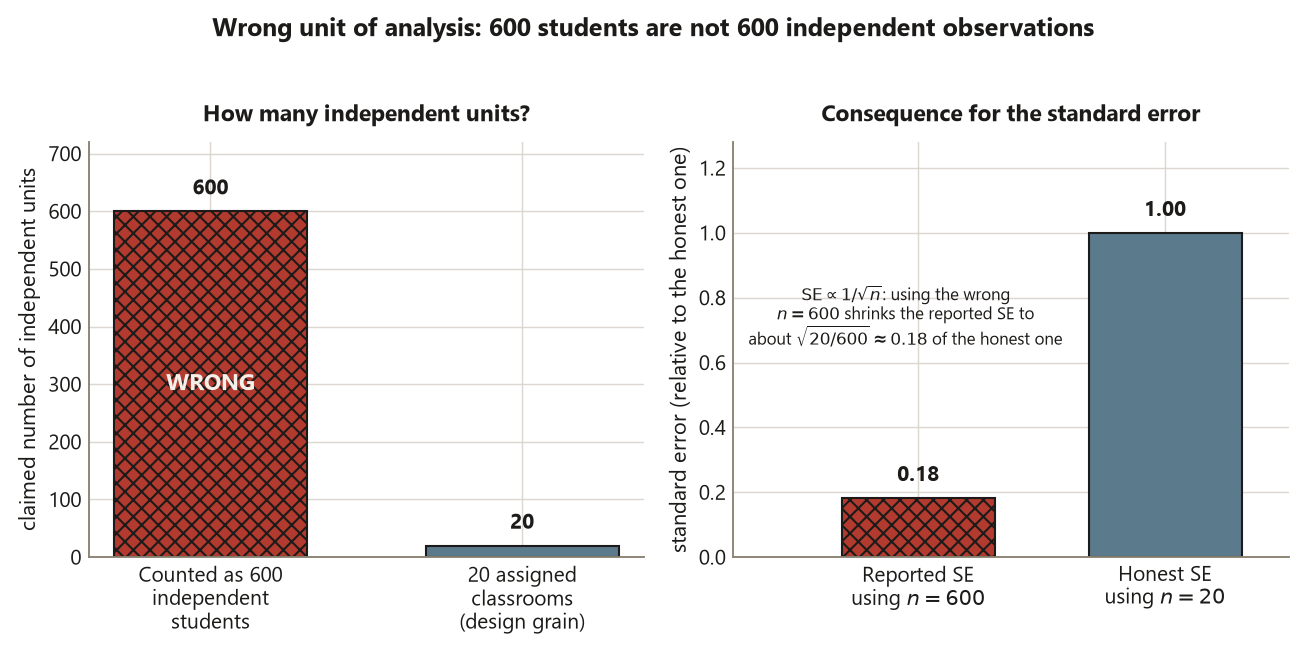
The unit of analysis is the entity a single row of your data table describes. It sounds trivial, but it is the most common silent error in applied work. The rule is exact: analyze at the grain the design used. If you randomly assign whole classrooms to a treatment, the classroom is the unit the design acted on, and treating each of the 25 students in a classroom as 25 independent observations fabricates information the design never gave you — it deflates standard errors and manufactures significance. This is Risk 3, the wrong-unit-of-analysis trap, and it lurks anywhere the thing sampled or assigned is coarser than the thing you are tempted to count.
For all three of our recurring campus studies the unit happens to be the student, which is convenient but not automatic. In a survey that sampled dorm floors and then surveyed everyone on each floor, the floor — not the student — is what the design selected, and the analysis must account for that (we return to this with cluster sampling in Week 12). The discipline is to ask, every single time, what entity did the design actually act on? — and to let that, not convenience, set the grain.
Sampling vs assignment: two mechanisms, two claims (previewed)
This is the course’s signature distinction, and we only open the door on it this week. A study can involve two different random mechanisms, and they are not interchangeable. Random sampling selects which units enter the sample; it is what lets you generalize from the sample to a population, so it earns population claims. Random assignment allocates which units get the treatment; it is what makes treatment and control comparable on everything else, so it earns causal claims. A study may have one, both, or neither.
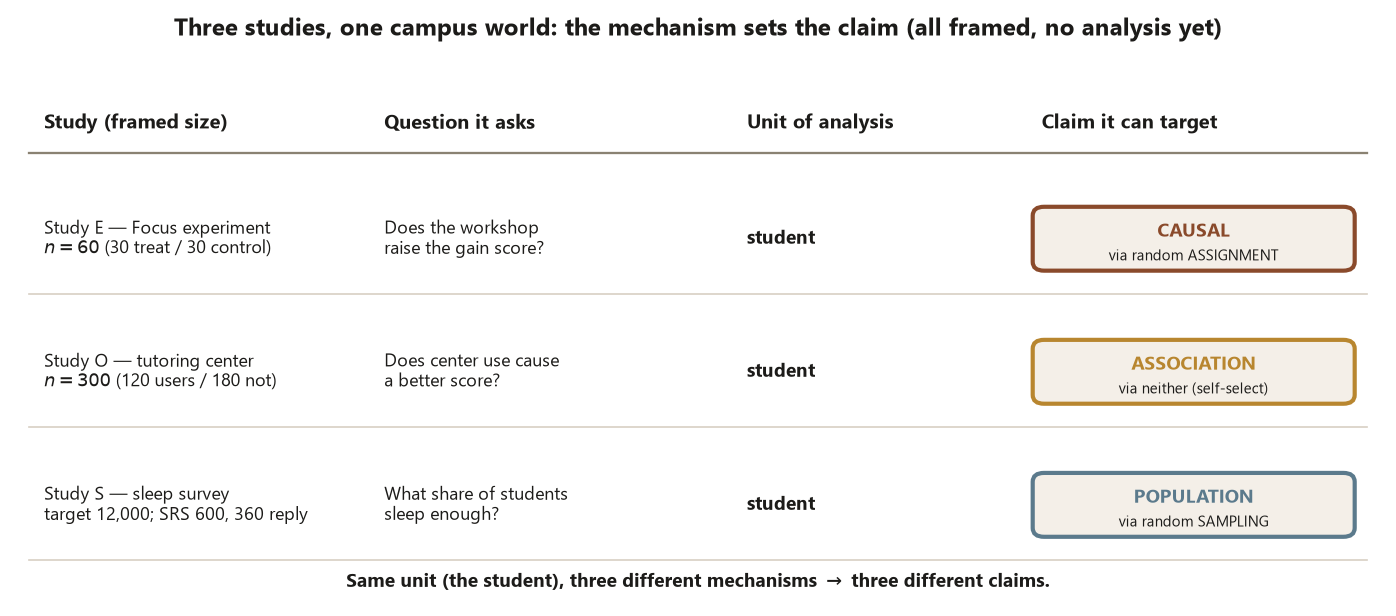
Our three studies illustrate the full grid. The Focus experiment uses random assignment (it splits volunteers into treatment and control) but not random sampling from the whole campus — so it can speak to cause for the students it studied, but generalizing to all undergraduates is a separate question. The study-habits survey uses random sampling (it draws students from a frame) but assigns no treatment — so it can speak to a population proportion but never to cause. The observational tutoring-center study has neither: students chose for themselves whether to use the center, so the comparison is, at the start, only an association. Keep these straight in words now; Week 3 develops the mechanism and Weeks 4–13 cash it out in numbers.
Worked examples
Worked example — framing the three recurring studies (synthetic; seed set)
We frame all three studies at the level of question → unit → claim → design that could support it. No analysis is performed this week; these are the destinations the rest of the course drives toward. All numbers are synthetic and seed-set (set.seed(45403)).
Study E — the Focus study-skills experiment. Question: does completing the Focus workshop raise the timed problem-solving gain score? Population/process: the process by which the workshop changes a student’s score. Unit of analysis: the individual student. Claim type: causal. Design that supports it: a randomized experiment — random assignment of \(n = 60\) students into 30 treatment / 30 control makes the two groups comparable, so a later difference in gain can be read as the workshop’s effect. The locked destination is \(\bar y_T = 8.0\) versus \(\bar y_C = 5.0\), an observed effect of \(d = 8.0 - 5.0 = 3.0\) points (developed in Week 5). The design move here is assignment: because the workshop was assigned at random, the 3-point gap will be readable as cause, not merely association.
Study O — the tutoring-center observational study. Question: does using the tutoring center cause a better end-of-term score? Population/process: students deciding whether to use the center. Unit of analysis: the individual student. Claim type: the intended claim is causal, but the design earns only association until a confounder is handled. Design: purely observational — students self-select, with \(n = 120\) users and \(n = 180\) non-users (total 300). The locked destination is a naive difference of \(82.0 - 74.0 = +8.0\) points, which prior ability (a confounder) inflates; adjustment later shrinks it to \(+3.0\) (Weeks 9–10). The design move here is the absence of assignment: with no randomization, the \(+8.0\) is an association, and naming the unit and the missing mechanism now is what flags the gap between the question asked and the claim the design can support.
Study S — the campus study-habits survey. Question: what proportion of undergraduates get adequate sleep? Population: all \(12{,}000\) enrolled undergraduates. Unit of analysis: the individual student. Claim type: population. Design that supports it: a survey built on random sampling — a simple random sample of \(n = 600\) invited from the registrar frame, of whom 360 respond, giving \(\hat p = 162/360 = 0.45\) reporting at least seven hours (developed in Week 11). The design move here is sampling: random selection from the frame is what will let the 0.45 generalize to the population — and the coverage and nonresponse threats to that generalization are exactly what Weeks 11 and 13 examine.
A static map of the question → unit → claim → design chain for one study, drawn as plain comments. No randomness is drawn, so no seed is needed in this chunk; we include set.seed(45403) only to model the course-wide convention that any chunk capable of drawing randomness fixes the seed.
# Week 1 framing: the question -> unit -> claim -> design chain (no analysis yet)
# Synthetic; seed set per course convention.
set.seed(45403)

studies <- data.frame(
  study      = c("E (Focus experiment)", "O (tutoring center)", "S (sleep survey)"),
  unit       = c("student",              "student",            "student"),
  mechanism  = c("random ASSIGNMENT",    "neither (self-select)", "random SAMPLING"),
  claim_type = c("causal",               "association (until adjusted)", "population"),
  destination= c("d = 8.0 - 5.0 = 3.0",  "naive +8.0 -> adjusted +3.0",  "p-hat = 162/360 = 0.45")
)

# studies
#                 study     unit            mechanism                    claim_type            destination
# E (Focus experiment)  student     random ASSIGNMENT                        causal      d = 8.0 - 5.0 = 3.0
#  O (tutoring center)  student  neither (self-select)  association (until adjusted)  naive +8.0 -> adjusted +3.0
#     S (sleep survey)  student      random SAMPLING                    population      p-hat = 162/360 = 0.45

# Reading the table by the design move, not the number:
#  - E earns CAUSE because treatment was ASSIGNED at random (unit = student).
#  - O earns only ASSOCIATION because nothing was assigned; the +8.0 carries confounding.
#  - S earns a POPULATION proportion because units were SAMPLED at random from the frame.
The whole table is a framing device, not a result: each row pairs a unit with the mechanism the design uses and therefore the claim it can support. The number in the last column is a preview of where the course goes, never a finding established this week.
Worked example — transfer: a wellness-email study at a clinic (illustrative numbers)
Now apply the same triple in a new context, with illustrative numbers that are clearly distinct from the locked campus studies. A community clinic asks: does a monthly wellness email change how often patients come in for preventive visits? The substantive curiosity is causal, but — exactly as with the campus studies — the claim a design can support depends on the mechanism, and the unit must match the design.
Version A (sampling, population claim). The clinic draws a simple random sample of 500 patients from its 8,000-patient roster and records how many had a preventive visit last year, finding 150, so \(\hat p = 150/500 = 0.30\). Unit: the patient. Mechanism: random sampling from the roster. Claim the design supports: a population claim — about 30% of roster patients had a preventive visit. The design move is sampling: this earns a description of the population, but it says nothing about whether the email changes anything, because no email was assigned.
Version B (assignment, causal claim). The clinic instead randomly assigns 500 patients, 250 to receive the monthly email and 250 to receive nothing, then counts preventive visits over the next year: 90 visits among the emailed group versus 60 among the control group. Unit: the patient. Mechanism: random assignment of the email. Claim the design supports: a causal claim — the difference, \(90/250 - 60/250 = 0.36 - 0.24 = 0.12\), can be read as the email’s effect because assignment made the two groups comparable. The design move is assignment: only this version can answer the clinic’s actual “does it change visits” question.
The wrong-unit trap, in this context. Suppose instead the clinic randomly assigned the email to whole waiting-room cohorts (say 20 cohorts) rather than to individual patients, then analyzed the 1,000 individual patients as if each were an independent observation. The mechanism acted on cohorts, so the cohort is the unit the design assigned; counting 1,000 independent patients invents precision the design never produced. The fix is to match the analysis grain to the assignment grain — here, the cohort. Same triple, new setting: name the unit the design acted on, and let it set the grain.
A common mistake
The week’s signature error is analyzing at a finer grain than the design acted on — Risk 3, the wrong unit of analysis. It shows up whenever the thing sampled or assigned is coarser than the thing you count. A study assigns the workshop to whole discussion sections but then treats each student as an independent data point; a survey samples dorm floors but analyzes individual students as a simple random sample; a clinic emails whole cohorts but counts individual patients. In every case the analyst manufactures observations the design never delivered, deflating the standard error and inflating significance. The fix is one disciplined question asked every time: what entity did the design actually sample or assign? — and then analyze at exactly that grain, never finer.
A close relative, previewed this week and developed in Week 3, is confusing random sampling with random assignment. They are different mechanisms and they license different claims: sampling earns a population claim, assignment earns a causal claim. A study with beautiful random sampling and no assignment can describe a population precisely while saying nothing about cause; a study with clean random assignment but a convenience sample can establish cause for its participants while leaving generalization open. Reading a sampled survey as if it proved causation, or an assignment experiment as if it automatically generalized to everyone, are two faces of the same conflation. Name the mechanism first; let it set the claim.
Low-stakes self-checks (ungraded)
These are ungraded self-checks — practice only, no points and no submission.
- For a study asking “what fraction of campus parking spots are occupied at 10 a.m.?”, name the population/process, the unit of analysis, and the claim type. Which mechanism — sampling or assignment — would the design rely on?
- A researcher randomly assigns the Focus workshop to 10 entire study groups (not individuals), then analyzes all 80 students as independent observations. Which risk is this, and what is the correct unit of analysis?
- In your own words, why does random sampling license a population claim while random assignment licenses a causal claim — and why can a study have one without the other?
- Restate the tutoring-center question as a precise statistical question (population/process, unit, comparison, claim). Why does the design, as described, earn only an association at the start?
- Give an everyday example where the unit you are tempted to count is finer than the unit the design acted on, and say how you would fix the grain.
Reading and source pointer
For this week, the supplementary grounding is the data and study-design introduction in IMS (Çetinkaya-Rundel & Hardin) — the chapter that introduces data, variables, observational units, and the distinction between observational studies and experiments. It calibrates the topic order and vocabulary used here (population vs sample, unit of analysis, the sampling-vs-assignment split). The optional advanced causal reference is not needed yet; it enters only in Weeks 9–10.
These notes are the course’s own synthesis, grounded in but not copied from the sources. No source prose, examples, datasets, figures, or exercises are reproduced; the framing, the three recurring campus studies, and all numbers are course-original and synthetic.
Public vs. graded
These notes, the examples, and the practice here are public and ungraded — study material only. No graded prompts, answer keys, rubrics, point values, or due dates appear on this site. Graded design checkpoints, weekly quizzes, design memos and homework, applied design labs, the midterm, the final design project, and the final exam live in Blackboard (the LMS), which is authoritative for due dates, submissions, and grades. If this page and Blackboard ever disagree, follow Blackboard.
Looking ahead
Next week we move from what entity to what is measured on it: measurement, variables, and operational definitions. We will take the still-vague constructs previewed here — a “study skill,” “adequate sleep,” the “gain score” — and pin each to a concrete operational definition, then ask where measurement error enters and what it costs a claim. The question-unit-claim triple you built this week is the scaffold; measurement is what hangs on it.
See also
- Week 2 — Measurement, variables, and operational definitions
- Design glossary — the locked notation, including unit of analysis, sampling vs assignment, and claim types.
- Design reference — the design families side by side and which claim each can support.
- Causal-diagram guide — for the confounder and backdoor ideas named here and developed in Weeks 9–10.