Week 7 — Assumptions, diagnostics & the midterm
Checking the conditions an analysis rests on — before you trust it
The week question
Last week you fit a one-way ANOVA to Dataset F and got a verdict: final exam score differs across the four instructional formats, with \(F \approx 7.61\) on \((3, 96)\) and \(p \approx 0.0001\). That number is only as trustworthy as the conditions it was computed under. The \(F\) statistic, its \(p\)-value, and the effect size \(\eta^2 \approx 0.19\) are all derived assuming certain things about how the data behave — and if those things are badly wrong, the verdict can be wrong in a direction you cannot see from the verdict itself. This week’s question is the discipline that turns a computed result into a defensible one: what does this analysis assume, how do you check each assumption with the data in front of you, and what do you do when one of them looks shaky?
That is step 4 of the analysis blueprint — assumptions and diagnostics — and this week it stops being a line you nod at and becomes the actual work. You will read the residual plot, the QQ plot, and Levene’s test on the very Dataset F fit you ran last week, decide whether the conditions are reasonable, and learn the rule for the one mildly unusual point. The week also carries the midterm, Friday Oct 9, in class, covering weeks 1–7 — the applied workflow, exploratory analysis, estimation and uncertainty, practical significance, paired and two-group comparisons, one-way ANOVA, and these diagnostics. The midterm itself, its format, and its rubric live in Blackboard; this note carries the content, not the assessment.
Why this matters
Every method in this course is a machine that turns data into an estimate with an uncertainty, and every machine has a manual that says what it assumes. The paired \(t\), the two-sample \(t\), and the one-way ANOVA all lean on the same short list: the observations are independent, the residuals are approximately normal, and the groups have roughly equal variance. When those hold, the \(p\)-value, the confidence interval, and the effect size mean what they say. When they fail badly, the standard error is the wrong size, the interval is the wrong width, and the \(p\)-value can be far from its nominal value — so you would report a clean-looking result that the data do not actually support.
This is exactly where an applied methods course earns its name. It would be easy to compute \(F = 7.61\), report \(p \approx 0.0001\), and move on. The course’s whole stance is that you do not get to move on until you have looked — at the residuals, at the spread, at the unusual point — and decided whether the machine was run inside its operating range. Two disciplines that recur on every page apply with special force this week. First, report the estimate with its uncertainty, not just a verdict: a diagnostic check is what licenses the interval you report. Second, keep statistical, practical, and causal claims distinct: a diagnostic tells you the model fit the data adequately — it does not upgrade an observational comparison into a causal one, and it does not turn a small effect into an important one. Diagnostics protect the honesty of the estimate; they do not inflate what it can claim.
Learning goals
By the end of this week you should be able to:
- State the three conditions a one-way ANOVA (and the \(t\)-tests) rest on — independence, approximately normal residuals, and roughly equal variance — and explain in plain words what each one buys and what its failure would distort.
- Read the standard diagnostic displays — the residual-versus-fitted plot, the normal QQ plot, and a spread-versus-group view — and say what feature of each one you are checking.
- Run and interpret Levene’s test for equal variance, reading its \(p\)-value as a check on a condition (here \(p \approx 0.40\)) rather than as the main scientific result.
- Apply the investigate-do-not-delete rule to an unusual point: identify it, ask why it is unusual, and decide between keeping it, transforming, using a robust or Welch-style alternative, or reporting a sensitivity check — never silently dropping it.
- Name the blueprint move for diagnostics: what each tool assumes, what it checks, what a shaky result would distort, and the key trap — that a non-significant assumption test is not proof the assumption holds.
Core vocabulary
- Residual — for an ANOVA fit, the leftover \(e_{ij} = y_{ij} - \bar y_j\): each observation minus its group mean (the fitted value). The residuals are what the diagnostics actually examine, because the conditions are conditions on the residuals, not on the raw scores.
- Independence — the observations carry separate information; one student’s score does not depend on another’s. This comes from the design (different students, no clustering or repeated measures), not from a plot, so you check it by reasoning about how the data were collected.
- Normality of residuals — the residuals behave like draws from a roughly normal distribution. ANOVA is fairly robust to mild departures, especially with balanced, moderate samples, so “approximately” is the operative word — you are looking for gross skew or heavy tails, not perfection.
- Equal variance (homoscedasticity / homogeneity of variance) — the spread of scores is about the same in every group, so a single pooled \(\mathrm{MSE}\) fairly represents all of them.
- Normal QQ plot — a plot of the ordered residuals against the quantiles a normal distribution would produce; a roughly straight line signals approximate normality, and systematic curving or points far off the line at an end flag a departure.
- Residual-versus-fitted plot — residuals on the vertical axis against fitted values (here the four group means) on the horizontal; you check for no pattern and for constant vertical spread across the groups.
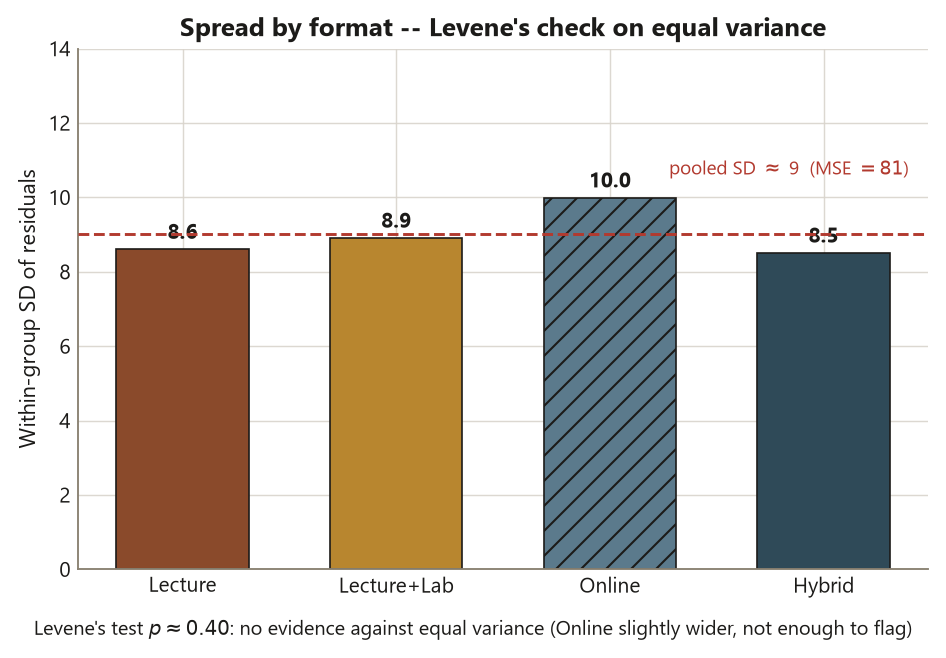
- Levene’s test — a formal test whose null is “all group variances are equal.” A large \(p\)-value (here \(p \approx 0.40\)) means you have no evidence against equal variance; it does not prove the variances are identical.
- Investigate-do-not-delete — the rule for an unusual point: find it, ask whether it is an error or a real observation, and report what you found — never quietly remove it to make a result look cleaner.
- Sensitivity check — re-running the analysis with and without a contested choice (a point, a transform, a robust method) to show whether the conclusion depends on it.
Concept development
What ANOVA and the t-tests actually assume
The one-way ANOVA you ran on Dataset F asks whether the four format means — Lecture \(74\), Lecture+Lab \(81\), Online \(70\), Hybrid \(79\), against a grand mean of \(76\) — differ by more than within-group noise would explain. To turn the observed spread of means into the \(F\) statistic and its \(p\)-value, the method leans on three conditions, all of which are really conditions on the residuals \(e_{ij} = y_{ij} - \bar y_j\), the part of each score left over after subtracting its group mean.
The first is independence: each of the \(N = 100\) observations contributes its own separate piece of information. This is the most important condition and the one no plot can rescue — it comes from the design. For Dataset F, independence holds because the \(100\) scores come from \(100\) different students, with no student appearing twice and no obvious clustering (no shared tutor, no repeated measurement). Note how this connects to the blueprint’s structure step: a paired design (Dataset P) would violate the independence-of-observations assumption on purpose — that is what pairing is — and would call for the paired \(t\) instead. Here the design is genuinely independent, so a one-way ANOVA is the right machine.
The second is approximately normal residuals: the leftovers behave roughly like draws from a normal distribution. The word approximately matters. With balanced groups of \(n = 25\) each, ANOVA is fairly robust to mild non-normality — you are screening for serious skew or heavy tails that would distort the \(p\)-value, not auditing for a perfect bell curve. The third is roughly equal variance: the within- group spread is about the same in all four formats, so the single pooled \(\mathrm{MSE} = 81\) (an SD of about \(9\)) fairly stands in for every group. Unequal variances would make that pooled number a poor summary and bias the \(F\) test, especially when group sizes also differ — though here, with equal \(n = 25\) per format, ANOVA tolerates moderate inequality reasonably well.
Name the blueprint move plainly: these three conditions are what the uncertainty in last week’s result — the \(F\), its \(p \approx 0.0001\), the implied intervals — was computed under. Checking them is how you decide whether to trust the estimate, not an optional afterthought.
The diagnostic tools — and reading them on Dataset F
You check normality and equal variance mostly by looking, with one formal test as a backstop. Three displays do the work, and plot() of an aov fit produces them.
The residual-versus-fitted plot puts the residuals on the vertical axis and the fitted values — here the four group means, \(70, 74, 79, 81\) — on the horizontal. You are checking two things at once. There should be no systematic pattern (no curve, no funnel), and the vertical spread should be about the same above each group mean. On Dataset F the cloud is roughly even across the four format means, with the Online group showing slightly more vertical spread than the others, and one Online residual reaching well below the rest — that is the mild low outlier, an Online student scoring near \(45\) when the Online mean is \(70\) (a residual near \(-25\)). Nothing here looks like a funnel or a bend.
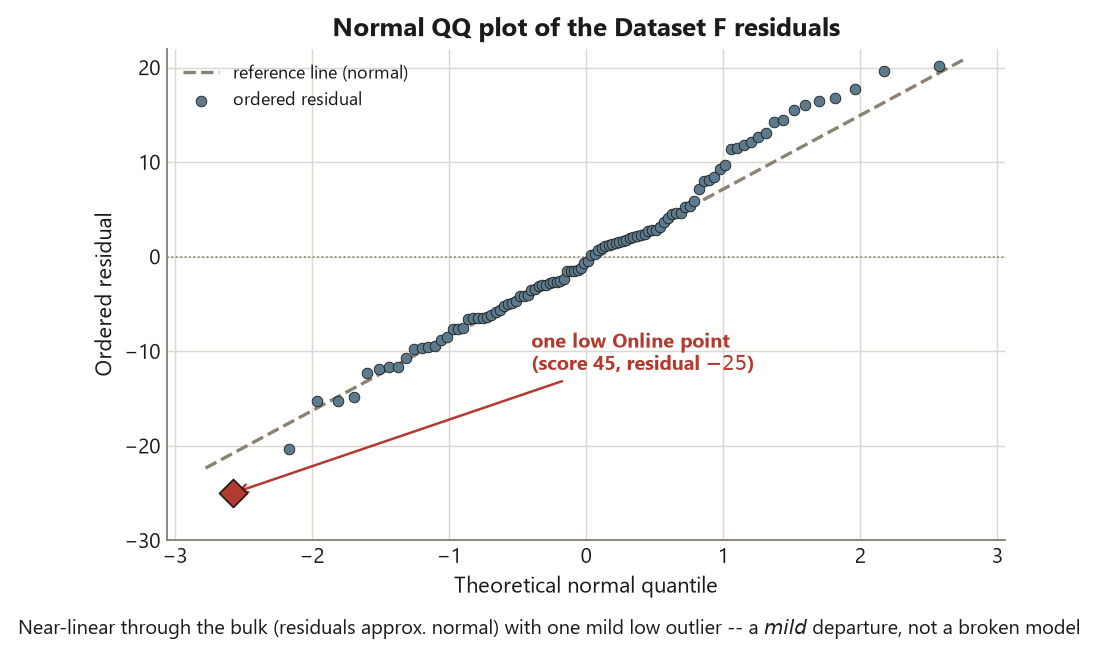
The normal QQ plot orders the residuals and plots them against the quantiles a normal distribution would give. A roughly straight line means approximate normality. On Dataset F the QQ plot is near-linear through the bulk of the points, with the single low Online point near \(45\) pulling away at the bottom-left end — exactly the fingerprint of one mild outlier sitting in an otherwise normal- looking set of residuals. One point off the end of an otherwise straight line is a mild departure, not a reason to abandon the model.
The spread-versus-group view — side-by-side boxplots, or the formal Levene’s test — checks equal variance directly. Levene’s test takes “all four group variances are equal” as its null and asks whether the observed differences in spread are larger than sampling noise would produce. For Dataset F, Levene’s test gives \(p \approx 0.40\). Read that carefully: a large \(p\)-value means there is no evidence against equal variance, so treating the four formats as sharing a common spread (and using the pooled \(\mathrm{MSE} = 81\)) is reasonable. The Online group is slightly more spread out, but not by enough for Levene’s test to flag — \(p \approx 0.40\) is nowhere near a threshold like \(0.05\). Crucially, \(p \approx 0.40\) does not prove the variances are identical; it only says the data do not contradict the equal-variance assumption. That distinction is this week’s central trap, and it returns in the common mistake.
Put together, the three readings on Dataset F point the same way: residuals near-normal with one mild outlier, spread reasonably equal (\(p \approx 0.40\)), and independence secured by the different-students design. The conditions are reasonable, so last week’s \(F \approx 7.61\) and its \(p \approx 0.0001\) stand.
When an assumption looks shaky — and the outlier rule
Suppose a diagnostic had looked worse. The applied response is not to panic or to delete data; it is to choose a principled fix and, ideally, show the conclusion survives it. There is a small menu.
If the residuals were clearly skewed or the spread fanned out with the mean, a transformation of the response — a log or square-root, say — often pulls the residuals back toward normal and stabilizes the variance at the same time; you then refit and recheck the diagnostics on the transformed scale. If the variances were genuinely unequal, you reach for a variance-robust alternative: for two groups that is Welch’s \(t\) (the safe default you met with Dataset G); for several groups it is Welch’s ANOVA, which does not pool the variances. If a single influential point is doing the damage, you can fit with and without it and report both — a sensitivity check — so the reader sees exactly how much the conclusion leans on that one observation. The honest move is transparency, not a quiet edit.
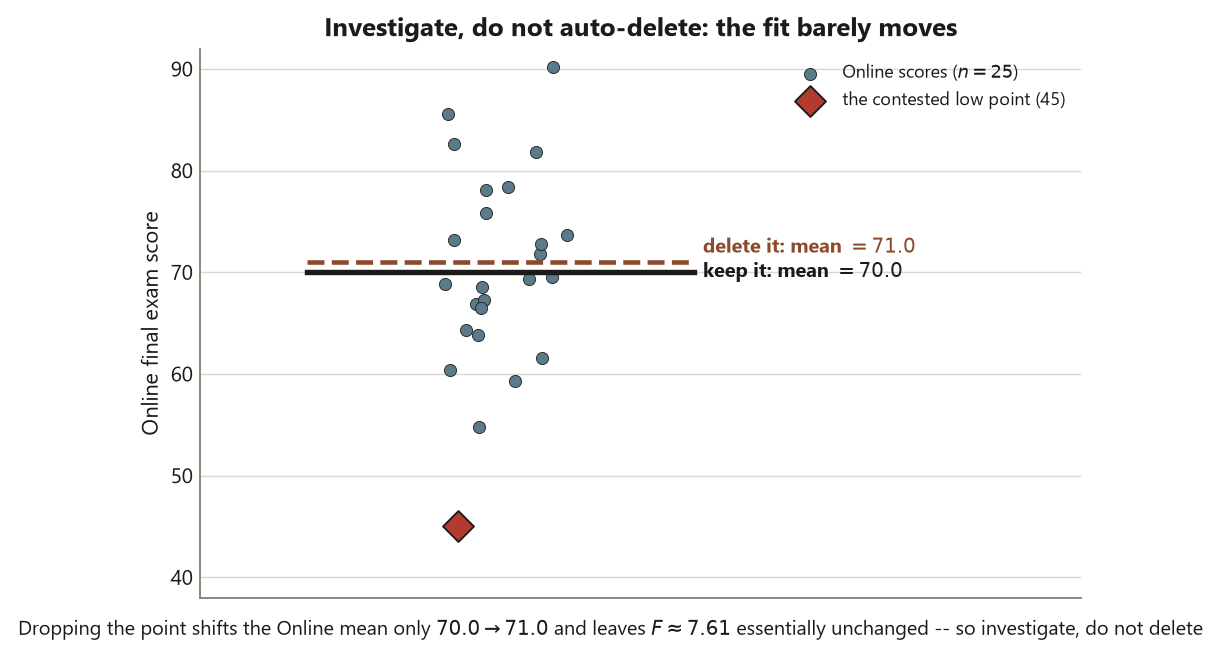
That brings us to the investigate-do-not-delete rule, which governs the mild Online outlier near \(45\). The instinct to delete a point that “ruins” a plot is exactly backwards. First investigate: is it a data error (a mistyped score, a misread row), or a real observation (a genuinely struggling student)? If it is a recording error you can correct or document, do so. If it is a real score, it is data, and removing it because it is inconvenient is a form of cherry-picking that biases the result and misstates the uncertainty. For Dataset F, the point is a plausible real low score, the departure is mild (one point off the QQ line, one residual near \(-25\)), and ANOVA is robust enough that it does not overturn the verdict. So you keep it, note it, and — if you wanted to be thorough — report that the ANOVA conclusion is essentially unchanged with or without it. Investigate; do not auto-delete. That sentence is the whole rule.
Worked examples
Worked example — Dataset F: reading the diagnostics on the one-way ANOVA (recurring slice)
The question and structure. You want to decide whether the one-way ANOVA from last week — final exam score across four instructional formats, \(n = 25\) per format, \(N = 100\) — was run under conditions that make its \(F \approx 7.61\), \(p \approx 0.0001\) trustworthy. The unit of analysis is the individual student; the response is the quantitative final score; the grouping factor is Format (Lecture, Lecture+Lab, Online, Hybrid); the design is independent and observational (different students, who were not randomly assigned to format). The method is the diagnostic check of step 4 of the blueprint. Data are synthetic; seed set.
What is assumed, and how we check it. Three conditions: independence, approximately normal residuals, roughly equal variance. Independence is checked by reasoning about the design — \(100\) distinct students, no repeated measures, no clustering — so it holds. Normality and equal variance are checked from the fit, by plotting the residuals and running Levene’s test. The static R below shows the idioms; it is teaching code and is not executed on this site.
set.seed(35203)

# Dataset F: final exam score (0-100) by instructional Format, n = 25 each, N = 100.
# Synthetic; group means L = 74, LL = 81, O = 70, H = 79; within-group SD ~ 9 (MSE = 81).
aov_fit <- aov(final_score ~ format, data = dataset_F)

# Diagnostic plots: residual-vs-fitted (constant spread? pattern?) and normal QQ (linear?).
# par(mfrow = c(1, 2))
plot(aov_fit, which = 1)   # residuals vs fitted -> even spread across 4 group means;
                           #   one Online residual ~ -25 (a score near 45 vs Online mean 70)
plot(aov_fit, which = 2)   # normal QQ plot -> near-linear; one low Online point pulls the
                           #   bottom-left tail away (the mild outlier)

# Formal equal-variance check (Levene centers on the median, robust to non-normality):
car::leveneTest(final_score ~ format, data = dataset_F)
#                Df  F value  Pr(>F)
# group           3   ~0.99    ~0.40    <- p ~ 0.40: NO evidence against equal variance
#                96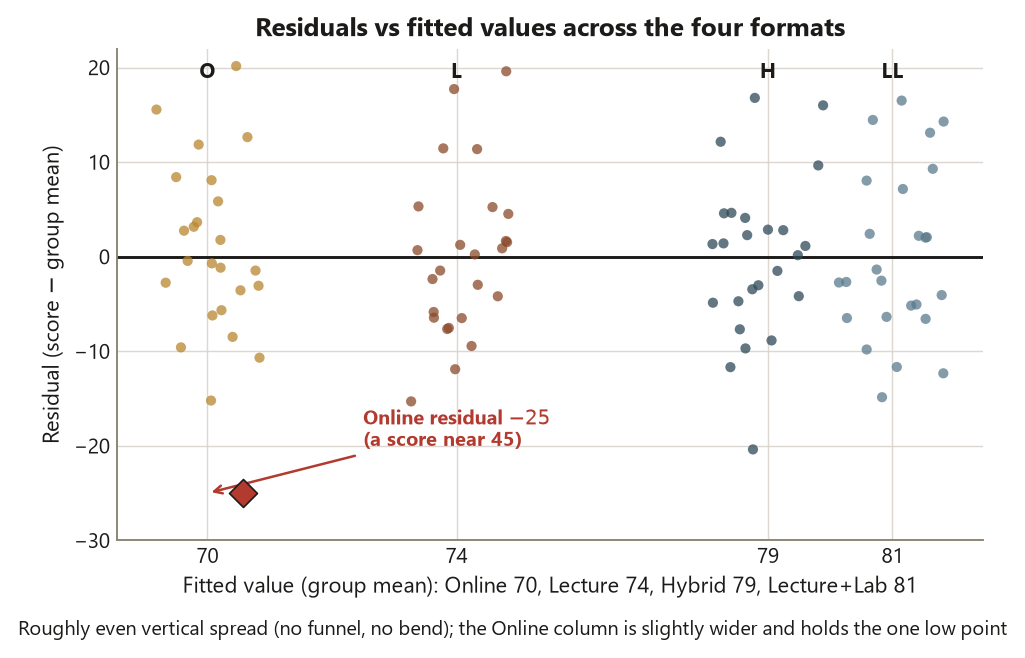
The estimate, its uncertainty, and the reading. The diagnostics are not themselves the scientific estimate — that was last week’s \(F \approx 7.61\), \(\eta^2 \approx 0.19\). What they deliver is a verdict on whether that estimate and its uncertainty are believable. The QQ plot is near-linear with one low Online point near \(45\); the residual-versus-fitted plot shows roughly even spread across the four group means with the Online group slightly wider; Levene’s \(p \approx 0.40\) gives no evidence against equal variance; and independence holds by design. So the three conditions are reasonable, and last week’s \(F \approx 7.61\) on \((3, 96)\), \(p \approx 0.0001\), with \(\eta^2 \approx 0.19\), stands as reported — you may trust the estimate and its interval. The mild Online outlier is investigated, not deleted: it is a plausible real low score, the departure from normality is slight, and the ANOVA conclusion is essentially unchanged with or without it. On the blueprint: the diagnostics assumed little, checked normality and equal variance, found nothing that would distort the \(F\) or its \(p\)-value, and — note the limit — do nothing to license a causal claim: format was not randomly assigned, so this remains an association, not evidence that a format causes a score.
Worked example — a two-group equal-variance and residual check (transfer, new context)
The question and structure. A campus dining service runs a small study of meal-prep time in minutes for two kitchen layouts, Galley and Island, with \(n = 30\) orders timed under each. The unit of analysis is the order; the response is the quantitative prep time; the grouping factor is layout; the design is two independent groups. Before trusting a two-sample comparison of the layouts, you check the same kinds of conditions you checked for Dataset F — independence, approximately normal residuals, and equal variance — now in a two-group setting. These numbers are illustrative and distinct from Dataset F.
What is assumed, and how we check it. Suppose Galley orders average \(14.0\) minutes with SD \(\approx 3.0\), and Island orders average \(11.5\) minutes with SD \(\approx 5.4\) — already a hint that the spreads differ, with Island nearly twice as variable. The residuals are each prep time minus its layout mean. You plot the residuals against the fitted values (the two layout means) and run Levene’s test, just as before.
set.seed(35203)

# Prep-time study: minutes for 2 kitchen layouts (Galley, Island), n = 30 each.
# Synthetic; illustrative numbers, DISTINCT from Dataset F.
# Galley: mean ~ 14.0, SD ~ 3.0    Island: mean ~ 11.5, SD ~ 5.4
fit2 <- lm(prep_time ~ layout, data = prep_study)

plot(fit2, which = 1)   # residuals vs fitted -> Island column noticeably wider (a funnel hint)
plot(fit2, which = 2)   # normal QQ -> bulk roughly linear; mild right-tail from a few long Island orders

car::leveneTest(prep_time ~ layout, data = prep_study)
#                Df  F value  Pr(>F)
# group           1   ~6.5     ~0.013   <- p ~ 0.013: evidence AGAINST equal variance
#                58
The estimate, its uncertainty, and the reading. Here the diagnostics fail the equal-variance check: the residual-versus-fitted plot shows the Island column markedly wider, and Levene’s \(p \approx 0.013\) is evidence against equal variance — the opposite of Dataset F’s reassuring \(p \approx 0.40\). The applied response follows the menu. Because the spreads genuinely differ, you do not pool; you report the layout difference using Welch’s \(t\), which uses each group’s own variance and adjusts the degrees of freedom — exactly the variance-robust default. The estimate is then the mean prep-time difference, \(14.0 - 11.5 = 2.5\) minutes, reported with a Welch confidence interval, not a bare \(p\)-value. The point of the transfer is the identical diagnostic habit — residual plot, QQ plot, Levene — applied in a new context, producing a different decision: equal-variance was reasonable for Dataset F and is not reasonable here, so the method adapts (Welch instead of pooled). Same six-step blueprint, same two disciplines; only the data and the verdict on the conditions changed.
A common mistake
This week’s classic applied-methods error is treating diagnostics as a formality — and it shows up in three closely related flavors, each of which quietly undermines a result.
The first is skipping diagnostics entirely: computing \(F \approx 7.61\), reporting \(p \approx 0.0001\), and never looking at a single residual. The danger is that a badly violated assumption can make the \(p\)-value or the interval simply wrong, and you would never know — the verdict looks just as confident either way. A \(p\)-value you have not checked the conditions for is a number you cannot defend. The fix is the routine of this week: always plot the residuals and check the spread before you trust the estimate.
The second is deleting an outlier silently to clean up a plot or sharpen a result. Removing the Online point near \(45\) without comment would shrink the within-group spread, nudge the means, and overstate how tidy the data are — and because no one was told, the reader cannot judge whether the conclusion depends on that edit. This is a form of cherry-picking, and it biases both the estimate and its uncertainty. The fix is investigate-do-not-delete: identify the point, ask whether it is an error or a real observation, keep it unless it is a documented error, and if it is influential, report the analysis with and without it so the dependence is visible.
The third — the subtlest — is treating a non-significant assumption test as proof the assumption holds. Levene’s \(p \approx 0.40\) does not mean “the variances are equal”; it means “the data give no evidence against equal variance.” Those are different statements. A large \(p\)-value can also come from low power — a small or noisy sample simply cannot detect a real difference in spread — so “Levene was not significant” is reassurance, not a guarantee. The same trap applies to any assumption test and even to the eye: a QQ plot that “looks fine” with \(n = 100\) is comforting, not a certificate. The honest report says the conditions are reasonable / not contradicted by the data, never verified true. Failing to reject is not the same as accepting — that is the single sentence to carry out of this section.
Low-stakes self-checks (ungraded)
These are for your own practice — ungraded, no submission.
- In one sentence each, state the three conditions a one-way ANOVA rests on, and say which one is checked by reasoning about the design rather than by a plot.
- Dataset F’s normal QQ plot is near-linear except for one low Online point near \(45\). What does the near-linear bulk tell you, and what does the single off-line point tell you — and is this a mild or a serious departure?
- Levene’s test on Dataset F gives \(p \approx 0.40\). Write one sentence interpreting it correctly, and one sentence naming what it does not prove.
- A classmate deletes the Online score near \(45\) because “it was ruining the QQ plot,” then reports a cleaner result. Name the rule they broke and one specific way their reported uncertainty is now misleading.
- Suppose a different analysis had Levene’s \(p \approx 0.01\) and a clear funnel in the residual-versus- fitted plot. List two principled fixes from this week’s menu and say what each one addresses.
- Explain, in your own words, why “the diagnostics passed” does not let you conclude that a format caused a higher score on Dataset F. Which step of the blueprint blocks that claim, and why?
Reading and source pointer
This week is grounded in the instructor notes (the primary course materials) for the diagnostic routine — the residual and QQ plots, Levene’s test, and the investigate-do-not-delete rule — with the IMS (Çetinkaya-Rundel & Hardin) treatment of checking conditions for inference and for comparing many means (ANOVA) for the concept sequence: which conditions a comparison rests on, how to check them, and how robust the conclusion is to mild departures. These notes are the course’s own synthesis, grounded in but not copied from the sources. No prose, examples, exercises, figures, or solutions are reproduced from any source.
Public vs. graded
These notes, the examples, and the practice here are public and ungraded — study material only. No graded prompts, answer keys, rubrics, point values, or due dates appear on this site. Graded applied-methods checkpoints, weekly quizzes, homework and analysis memos, applied analysis labs, the midterm, the applied methods project, and the final exam live in Blackboard (the LMS), which is authoritative for due dates, submissions, and grades. If this page and Blackboard ever disagree, follow Blackboard.
Looking ahead
Next week, with a significant ANOVA and its assumptions checked, we ask the natural follow-up question: which formats actually differ from which? A single \(F \approx 7.61\) says “not all four means are equal,” but it does not say where the gaps are — and chasing every pairwise comparison separately inflates the error rate. So next week is multiple comparisons and planned contrasts: Tukey HSD to control the family-wise error across all pairs, and a pre-specified contrast (hands-on formats versus delivered-only) that is more powerful than post-hoc fishing because you asked the question in advance. The diagnostics you ran this week are what license trusting those follow-up estimates. Note the calendar: the midterm is Friday Oct 9, in class, covering weeks 1–7.
See also
- Week 6 — Many-group comparisons & one-way ANOVA — the Dataset F fit (\(F \approx 7.61\), \(\eta^2 \approx 0.19\)) whose conditions this week checks.
- Week 8 — Multiple comparisons & planned contrasts — where, once the assumptions check out, you find which formats differ while controlling the error rate.
- Week 10 — Simple & multiple regression review — the same residual / QQ / influence diagnostic habit, now for a fitted regression line.
- Assumptions and diagnostics guide — the conditions, the plots, Levene’s test, and the investigate-do-not-delete rule in one reference.
- Methods glossary — residual, normality, homoscedasticity, Levene’s test, sensitivity check.