Week 3 — Estimation, uncertainty & practical significance
A point estimate, an interval, an effect size — and whether the difference matters
The week question
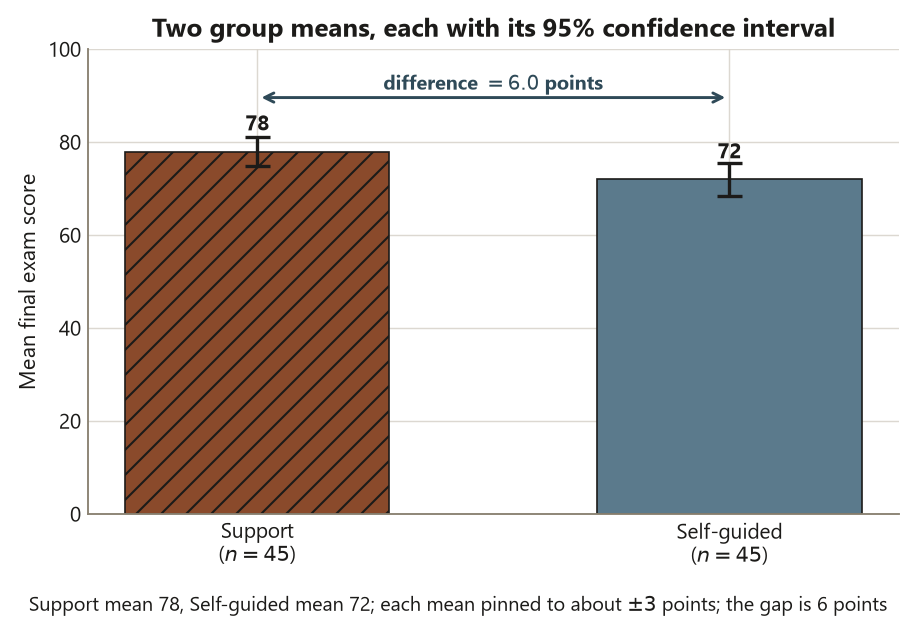
Last week you put the structure on the screen before fitting anything — side-by-side boxplots of final score by format, a scatter of study hours against final score — so you could see the comparison you were about to make. This week you take the next step in the analysis blueprint and ask what the comparison actually estimates, and how sure you are of that estimate. The Support students in Dataset G scored a final-exam mean of \(78\); the Self-guided students scored \(72\). The headline gap is \(6\) points. But a single number is not an answer. The week’s question is: once you have a point estimate of a difference, how do you report it honestly — with its uncertainty and its size — and how do you decide whether the difference is not just real but big enough to matter?
That question is step five of the blueprint in miniature: estimate and uncertainty. A method does not exist to hand you a verdict (“significant” / “not significant”); it exists to estimate a quantity you care about — here a mean difference — and to attach an honest measure of wobble to it. So this week you learn to report three things together, never one alone: a point estimate, a confidence interval, and an effect size, and then to read all three against the hard line between statistical and practical significance. The same trio reappears on every method for the rest of the term — a slope with its interval, an odds ratio with its interval, an adjusted mean with its interval — so the habit you build this week is the habit of the course.
Why this matters
Most of intro statistics ends at a p-value. You computed a test statistic, you compared it to a cutoff, you wrote “reject” or “fail to reject,” and you stopped. That is exactly where this course refuses to stop. A bare p-value answers a yes/no question — “is the difference distinguishable from zero?” — but it does not tell you how big the difference is, how precisely you have pinned it down, or whether anyone should care. Three studies can all report \(p < 0.05\) and mean wildly different things: a tiny, useless difference measured very precisely; a large, important difference measured roughly; and a moderate difference measured well. The p-value alone cannot tell them apart. The estimate, the interval, and the effect size can.
This matters because the whole job of applied statistics is to support a decision or a claim with calibrated evidence, and a verdict is not calibrated evidence. When you tell a program director “the support center is associated with a \(6\)-point higher final-exam mean, and we’re fairly confident the true gap is somewhere between about \(1\) and \(11\) points,” you have said something they can act on and argue with. When you say only “the difference was significant (\(p = 0.013\)),” you have hidden the size and the precision behind a single word. There is a second, quieter reason this week matters: it is where the course’s two recurring disciplines first bite hard. Report the estimate with its uncertainty, not just a verdict. And keep statistical significance, practical significance, and causation distinct — because Dataset G is observational (students chose the support center), a difference this clear still buys you association, not proof of cause.
A note on the calendar: Labor Day falls on Monday, September 7, so there is no Monday class this week. Week 3 runs Wednesday/Friday compressed — the same material, two meetings instead of three — so read this page closely before Wednesday and come ready to move quickly through the worked examples.
Learning goals
By the end of this week you should be able to:
- Distinguish a point estimate (a single best guess of a parameter, like \(\bar x_1 - \bar x_2\)) from the parameter it estimates (the unknown population mean difference \(\mu_1 - \mu_2\)), and explain why the estimate would wobble from sample to sample.
- Read a standard error as the typical size of that wobble — the standard deviation of the estimate across hypothetical repeated samples — and say how it differs from a data standard deviation.
- State the correct interpretation of a confidence interval (a procedure that captures the true parameter in a stated fraction of repeated samples) and name the two readings that are wrong (a probability statement about the fixed parameter; a range for individual values).
- Say what a p-value is and, just as carefully, what it is not, and explain why a confidence interval is more informative than a lone p-value.
- Compute and interpret an effect size (Cohen’s \(d\)), and separate statistical significance (distinguishable from zero) from practical significance (big enough to matter), while keeping association distinct from causation in an observational comparison.
Core vocabulary
- Parameter — the fixed, unknown number about the population you want to learn, here the true mean difference \(\mu_1 - \mu_2\) between Support and Self-guided final scores. It does not change; your knowledge of it does.
- Point estimate — the single best guess of that parameter computed from your sample, here \(\bar x_1 - \bar x_2 = 78 - 72 = 6\) points. A good estimate is a starting point, never the whole report.
- Sampling variability — the fact that a different random sample would have given a different estimate; the estimate is itself a random quantity with its own distribution (its sampling distribution).
- Standard error (SE) — the standard deviation of the estimate’s sampling distribution; the typical amount the point estimate would wobble from sample to sample. Smaller SE means a more precise estimate. Distinct from a data SD, which describes spread among observations.
- Confidence interval (CI) — an interval computed by a procedure that, in repeated sampling, captures the true parameter a stated fraction of the time (e.g. \(95\%\)). It reports both a plausible range and the estimate’s precision.
- p-value — the probability, if the null hypothesis were true, of getting a test statistic at least as extreme as the one observed. A statement about data-under-a-hypothesis, not about the hypothesis itself.
- Effect size — a scale-free measure of how big a difference is, here Cohen’s \(d\), the mean difference expressed in standard-deviation units. It answers “how large,” where the p-value answers only “distinguishable from zero?”
- Statistical vs. practical significance — statistical significance means the difference is distinguishable from zero (small p, interval excluding \(0\)); practical significance means it is large enough to matter for the decision at hand. The two are different questions and can disagree in either direction.
Concept development
Point estimate, parameter, and the standard error as the estimate’s wobble
Start with the cleanest distinction in inference: the difference between what you want to know and what you can compute. What you want to know is a parameter — for Dataset G, the true difference in mean final score between students who use the support center and students who go it alone, written \(\mu_{\text{Support}} - \mu_{\text{Self}}\). That number is fixed (the population has whatever mean difference it has) and unknown (you cannot measure every student). What you can compute is a point estimate of it: the difference in your two sample means,
\[ \hat\theta = \bar x_1 - \bar x_2 = 78 - 72 = 6 \text{ points.} \]
Six points is your single best guess at \(\mu_{\text{Support}} - \mu_{\text{Self}}\). But here is the crucial move: that \(6\) is itself the outcome of a random process. If a different \(45\) Support students and a different \(45\) Self-guided students had walked into your sample, you would have gotten a slightly different difference — maybe \(4.5\), maybe \(7.8\). The estimate wobbles from sample to sample, and the size of that wobble is the standard error.
The SE is not the spread of the data; it is the spread of the estimate. For a difference of two independent means it is built from each group’s variability and sample size,
\[ \mathrm{SE}(\bar x_1 - \bar x_2) = \sqrt{\frac{s_1^2}{n_1} + \frac{s_2^2}{n_2}} = \sqrt{\frac{10.5^2}{45} + \frac{12.0^2}{45}} \approx 2.38 \text{ points.} \]
So the locked numeric instance is \(\mathrm{SE} \approx 2.38\). Read it as: “if I repeated this whole study many times, my estimated difference would typically land about \(2.4\) points away from its average.” Notice two levers in the formula. Larger samples (\(n_1, n_2\)) shrink the SE — more data, less wobble, a more precise estimate. Larger data spread (\(s_1, s_2\)) inflates it — noisier students, a shakier estimate. The SE is the bridge from “here is my one number” to “here is how much I should trust it,” and every interval and test this week is just that bridge dressed differently. The blueprint move to name: the estimate is the \(6\)-point difference; its uncertainty is the SE of \(\approx 2.38\); neither is reported without the other.
The confidence interval (read it correctly) and the p-value (read it more carefully)
The standard error feeds directly into the report’s centerpiece — the confidence interval. A \(95\%\) CI for a mean difference is the estimate stretched out by a multiplier (roughly \(2\), from the \(t\) distribution) times the SE:
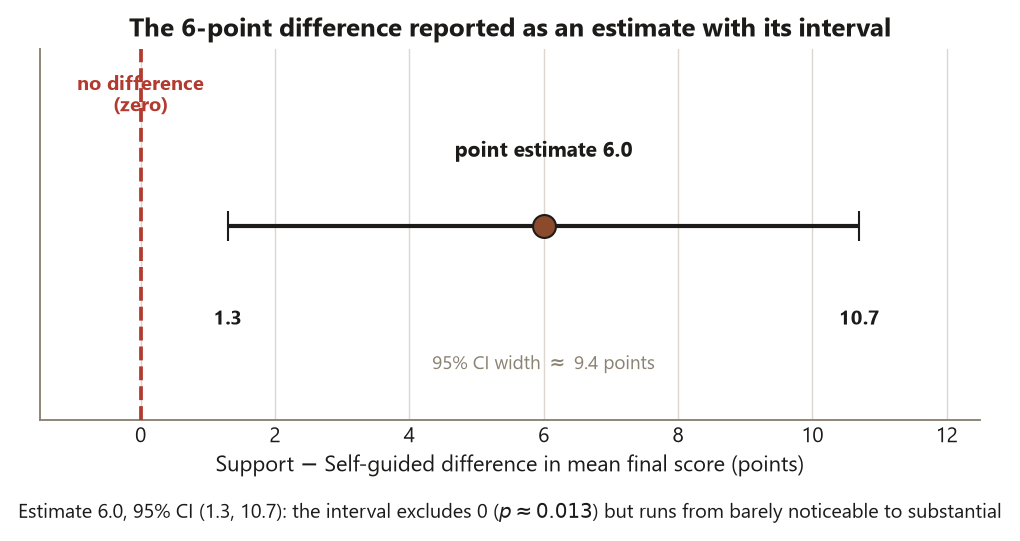
\[ (\bar x_1 - \bar x_2) \pm t^{\ast}\,\mathrm{SE} = 6 \pm 1.99\,(2.38) \approx 6 \pm 4.7 = (1.3,\ 10.7) \text{ points.} \]
There is the locked instance: the \(95\%\) CI for the Support–Self-guided difference is \((1.3, 10.7)\) points. Now interpret it the right way, because the wrong ways are seductive. The correct interpretation is about the procedure: “if I drew many samples and built a \(95\%\) CI from each, about \(95\%\) of those intervals would contain the true difference \(\mu_1 - \mu_2\).” For this one interval, the true difference is either inside \((1.3, 10.7)\) or it is not — it is a fixed number, not a random one. The two tempting misreadings are both wrong. It is not “there is a \(95\%\) probability the true difference is between \(1.3\) and \(10.7\)” — the parameter is fixed, so it has no probability of being anywhere; the randomness lives in the interval, not the parameter. And it is not a range for individual students — it is an interval for the mean difference, far narrower than the spread of any single student’s score.
What the interval buys you that a p-value cannot is direction, magnitude, and precision in one object. Because \((1.3, 10.7)\) excludes \(0\), the difference is statistically significant at the \(5\%\) level — that is the same information a test gives. But the interval says more: the plausible gap runs from a barely-noticeable \(1.3\) points up to a substantial \(10.7\) points, so while you are confident the true difference is positive, you are not very precise about its size. That candor is exactly what a lone p-value hides.
Now the p-value, stated carefully. For Dataset G the two-sample (Welch) test gives
\[ t = \frac{\bar x_1 - \bar x_2}{\mathrm{SE}} = \frac{6}{2.38} \approx 2.53, \qquad p \approx 0.013 . \]
The p-value of \(\approx 0.013\) is the probability, computed under the null hypothesis of no difference, of seeing a \(t\) at least as extreme as \(2.53\). That is all it is. It is not the probability the null is true; it is not the probability the result was a fluke; it is not a measure of how big or how important the difference is. A small p tells you the data are hard to reconcile with “no difference at all” — and nothing more. This is why the course leads with the interval: \((1.3, 10.7)\) contains every number the p-value implicitly tested, and shows you which differences are plausible and which are ruled out, all at once. The p-value collapses that picture to a single tail probability. Keep both if you like, but never report the p-value alone.
Effect size, and the line between statistical and practical significance
A confidence interval that excludes zero tells you the difference is real (distinguishable from chance). It does not, by itself, tell you the difference is large. For that you need a scale-free measure of magnitude — an effect size. For a two-group mean difference the standard one is Cohen’s \(d\), the difference in standard-deviation units:
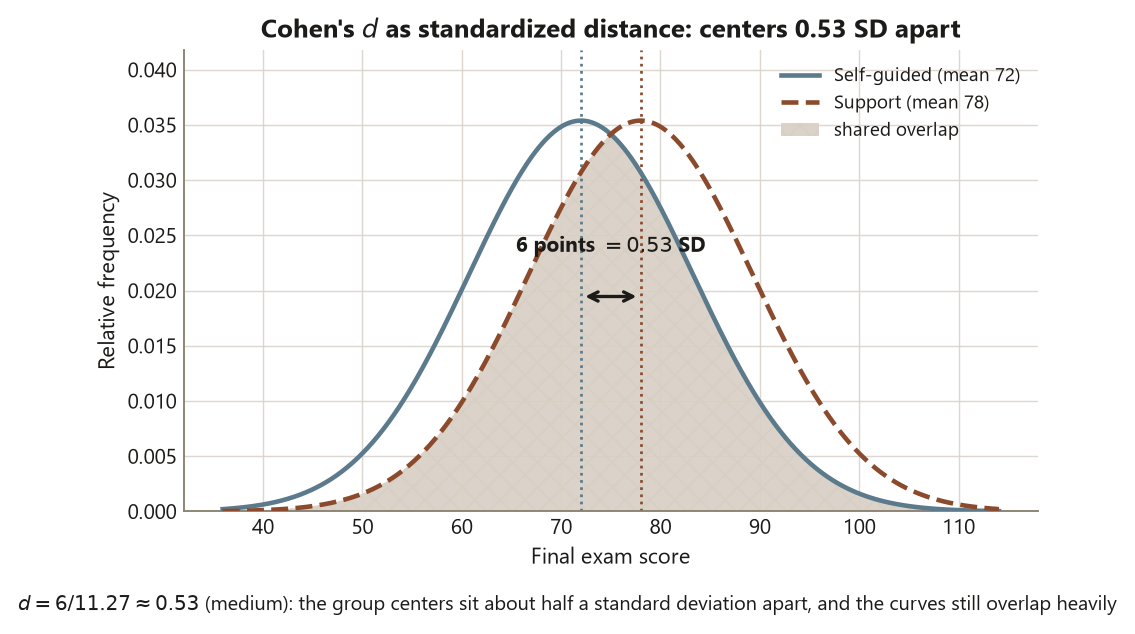
\[ d = \frac{\bar x_1 - \bar x_2}{s_p}, \qquad s_p = \sqrt{\frac{(n_1-1)s_1^2 + (n_2-1)s_2^2}{n_1+n_2-2}} \approx 11.27, \]
\[ d = \frac{6}{11.27} \approx 0.53 . \]
So the locked instance is \(d \approx 0.53\) — a medium effect by the conventional rough guideposts (\(\approx 0.2\) small, \(\approx 0.5\) medium, \(\approx 0.8\) large; treat these as rules of thumb, not laws). Read it in words: the Support group’s mean is about half a standard deviation above the Self-guided group’s mean. That phrasing travels across studies and scales in a way that “\(6\) points” does not — \(6\) points on a wildly variable exam is small, \(6\) points on a tightly clustered one is huge, and \(d\) normalizes for exactly that.
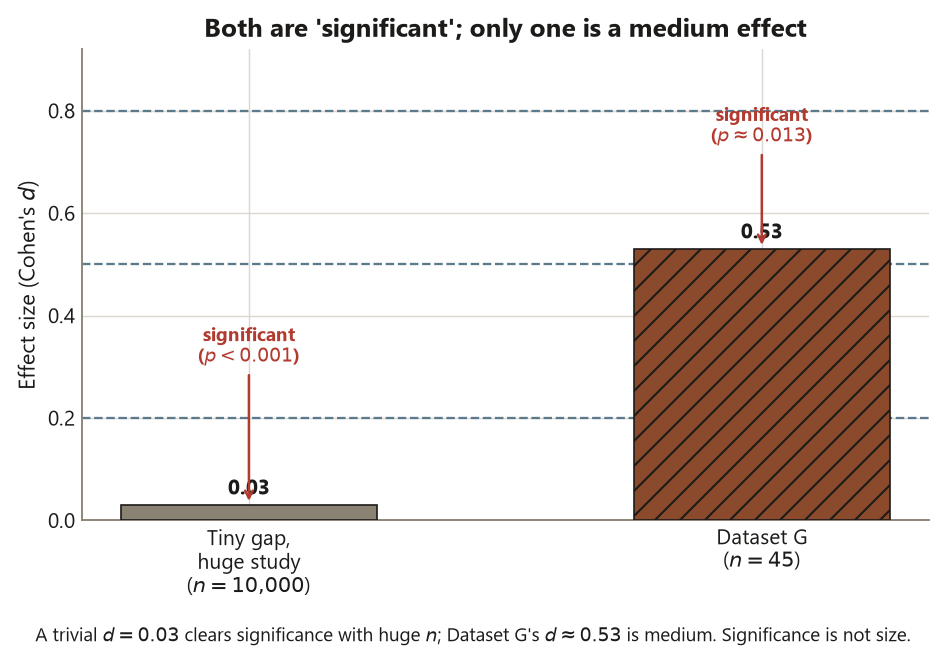
Now the distinction this whole week is built around. Statistical significance asks: is the difference distinguishable from zero? Here yes — \(p \approx 0.013\), and the CI \((1.3, 10.7)\) excludes zero. Practical significance asks a different question: is the difference big enough to matter for the decision in front of you? That is not a statistical question at all — it is a question about the context, answered by the effect size and domain judgment. With \(d \approx 0.53\) and a gap of half a letter-grade band, the Dataset G difference is plausibly practically meaningful as well as statistically significant. But the two can come apart in both directions, and that is the heart of the lesson. A trivially small difference can be statistically significant with a large enough sample (huge \(n\) shrinks the SE until any non-zero gap clears the bar), and a genuinely important difference can fail to reach significance in a small, noisy study. Never let “significant” stand in for “important.” Report \(d\) alongside the interval and the estimate, and judge importance on the scale of the problem.
One more discipline, carried from the blueprint’s step six: Dataset G is observational. Students self-selected into the support center, and the kind of student who seeks help is plausibly different (more motivated, better organized) from the kind who does not. So even a clear, sizeable, statistically significant \(6\)-point gap is an association, not a demonstration that the support center caused higher scores. The estimate, interval, and effect size are all about the size and certainty of the association; none of them upgrades it to causation. Naming that limit is part of the honest report.
Worked examples
Worked example — Dataset G: the 6-point difference, reported in full (recurring slice)
The question and structure. Do students who used the support center score differently on the final than those who studied on their own? The unit of analysis is the individual student. The response is the final exam score (quantitative, \(0\)–\(100\)); the grouping factor is support use (Support vs. Self-guided). The design is independent two groups (different students in each — not paired), and observational (students chose their group). Data are synthetic; seed set.
Assumptions and diagnostics. A two-sample comparison of means assumes roughly the conditions you’d check from last week’s EDA: each group’s scores are reasonably symmetric without wild outliers (or the samples — \(n = 45\) each — are large enough for the means to behave well), the two groups are independent, and we do not assume equal variances — we use the Welch version, the safe default, which lets the two SDs (\(10.5\) and \(12.0\)) differ. With \(n_1 = n_2 = 45\) the Welch and pooled results nearly coincide here, but Welch is the habit to keep.
The computation and the estimate with its uncertainty. The locked numbers:
\[ \bar x_1 - \bar x_2 = 78 - 72 = 6.0, \qquad \mathrm{SE} \approx 2.38, \qquad t \approx 2.53, \qquad p \approx 0.013, \] \[ \text{95\% CI } = (1.3,\ 10.7) \text{ points}, \qquad d \approx 0.53 . \]
The static R below shows the idiom for producing exactly this report. It is teaching code and is not executed here (R is not run on this site).
set.seed(35203)

# Dataset G: final exam scores (0-100), two independent observational groups.
# Synthetic; summarized to their locked means and SDs for this static slice:
#   Support:      mean = 78.0, SD = 10.5, n = 45
#   Self-guided:  mean = 72.0, SD = 12.0, n = 45

# Welch two-sample t-test (the safe default; unequal variances allowed):
t.test(final_score ~ group, data = G, var.equal = FALSE)

#   Welch Two Sample t-test
#   t = 2.53, df ~ 86, p-value ~ 0.013
#   95 percent confidence interval:  1.3  10.7
#   difference in means (Support - Self-guided) ~ 6.0 points

# Effect size (Cohen's d) in pooled-SD units:
#   s_p ~ 11.27;  d = 6.0 / 11.27 ~ 0.53   (medium)
The interpretation. Report all three pieces in one breath: students who used the support center scored, on average, \(6\) points higher on the final (\(95\%\) CI \(1.3\) to \(10.7\)), a difference of about half a standard deviation (\(d \approx 0.53\), medium) that is statistically significant (\(p \approx 0.013\); the interval excludes \(0\)). Because \(d\) is in the medium range and a \(6\)-point gap is a meaningful slice of an exam, the difference is plausibly practical, not just detectable. But the design is observational — students chose the support center — so this is an association, not causation: motivated students may both seek help and score higher for reasons the comparison cannot separate. The blueprint move: the estimate is \(6\) points, its uncertainty is the interval \((1.3, 10.7)\), its magnitude is \(d \approx 0.53\), and its conclusion is a sized, uncertain association — never a bare “significant.”
Worked example — estimating a single mean: study hours with a 95% CI (transfer, new context)
The question and structure. Move from a two-group difference to a one-group level, to show estimation is not only about comparisons. A study-skills coordinator wants to know the average number of hours per week that students in a first-year seminar spend studying. The unit is the student; the response is weekly study hours (quantitative); there is no grouping factor — this is a single-sample estimation. These numbers are illustrative and distinct from Dataset G; data are synthetic.
Assumptions and diagnostics. Estimating one mean with a \(t\)-interval assumes the observations are independent and the sampling distribution of the sample mean is approximately normal — reasonable for a moderate sample of mildly skewed study-hours data, and you’d confirm with a quick histogram (last week’s habit).
The computation and the estimate with its uncertainty. Suppose a sample of \(n = 36\) seminar students has a mean of \(\bar x = 9.0\) hours with SD \(s = 4.2\) hours. Then
\[ \mathrm{SE} = \frac{s}{\sqrt n} = \frac{4.2}{\sqrt{36}} = \frac{4.2}{6} = 0.70 \text{ hours}, \] \[ \text{95\% CI } = \bar x \pm t^{\ast}\,\mathrm{SE} \approx 9.0 \pm 2.03\,(0.70) \approx 9.0 \pm 1.4 = (7.6,\ 10.4) \text{ hours.} \]
set.seed(35203)

# One-sample estimation: weekly study hours for n = 36 seminar students.
# Synthetic, illustrative numbers (distinct from Dataset G):
#   mean = 9.0 hours, SD = 4.2 hours, n = 36

t.test(study_hours, mu = 0)$conf.int        # we want the interval, not the test of mu = 0

#   95 percent confidence interval:  7.6  10.4
#   sample estimate (mean of study_hours) ~ 9.0 hours
#   SE = 4.2 / sqrt(36) = 0.70 hours
The interpretation. The estimate is \(9.0\) hours per week, and the procedure gives a \(95\%\) CI of about \(7.6\) to \(10.4\) hours — a fairly tight interval, because the SE is small (\(0.70\), thanks to \(n = 36\) and modest spread). Read the interval correctly: it is not “\(95\%\) of students study between \(7.6\) and \(10.4\) hours” (that would be a range for individuals, and the SD of \(4.2\) tells you individual students vary far more widely); it is a statement about how precisely we have pinned down the average. Here there is no second group, so no difference, no Cohen’s \(d\), and no significance test is even the point — the estimate with its interval is the entire deliverable. That is the transfer lesson: estimation-with-uncertainty is the unit of an applied report whether you are estimating a difference, a single mean, a slope, or a proportion. Same machinery, new context.
A common mistake
This week’s classic applied-methods error is reporting a bare verdict and mistaking it for the whole story — and it comes in three intertwined flavors, each of which the estimate-with-uncertainty discipline is designed to prevent.
The first flavor is reporting a bare p-value with no estimate, interval, or effect size. A write-up that says only “the difference in final scores was significant (\(p = 0.013\))” has told the reader almost nothing useful: not how big the difference is (\(6\) points), not how precisely it is known (\(1.3\) to \(10.7\)), not whether it is large on the relevant scale (\(d \approx 0.53\)). The fix is mechanical and non-negotiable: always report the point estimate, its confidence interval, and an effect size, and let the p-value, if you include it at all, ride alongside rather than stand alone. A reader should be able to picture the result’s size and certainty, not just its existence.
The second flavor is equating “statistically significant” with “important.” Significance is a statement about distinguishability from zero, and with a large enough sample even a trivial difference clears that bar — a \(0.3\)-point gap on a \(100\)-point exam can be “significant” at \(n = 10{,}000\) and mean nothing. Practical importance is a separate judgment, made on the scale of the problem with the effect size and domain knowledge, not the p-value. The mirror error is just as bad: dismissing a genuinely large effect because a small, noisy study failed to reach significance. Keep the two questions — “distinguishable from zero?” and “big enough to matter?” — visibly separate in the report.
The third flavor is misreading the confidence interval. Two misreadings recur. One treats the interval as a probability statement about the parameter — “there’s a \(95\%\) chance the true difference is between \(1.3\) and \(10.7\).” But the true difference is fixed; it is the interval that is random across samples, so the \(95\%\) describes the procedure’s long-run capture rate, not a probability about this particular fixed number. The other misreading treats the interval as a range for individual values — “\(95\%\) of students differ by \(1.3\) to \(10.7\) points.” It is an interval for the mean difference, far narrower than the spread among individuals. And one last boundary error rides along with all of this in Dataset G: because the data are observational, no amount of significance, precision, or effect size converts the association into a causal claim. Name the size, name the uncertainty, name the limit.
Low-stakes self-checks (ungraded)
These are for your own practice — ungraded, no submission.
- In one sentence each, define parameter, point estimate, and standard error, and say which one the value \(\mathrm{SE} \approx 2.38\) in Dataset G is.
- The Dataset G \(95\%\) CI is \((1.3, 10.7)\) points. Write the correct one-sentence interpretation, then write the two incorrect interpretations the week warned against and say why each is wrong.
- A classmate reports only “the difference was significant, \(p = 0.013\).” List the three pieces of information their report is missing and give the value of each from Dataset G.
- Cohen’s \(d \approx 0.53\) for Dataset G. Explain in one sentence what “half a standard deviation” means here, and say why \(d\) can be more comparable across studies than “\(6\) points.”
- Could a difference be statistically significant but not practically significant? Could it be practically large but not statistically significant? Give one short scenario for each.
- For the study-hours example the \(95\%\) CI was \((7.6, 10.4)\) hours and the SD was \(4.2\) hours. Explain why the interval is not a claim that \(95\%\) of students study between \(7.6\) and \(10.4\) hours.
- Dataset G is observational. Write one sentence stating what the \(6\)-point difference does support and one sentence stating what it cannot support.
Reading and source pointer
This week is grounded in the instructor notes (the primary course materials) for estimation, uncertainty, and the statistical-vs-practical distinction, together with the IMS (Cetinkaya-Rundel & Hardin) treatment of the foundations for inference — confidence intervals and p-values — for the concept sequence: a point estimate, its standard error, an interval read as a procedure, and a p-value read for what it is and is not. These notes are the course’s own synthesis, grounded in but not copied from the sources. No prose, examples, exercises, figures, or solutions are reproduced from any source.
Public vs. graded
These notes, the examples, and the practice here are public and ungraded — study material only. No graded prompts, answer keys, rubrics, point values, or due dates appear on this site. Graded applied-methods checkpoints, weekly quizzes, homework and analysis memos, applied analysis labs, the midterm, the applied methods project, and the final exam live in Blackboard (the LMS), which is authoritative for due dates, submissions, and grades. If this page and Blackboard ever disagree, follow Blackboard.
Looking ahead
Next week we keep the very same estimate-and-interval logic — a point estimate, a standard error, a confidence interval, an effect size — but change the design it sits on. We move to one-sample and paired comparisons (Dataset P), where each student is measured twice (before and after the support module) so that each unit is its own control. Pairing removes the between-student variation that inflates the standard error in an independent comparison, so the paired interval can be much tighter for the same data — you’ll see the paired difference of \(+6\) points carry a \(95\%\) CI of \((2.6, 9.4)\) with a standard error of just \(\approx 1.64\), roughly half what two independent samples would give. The report trio — estimate, interval, effect size — stays exactly the same; only the structure underneath it changes. Remember the calendar: Labor Day is Monday, September 7, so this week ran W/F compressed — make sure you’ve worked both worked examples before next week builds on them.
See also
- Week 2 — Exploratory analysis and graphical comparison — seeing the structure before estimating anything; the boxplots and scatter this week’s estimates rest on.
- Week 4 — One-sample and paired comparisons — the same estimate-and-interval trio on a paired design, where each unit is its own control.
- Week 5 — Two-group comparisons — the full two-sample (Welch) machinery behind the Dataset G difference used here.
- Reporting and interpretation guide — effect sizes, confidence intervals, practical vs. statistical, association vs. causation.
- Methods glossary — point estimate, standard error, confidence interval, p-value, Cohen’s \(d\).