Week 2 — Exploratory analysis & graphical comparison
Seeing distributions, groups, and relationships before fitting anything
The week question
Last week you learned to read a dataset’s structure before doing anything with it — what the unit of analysis is, which variable is the response, which are explanatory or grouping or covariate, what type each outcome is, and what the design was. This week you put that structure on a page where you can see it. Before you fit a single model, before you compute a single \(p\)-value, you look: at the shape of one variable, at how that shape changes across groups, and at how two variables move together. The week’s question is: what do the data look like — their distributions, their group differences, and their relationships — and what does that picture tell you to do (and not do) next?
This is step 2 of the analysis blueprint made visible. You are not yet at “Method,” let alone “Estimate.” You are deciding what the structure actually is in this particular dataset: is the response roughly symmetric or skewed, are the groups centered differently or just spread differently, is there an unusual observation that one method would handle gracefully and another would let drive the whole story. A good exploratory pass answers those questions cheaply, with a graph and a numerical summary side by side, so that when you do reach for a method in Week 3 and beyond, you are choosing it with your eyes open.
Why this matters
Every method later in this course — the paired \(t\), the two-sample \(t\), one-way and two-way ANOVA, ANCOVA, regression, chi-square, logistic regression — assumes something about the data, and reports an estimate that means something only if those assumptions roughly hold. Exploratory analysis is where you earn the right to use a method. It is cheap insurance against the most expensive kind of error: confidently estimating the wrong thing.
Three concrete payoffs recur all term. First, shape tells you which summary is honest. A mean and a standard deviation describe a roughly symmetric distribution well; on a skewed one, the mean drifts toward the long tail and can misrepresent the typical case. You cannot know which you have without looking. Second, a graph across groups shows you whether the groups differ in center, in spread, or in neither — and those are different questions with different methods. Side-by-side boxplots answer all three at a glance, where a table of four means answers only one. Third, a scatter shows the form of a relationship, and form is exactly what a single correlation number hides. A correlation of \(0.55\) is consistent with a clean line, a gentle curve, or a cloud with one point doing all the work — and the picture distinguishes them where the number cannot.
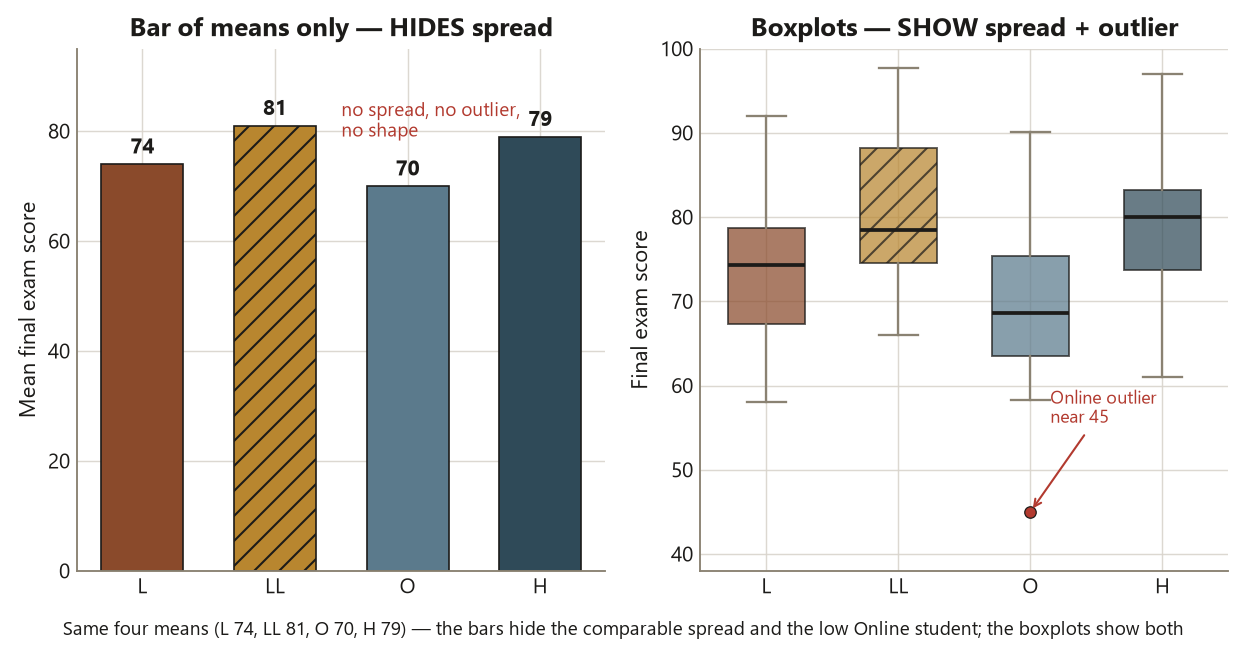
There is a discipline the course will repeat on every page, and it starts here. Pair every graph with a numerical summary; never report one alone. The graph shows shape, outliers, and form; the numbers pin down center and spread. A boxplot without group means is suggestive but imprecise; four means without a plot hide the Online outlier and the spread differences entirely. You always show both. And you keep the exploratory reading honest about what it can support: a scatter buys you an association, never a cause, and that distinction — which the rest of the course guards carefully — is one you start guarding now.
Learning goals
By the end of this week you should be able to:
- Describe a single distribution in four words — shape, center, spread, and unusual observations — and pair the graph with a numerical summary rather than reporting either alone.
- Read side-by-side boxplots across groups: compare centers, compare spreads, and spot an outlier, and say in plain words how the groups differ (in center, in spread, or in neither).
- Read a scatterplot of two quantitative variables in terms of direction, strength, and form, and locate an unusual point — especially a high-leverage point — that a single correlation would hide.
- Distinguish what a graph can tell you (shape, group differences, the form of a relationship, unusual observations) from what it cannot (a confirmed effect size, a verdict, or a causal claim).
- Name the blueprint move exploratory analysis serves — it sits at step 2 (Structure), informing which method at step 3 — and explain why looking before fitting protects every estimate that follows.
Core vocabulary
- Distribution — the pattern of values a single variable takes: where they cluster, how far they spread, what shape that cloud has, and whether any values sit far from the rest.
- Shape, center, spread — the three things you always describe for a distribution. Shape: symmetric, right- or left-skewed, unimodal or not. Center: a typical value (mean for symmetric, median for skewed). Spread: how variable the values are (standard deviation, IQR, range).
- Unusual observation (outlier) — a value far from the bulk of the data. You investigate it (data error? a real, rare case?); you do not delete it just because it is inconvenient.
- Side-by-side (grouped) boxplot — one boxplot per group on a shared axis, so you can compare centers, spreads, and outliers across groups at a glance. The box spans the IQR; the line is the median; whiskers reach to non-outlying extremes; points beyond are flagged outliers.
- Scatterplot — a plot of two quantitative variables, one per axis, each unit a point. Read for direction (positive/negative), strength (tight/loose), and form (linear/curved/none).
- Correlation \(r\) — a single number in \([-1, 1]\) summarizing the strength and direction of a linear relationship only. It says nothing about form, nothing about slope size, and nothing about cause.
- Leverage / high-leverage point — a point with an \(x\)-value far from the other \(x\)’s. It has unusual potential to pull a fitted line toward itself; it is not necessarily an error, but it deserves a look.
- Practical vs. statistical — exploratory analysis is pre-inferential: it describes the sample in hand. It does not yet make a claim about a population or a verdict; that is Week 3’s job.
Concept development
Distributions: shape, center, spread, and unusual observations
Start with one variable at a time. The first thing you do with any quantitative variable is describe its distribution along four axes, in this order: shape (is it symmetric, or does one tail run long?), center (what is a typical value?), spread (how variable are the values?), and unusual observations (does anything sit far from the rest?). A histogram or a boxplot shows shape and outliers; a numerical summary — summary() in R gives you the five-number summary plus the mean — pins down center and spread. You report both, because each covers the other’s blind spot.
Shape drives the choice of center. If a distribution is roughly symmetric, the mean and median nearly agree, and the mean is a fine summary. If it is skewed — a long tail in one direction — the mean is pulled toward the tail and the median stays put near the bulk, so the median is the more honest “typical value.” This matters immediately for Dataset F. The Online group’s final scores are centered near \(70\), but one student scored near \(45\). That single low value drags the Online mean down a little while leaving the Online median almost untouched. If you reported only the mean, you would slightly overstate how far behind Online sits; the graph plus the median tells the truer story. The rule the course will repeat — pair the graph with the numerical summary, never one alone — exists exactly to catch this kind of mismatch.
The discipline to fix now: an outlier is something you investigate, not delete. Near \(45\) on a \(0\)–\(100\) scale, with the rest of the Online group near \(70\), that student is a real data point until you have a reason to think otherwise. Maybe it is a data-entry slip; maybe it is a genuine struggling student the analysis should account for. You note it, you check it, and — absent a documented error — you keep it and choose methods that are honest about it. Deleting an inconvenient point to make a result cleaner is one of the classic applied-methods errors, and we name it every time it could happen.
Graphical comparison across groups: side-by-side boxplots
Now look at the same response across groups. Dataset F is the final exam score under four instructional formats — Lecture (L), Lecture+Lab (LL), Online (O), and Hybrid (H) — with \(n = 25\) per format, \(N = 100\). The structure is one quantitative response and one four-level grouping factor; the exploratory question is how do the four format distributions compare? The right picture is side-by-side boxplots: four boxplots sharing one score axis, so centers, spreads, and outliers line up for direct comparison.
The locked group means are \(L = 74\), \(LL = 81\), \(O = 70\), \(H = 79\) — grand mean \(76\) — with a common within-group SD of about \(9\). Read the boxplots in three passes. Center first: the medians order roughly \(O\) (lowest, near \(70\)) \(<\) \(L\) (near \(74\)) \(<\) \(H\) (near \(79\)) \(<\) \(LL\) (highest, near \(81\)). The hands-on formats (LL, H) sit visibly above the delivered-only formats (L, O), an \(\approx 8\)-point gap that will become a planned contrast in Week 8. Spread next: the boxes are of similar height — the within- group SD is about the same (\(\approx 9\)) across formats, with Online slightly more spread out. Comparable spread is good news for the methods ahead; it is the equal-variance picture a one-way ANOVA likes. Unusual observations last: the Online group shows one low point near \(45\), flagged below its lower whisker. That is the outlier from the distributions section, now visible in context.
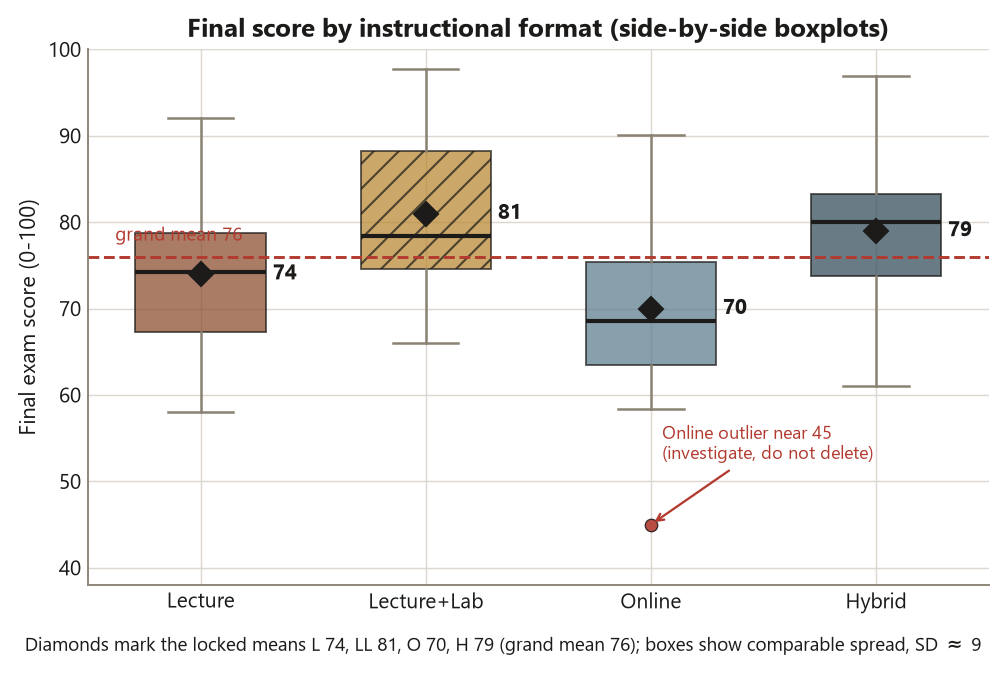
Notice what the boxplots gave you that the four means alone did not: the spread comparison and the Online outlier. Four numbers — \(74\), \(81\), \(70\), \(79\) — are a center summary and nothing more. The plot is what tells you the groups are comparably variable and that one Online student is unusual. That is the whole case for pairing the picture with the numbers: each carries information the other drops.
Relationships: a scatter of two quantitative variables
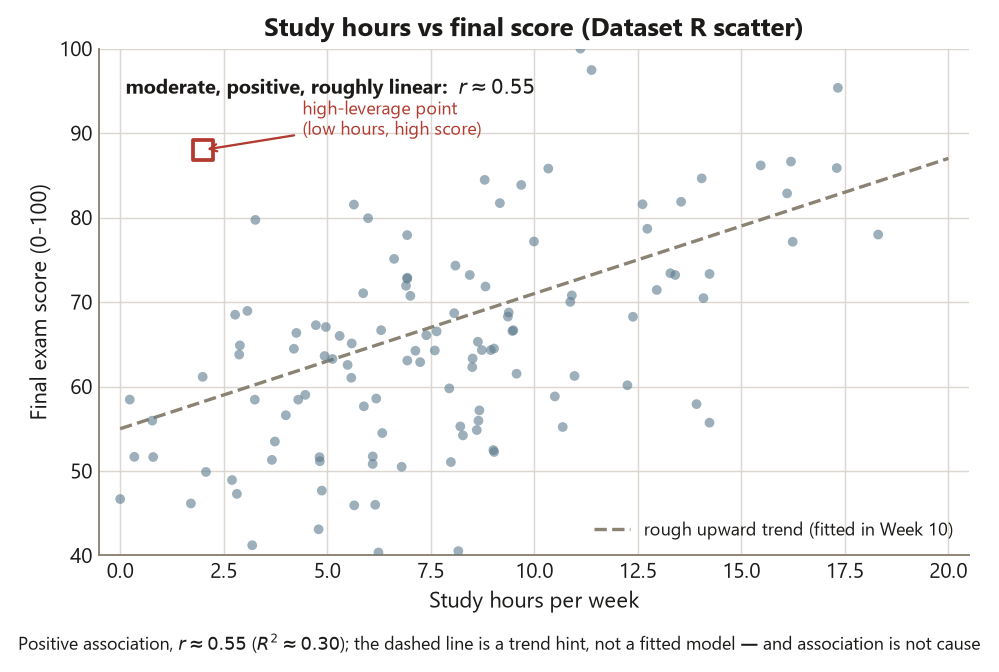
The third exploratory move is to look at two quantitative variables together. Dataset R follows \(120\) students; here we take two columns, study hours per week and final score, and ask how are they related? The structure is two quantitative variables, one explanatory ($x = $ hours) and one response ($y = $ final). The right picture is a scatterplot, each student a point.
You read a scatter along three axes. Direction: as hours rise, does the score tend to rise (positive) or fall (negative)? For Dataset R the cloud slopes upward — more study hours go with higher scores, a positive association. Strength: how tightly do the points hug the trend? Here it is moderate — a real upward drift with plenty of scatter around it — summarized by the correlation \(r \approx 0.55\). Form: is the trend a straight line, a curve, or no clear shape? Here it is roughly linear, which is what licenses summarizing it with a single correlation and (in Week 10) a straight-line fit.
But the scatter shows one thing the correlation hides: a high-leverage point — a student with unusually low hours but a high score, sitting off to the left of the cloud and well above where the trend would put them. Because its \(x\)-value is far from the others, this point has outsized potential to tug a fitted line; you flag it now, investigate it, and — as always — do not delete it on sight. Two cautions close the beat. First, \(r\) describes linear strength only; a strong curve can post a modest \(r\), and only the picture reveals form. Second, and the discipline the course guards hardest: correlation is not causation. Dataset R is observational — students chose how much to study — so the upward association is real but cannot, by itself, establish that studying more causes higher scores. Motivated students may both study more and score higher for reasons the scatter never sees. The picture buys you an association and a reason to look further; it does not buy you a cause.
Worked examples
Worked example — Dataset F boxplots and Dataset R scatter (recurring slice)
The question and structure. Two exploratory questions on the Cypress Ridge world. (a) How do final scores compare across the four instructional formats? — one quantitative response (final score), one four-level grouping factor (Format), \(n = 25\) each, \(N = 100\); the picture is side-by-side boxplots. (b) How are study hours and final score related? — two quantitative variables, $x = $ hours, $y = $ final, \(n = 120\); the picture is a scatterplot. Data are synthetic; seed set (set.seed(35203)). No model is fit here — this is step 2, Structure, made visible.
The computation. The static R below shows the idioms. It is teaching code and is not executed here; key numbers are shown as comments.
set.seed(35203)

# --- (a) Dataset F: final score by instructional Format (n = 25 each, N = 100) ---
# Synthetic. Locked group means: L = 74, LL = 81, O = 70, H = 79; within-group SD ~ 9.
# One mild Online outlier near 45 (investigate, do not delete).

boxplot(final ~ format, data = datasetF,
        ylab = "Final score (0-100)", xlab = "Instructional format")

tapply(datasetF$final, datasetF$format, summary)
# Group means (locked):  L = 74   LL = 81   O = 70   H = 79   (grand mean 76)
# Within-group SD ~ 9 for all four; Online slightly more spread.
# Online shows one low point near 45, flagged below the lower whisker.

# --- (b) Dataset R: study hours vs final score (n = 120) ---
# Synthetic. Positive, roughly linear; correlation r ~ 0.55.
# One high-leverage point: LOW hours, HIGH score.

plot(final ~ hours, data = datasetR,
     ylab = "Final score (0-100)", xlab = "Study hours per week")

cor(datasetR$hours, datasetR$final)
# r ~ 0.55   (moderate, positive, roughly linear)
# One high-leverage student sits at low hours but a high score (off to the left).
The estimate, its uncertainty, and what we can conclude. This is exploratory, so the “estimates” here are descriptive, not inferential — and that distinction is the point. (a) The four format means \(74 / 81 / 70 / 79\) are sample descriptions with comparable spread (\(\text{SD} \approx 9\)); the boxplots show the hands-on formats (LL, H) centered above the delivered-only formats (L, O), plus one low Online student near \(45\). We do not yet attach a confidence interval or call any gap “significant” — that is Week 3’s and Week 6’s job. (b) The correlation \(r \approx 0.55\) describes a moderate, positive, roughly linear association between hours and final score, with one high-leverage low-hours/high-score point to investigate. What we can conclude: the structure supports a group-comparison method for Format and a straight-line summary for the hours–score relationship, with the outlier and the leverage point watched. What we cannot conclude: that format causes the score differences, or that studying more causes higher scores — Dataset R is observational, so the association is real but not causal. The picture sets up the method; it does not deliver the verdict.
Worked example — monthly rainfall by region (transfer, new context)
The question and structure. A regional climate office compares monthly rainfall (mm) across four districts over the past several years, and separately asks whether a district’s average elevation (m) relates to its rainfall. These numbers are illustrative and clearly distinct from the Cypress Ridge datasets. Two structures, two pictures: rainfall-by-district is one quantitative response across a four-level grouping factor — side-by-side boxplots; elevation-vs-rainfall is two quantitative variables — a scatterplot. State which plot answers which question before touching a model.
The computation. Suppose the four district median rainfalls run roughly \(40\), \(55\), \(48\), and \(90\) mm, with the fourth district both wetter and far more variable, and one flood month near \(200\) mm flagged as an outlier. Suppose elevation and rainfall show a positive, roughly linear cloud with \(r \approx 0.6\) and one unusually high-elevation station off to the right.
# Transfer context: rainfall by district, and elevation vs rainfall.
# Illustrative numbers, distinct from the Cypress Ridge datasets.

boxplot(rainfall ~ district, data = climate,
        ylab = "Monthly rainfall (mm)", xlab = "District")
# District medians ~ 40, 55, 48, 90 mm; the wettest district is also the most spread.
# One flood month near 200 mm flags as an outlier -> investigate (real event? error?).

plot(rainfall ~ elevation, data = climate,
     ylab = "Monthly rainfall (mm)", xlab = "Average elevation (m)")
cor(climate$elevation, climate$rainfall)
# r ~ 0.6  (positive, roughly linear); one high-elevation station has high leverage.
The estimate, its uncertainty, and what we can conclude. The exploratory reading mirrors Dataset F and R exactly, only the context and numbers changed. The boxplots answer “how do districts differ?” — here the fourth district is centered higher and spread wider, and a flood month sits out as an outlier to investigate, not delete. The scatter answers “how does elevation relate to rainfall?” — a positive, roughly linear association (\(r \approx 0.6\)) with one high-leverage high-elevation station. As before, the correlation describes linear strength only, the picture is what reveals form and the leverage point, and the relationship is observational: higher-elevation districts getting more rain is an association that suggests orographic effects but does not, from this plot, prove them. Same exploratory logic, new domain — pick the plot for the question, pair it with numbers, watch the unusual points, and resist the causal leap.
A common mistake
This week’s classic applied-methods error is fitting or testing before looking — jumping straight to a \(t\)-test, an ANOVA, or a correlation coefficient without ever drawing the distribution, the boxplots, or the scatter. It hides three specific failures that the exploratory pass is designed to catch.
The first is letting a skew-inflated mean drive the story. If you report only the four Dataset F means and never plot them, you miss that the Online mean is pulled down a touch by the one student near \(45\) — and you might overstate how far Online trails. The fix is the discipline the week is built on: pair the graph with a numerical summary, and on a skewed distribution lead with the median. The plot would have shown you the outlier and the comparable spreads in seconds.
The second is letting one outlier or one high-leverage point silently run the analysis — and then, worse, deleting it to make the result cleaner. The Online student near \(45\) and the low-hours/high-score student in Dataset R are exactly the points that can tilt a mean or tug a fitted line. The error is either to ignore them (so they distort the estimate invisibly) or to drop them on sight (so you have quietly fabricated a tidier dataset). The fix is the same both ways: investigate, do not delete. Find out whether the point is an error or a real rare case, report it, and choose methods honest about it.
The third is reading a scatter’s correlation as a causal effect. Seeing \(r \approx 0.55\) between study hours and final score and concluding “studying raises scores” skips the entire question of how the data arose. Dataset R is observational — students self-selected their study hours — so the association is real but confounded by everything that travels with studying (motivation, prior preparation, attendance). The fix is to keep three things distinct, every time: a correlation (what you see), a causal effect (what you would need an experiment or careful adjustment to claim), and the form of the relationship (what the number alone never shows). Look first; describe honestly; claim only what the design supports.
Low-stakes self-checks (ungraded)
These are for your own practice — ungraded, no submission.
- In one sentence each, name the four things you describe for a single distribution, and say which center you would lead with for a right-skewed variable and why.
- The Dataset F means are \(L = 74\), \(LL = 81\), \(O = 70\), \(H = 79\). Name one thing the side-by-side boxplots show that these four numbers alone do not.
- A classmate sees the Online final-score boxplot, spots the point near \(45\), and deletes it “to clean up the data.” State what is wrong with that move and what they should do instead.
- For the Dataset R scatter, write one sentence describing the relationship in terms of direction, strength, and form, and one sentence locating the high-leverage point.
- Someone reports “\(r \approx 0.55\), so studying more causes higher scores.” Give the one-word property of the design that makes this an overreach, and rewrite the claim as an honest association.
- You are handed a four-group comparison and a two-variable relationship. Say which plot you would draw for each question, and what you would look for in each before fitting any model.
Reading and source pointer
This week is grounded in the instructor notes (the primary course materials) for the exploratory-analysis workflow and the look-before-you-fit discipline, with the IMS (Cetinkaya-Rundel & Hardin) treatment of exploratory data analysis for the concept sequence — describing distributions, comparing groups, and reading relationships — and ModernDive (Ismay, Kim & Valdivia) on data visualization with ggplot2 for the graphical-comparison workflow (boxplots and scatterplots as the tools that make structure visible). These notes are the course’s own synthesis, grounded in but not copied from the sources. No prose, examples, exercises, figures, or solutions are reproduced from any source.
Public vs. graded
These notes, the examples, and the practice here are public and ungraded — study material only. No graded prompts, answer keys, rubrics, point values, or due dates appear on this site. Graded applied-methods checkpoints, weekly quizzes, homework and analysis memos, applied analysis labs, the midterm, the applied methods project, and the final exam live in Blackboard (the LMS), which is authoritative for due dates, submissions, and grades. If this page and Blackboard ever disagree, follow Blackboard.
Looking ahead
Next week we turn a comparison into numbers. Having seen that the Support and Self-guided groups differ, we ask how big the difference is and how sure we are: a point estimate (the \(6\)-point gap in Dataset G), a 95% confidence interval \((1.3, 10.7)\), an effect size (\(d \approx 0.53\)), and the distinction the rest of the course leans on — statistical significance versus practical significance. The graph showed you there is something to estimate; Week 3 estimates it, with its uncertainty attached. Note the calendar: Labor Day falls on Mon Sep 7, so Week 3 runs W/F compressed — plan the two meetings accordingly.
See also
- Week 1 — Statistical questions and data structure — the structure vocabulary (response, grouping factor, design) this week makes visible.
- Week 3 — Estimation, uncertainty & practical significance — turning a seen comparison into a point estimate with a confidence interval.
- Week 6 — Many-group comparisons & one-way ANOVA — the formal test behind this week’s Dataset F boxplots.
- Reporting and interpretation guide — pairing graphs with numbers, effect sizes, and association versus causation.
- Methods glossary — distribution, boxplot, scatterplot, correlation, leverage.