Week 5 — Two-group comparisons
Comparing two independent groups: difference, uncertainty, effect size, and what it cannot say
The week question
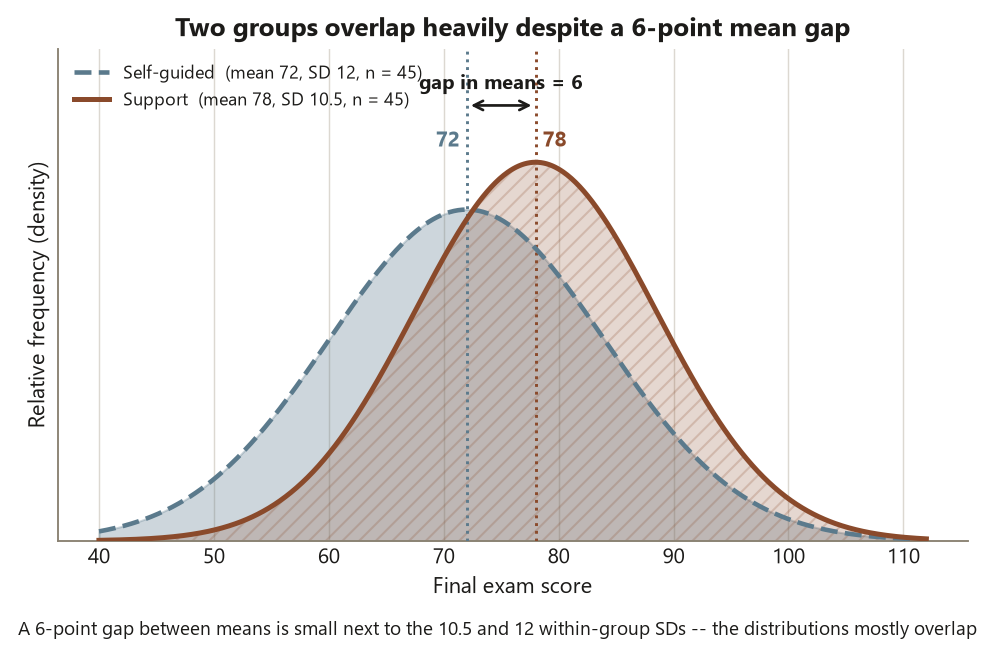
Last week the two columns of numbers belonged to the same students — a before and an after, measured on one person, so each student carried their own baseline and you compared the pairs. This week the two columns belong to different students, and that one change in the data’s structure changes the whole analysis. You have final exam scores for two groups in the Cypress Ridge course: students who used the support center (Support, \(n_1 = 45\)) and students who did not (Self-guided, \(n_2 = 45\)). The Support group averaged \(78\); the Self-guided group averaged \(72\). The week’s question is the natural one: is a \(6\)-point gap between two independent groups more than the scatter you would expect from two samples of \(45\) — and, even if it is, what is that gap allowed to mean?
The answer has to do two jobs at once, and the course will hold you to both on every page. The first job is estimation with uncertainty: report the difference as a number with a confidence interval and an effect size, not as a lone p-value or a bare “significant.” The second job is interpretation that stays honest about its limits: keep statistical significance, practical significance, and causation as three separate questions, because these students chose whether to use the support center, and a choice the students made themselves is exactly the kind of thing that buys you association, not causation.
Why this matters
Two-group comparison is the workhorse of applied statistics. “Does this group differ from that group?” is the shape of an enormous fraction of real questions — a new treatment versus the standard, one campus versus another, an intervention group versus a comparison group. If you can run, read, and bound a two-group comparison honestly, you can carry that discipline into nearly every method that follows: the many-group ANOVA of next week is the same idea with more than two groups, and regression is the same idea with a slope instead of a gap. So this is a hinge week. Get the blueprint clean here and the rest of the course inherits it.
It matters for a second reason that is easy to miss. The two-group comparison is where the difference between a method and a verdict becomes vivid. The lazy version of this analysis runs a test, reads a p-value, and announces “the support center works.” Every clause of that sentence can be wrong. The test may be the wrong one for the data’s variance structure; the p-value alone hides whether the effect is big enough to care about; and “works” is a causal word that an observational comparison has no right to use. The careful version reports the gap, attaches an interval and an effect size to it, checks what the test assumed, and then says — out loud — that because students self-selected, this is an association between support-center use and higher scores, not evidence that the center caused them. The machinery is a two-line R command. The judgment is the lesson.
Learning goals
By the end of this week you should be able to:
- Recognize a two-independent-group structure (different units in each group) and distinguish it from a paired structure (the same unit measured twice), and say why that distinction picks the method.
- State what the two-sample comparison estimates — the difference in means \(\bar x_1 - \bar x_2\) — and report it with a standard error, a confidence interval, and an effect size (Cohen’s \(d\)), never as a bare p-value.
- Explain the difference between the pooled two-sample \(t\) and the Welch \(t\), name the equal-variance assumption the pooled version rests on, and justify Welch as the safe default.
- Check the two-sample assumptions (independence within and between groups, roughly normal group distributions or large enough \(n\), and — for the pooled version only — equal variances) and say how each is checked.
- Separate the three conclusions a two-group comparison must keep distinct: statistical significance (is the gap more than noise?), practical significance (is the gap big enough to matter?), and causation versus association (did the grouping cause the gap, or merely travel with it?) — and explain why self-selection in Dataset G forces the association reading.
Core vocabulary
- Two independent groups — two sets of different units (here, different students), so a value in one group is unrelated to any particular value in the other. Contrast with paired data, where each value in one column is tied to a specific value in the other.
- Difference in means — the estimate, \(\bar x_1 - \bar x_2\). For Dataset G it is \(78 - 72 = 6.0\) points: the Support mean minus the Self-guided mean.
- Pooled standard deviation \(s_p\) — a single SD estimate formed by combining both groups’ variability, used by the pooled two-sample \(t\); it assumes the two groups share one common variance.
- Pooled two-sample \(t\) — the test that uses \(s_p\) and assumes equal variances across groups; efficient when that assumption holds, mildly wrong when it does not.
- Welch two-sample \(t\) — the test that does not assume equal variances; it uses each group’s own SD and a fractional degrees-of-freedom adjustment. It is the default in R’s
t.test()and the safe choice unless you have a strong reason to assume equal variances. - Standard error of the difference — the SD of the sampling distribution of \(\bar x_1 - \bar x_2\); for Dataset G it is \(\approx 2.38\) points. The interval and the \(t\) statistic are both built from it.
- Confidence interval for the difference — a range of plausible values for the true mean difference; for Dataset G the 95% CI is \((1.3, 10.7)\) points. The estimate with its uncertainty.
- Cohen’s \(d\) — a standardized effect size, the difference in means divided by a pooled SD, \(d = (\bar x_1 - \bar x_2)/s_p\); it reports the gap in SD units so you can judge its size apart from the sample’s \(n\). For Dataset G, \(d \approx 0.53\) (a medium effect).
- Self-selection — units choosing their own group (here, students choosing whether to use the support center). It is the reason this comparison is observational and can support association, not causation.
Concept development
The independent two-group design — and why it is not last week’s paired design
Start where the blueprint always starts: with the structure, because the structure picks the method. Last week’s Dataset P had \(30\) students measured twice — a pretest and a posttest on the same person — so the natural unit of analysis was the student, and the natural quantity was each student’s own change. That pairing was a gift: by subtracting each student from themselves, you removed all the between-student variation (some students are simply stronger than others) and were left with a cleaner signal. The analysis was a one-sample test on the \(30\) within-student differences.
Dataset G is built differently, and the difference is the whole point. Here there are \(90\) different students — \(45\) who used the support center and \(45\) who did not. No student appears in both columns. There is no student-by-student pairing to exploit, because the Support student in “row 1” has nothing to do with the Self-guided student in “row 1”; the rows are not linked. So you cannot subtract person from person. Instead you compare the two groups’ means and ask whether they differ by more than the scatter two independent samples of \(45\) would naturally show. The unit of analysis is still the student, the response is still the final score \(Y\) (quantitative), but the design is independent, not paired, and that single fact routes you to a two-sample comparison rather than a paired one.
Read the structure off the data, not off habit. The diagnostic question is simple: is there a meaningful one-to-one link between a value in group 1 and a specific value in group 2? For a pretest/posttest on the same person, yes — pair them. For two different sets of students, no — treat them as independent. Picking the wrong one is this week’s classic mistake, and we return to it below.
The estimate this design produces is the difference in group means,
\[ \hat\Delta = \bar x_1 - \bar x_2 = 78.0 - 72.0 = 6.0 \text{ points,} \]
the Support group scoring \(6\) points higher on average. That number is the point estimate. By itself it is only half an answer; the blueprint’s step 5 demands its uncertainty too, which is what the next two subsections build.
Pooled versus Welch — and why Welch is the safe default
To put uncertainty on the \(6\)-point gap you need the standard error of the difference, and here a real choice appears. The two groups have different observed SDs: Support has SD \(= 10.5\), Self-guided has SD \(= 12.0\). The Self-guided group is more spread out. How you fold those two SDs into one standard error is exactly what separates the two versions of the two-sample \(t\).
The pooled two-sample \(t\) assumes the two groups share a single common variance and estimates it by combining both groups’ variability into one pooled SD,
\[ s_p = \sqrt{\frac{(n_1 - 1)s_1^2 + (n_2 - 1)s_2^2}{n_1 + n_2 - 2}} = \sqrt{\frac{44(10.5^2) + 44(12.0^2)}{88}} \approx 11.27 \text{ points.} \]
It then builds the standard error from that single \(s_p\):
\[ \mathrm{SE}_{\text{pooled}} = s_p\sqrt{\frac{1}{n_1} + \frac{1}{n_2}} = 11.27\sqrt{\tfrac{1}{45} + \tfrac{1}{45}} \approx 2.38 \text{ points.} \]
This is efficient when the equal-variance assumption is true. When it is false — when one group really is more variable than the other — the pooled SD blends a small variance with a large one and can misstate the uncertainty, especially if the group sizes are also unequal.
The Welch two-sample \(t\) refuses that assumption. It keeps each group’s own SD and builds the standard error from the two separately,
\[ \mathrm{SE}_{\text{Welch}} = \sqrt{\frac{s_1^2}{n_1} + \frac{s_2^2}{n_2}} = \sqrt{\frac{10.5^2}{45} + \frac{12.0^2}{45}} \approx 2.38 \text{ points,} \]
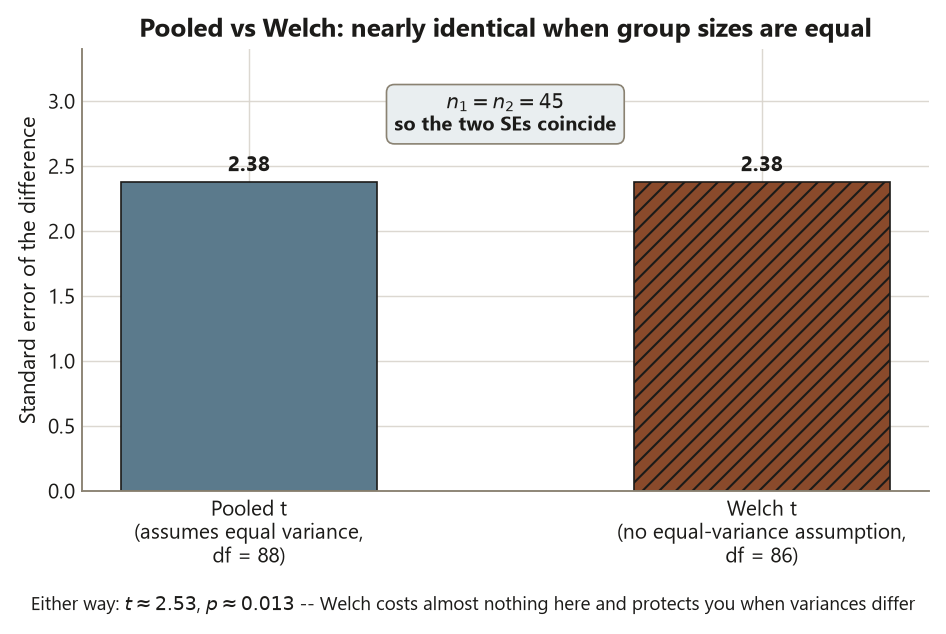
and pays for that freedom with a fractional degrees-of-freedom adjustment (here df \(\approx 86\) rather than the pooled \(88\)). Notice what happened for Dataset G: because the group sizes are equal (\(n_1 = n_2 = 45\)), the pooled and Welch standard errors come out essentially the same, \(\approx 2.38\), and the two tests agree almost exactly. That is not luck — with equal \(n\), the two formulas nearly coincide. The lesson is not that the choice never matters; it is that Welch costs you almost nothing when variances are equal and protects you when they are not, so it is the safe default. R’s t.test() runs Welch unless you explicitly ask for the pooled version with var.equal = TRUE. The honest move is to let Welch run, and only switch to pooled if you have a real reason — design, prior knowledge, or a variance check — to defend equal variances.
The estimate with its interval and effect size — and the observational caveat
Now assemble the full step-5 report. The \(t\) statistic compares the estimate to its standard error,
\[ t = \frac{\bar x_1 - \bar x_2}{\mathrm{SE}} = \frac{6.0}{2.38} \approx 2.53 \quad \text{on df} \approx 86, \qquad p \approx 0.013 . \]
A p-value of \(0.013\) says: if the two groups truly had the same mean, a gap this large (in either direction) would arise about \(1.3\%\) of the time from sampling scatter alone. That is uncommon enough to call the \(6\)-point gap statistically significant at the usual \(5\%\) level. But — and this is the discipline of the course — do not stop at the p-value. Report the estimate with its uncertainty:
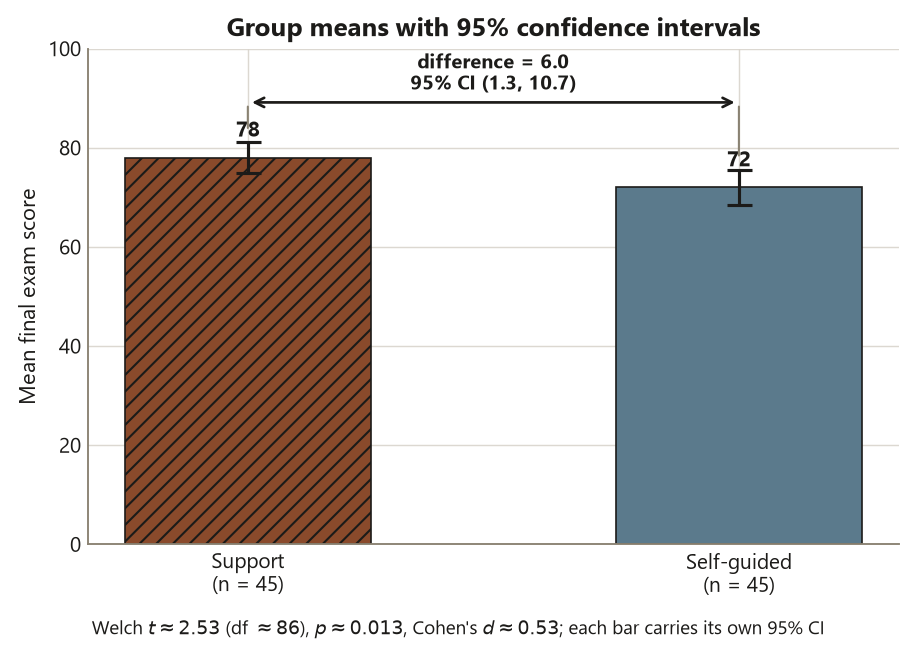
\[ \bar x_1 - \bar x_2 \pm t^{\ast}_{86,\,.975}\cdot \mathrm{SE} = 6.0 \pm 1.99(2.38) \approx 6.0 \pm 4.7 = (1.3,\ 10.7) \text{ points.} \]
The 95% confidence interval \((1.3, 10.7)\) is the heart of the report. It says the true mean difference is plausibly anywhere from about \(1\) point to almost \(11\) points — comfortably above zero (consistent with the significant test), but wide enough that you cannot pin the size precisely. Then add the effect size, which expresses the gap in standard-deviation units and is therefore independent of how big the sample happened to be:
\[ d = \frac{\bar x_1 - \bar x_2}{s_p} = \frac{6.0}{11.27} \approx 0.53 . \]
A Cohen’s \(d\) of about \(0.53\) is conventionally a medium effect: the two group means sit about half a standard deviation apart. That is a substantively noticeable gap on a \(100\)-point exam — this clears the bar for practical significance too, not just statistical.
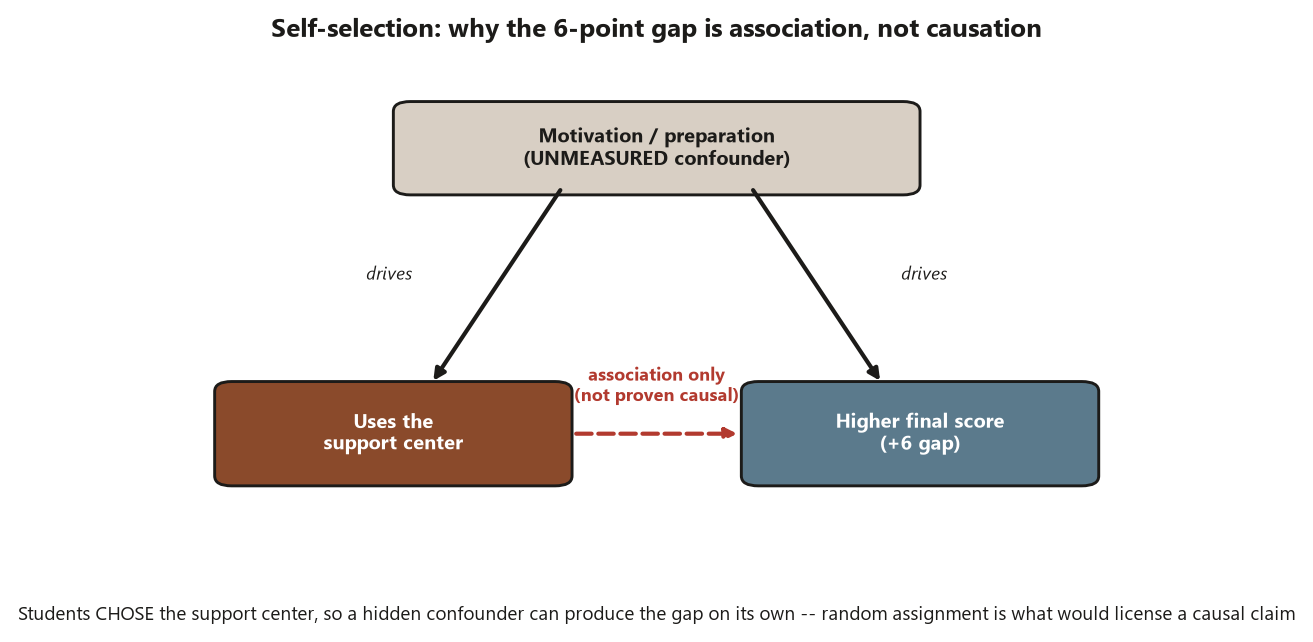
And now the caveat that the design forces on you, no matter how clean the numbers look. The students in Dataset G chose whether to use the support center; nobody randomly assigned them. So the two groups may differ in many ways besides support-center use — motivation, prior preparation, time available, confidence. Any of those could be the real driver of the \(6\)-point gap, with support-center use just riding along. This is the textbook setup for confounding by self-selection. The correct conclusion is therefore an association: support-center use is associated with a roughly \(6\)-point higher mean score (95% CI \(1.3\) to \(10.7\), \(d \approx 0.53\)). It is not “the support center raises scores by \(6\) points,” because that is a causal claim, and an observational comparison cannot underwrite it. Hold the three readings apart: the gap is statistically significant (\(p \approx 0.013\)), practically meaningful (\(d \approx 0.53\)), and causally ambiguous (selection).
Worked examples
Worked example — Dataset G: Support vs. Self-guided final scores (recurring slice)
The question and structure. Comparing — do students who used the support center score differently on the final than those who did not? The unit of analysis is the student; the response \(Y\) is the final exam score (quantitative); the explanatory variable is the grouping factor Support vs. Self-guided (two levels). The design is independent (different students in each group) and observational (students self-selected). Data are synthetic; seed set with set.seed(35203).
The assumptions and how you check them. Independence within each group (different students, so a score does not depend on its neighbor) and between groups (no student is in both); roughly normal group distributions, or — as here, with \(n = 45\) per group — samples large enough that the difference in means is approximately normal by the central limit theorem; and, only if you choose the pooled test, equal variances. Here the observed SDs (\(10.5\) and \(12.0\)) are close but not identical, so you let Welch run rather than assume equal variances.
The computation. The estimate is \(\bar x_1 - \bar x_2 = 78 - 72 = 6.0\) points; the pooled SD is \(s_p \approx 11.27\); the Welch standard error is \(\approx 2.38\); the Welch \(t \approx 6.0/2.38 \approx 2.53\) on df \(\approx 86\), giving \(p \approx 0.013\). The static R below shows the idiom — Welch by default, plus a Cohen’s \(d\). It is teaching code and is not executed here.
set.seed(35203)

# Dataset G: final exam scores (0-100) for two independent groups.
#   Support      n1 = 45, mean 78.0, SD 10.5
#   Self-guided  n2 = 45, mean 72.0, SD 12.0
# Synthetic; observational (students self-selected). Long form: score, group.

# Welch two-sample t-test is the DEFAULT (var.equal = FALSE).
t.test(score ~ group, data = dataset_G)
# Welch Two Sample t-test
#   t = 2.53,  df = 86,  p-value = 0.013
#   95 percent confidence interval:  1.3  10.7
#   mean in group Support  mean in group Self-guided
#                   78.0                       72.0
# -> estimate (difference) = 6.0 points; SE ~ 2.38

# Standardized effect size: Cohen's d (pooled SD ~ 11.27).
library(effsize)
cohen.d(score ~ group, data = dataset_G)
# Cohen's d
#   d estimate: 0.53 (medium)
# -> the two group means sit ~0.5 SD apart
The estimate with its uncertainty, and the interpretation. The point estimate is a \(6.0\)-point higher mean for the Support group, with 95% CI \((1.3, 10.7)\) points and a medium standardized effect \(d \approx 0.53\). The test is statistically significant (\(p \approx 0.013\)): a gap this large is unlikely under “no difference.” And the effect is practically meaningful — about half a standard deviation on a \(100\)-point exam. But the conclusion stops at association. Because students chose their group, motivated or better-prepared students may have both used the support center and scored higher for reasons of their own. So report it as: support-center use is associated with a roughly \(6\)-point higher final-exam mean (95% CI \(1.3\)–\(10.7\), \(d \approx 0.53\), \(p \approx 0.013\)); the observational design cannot establish that the support center caused the gap. Three readings, kept distinct: significant, meaningful, and causally ambiguous.
Worked example — a randomized two-app study (transfer, new context)
The question and structure. A learning-design team wants to know whether two study apps lead to different quiz performance. They take \(60\) volunteers and randomly assign \(30\) to App A and \(30\) to App B, then record each student’s end-of-unit quiz score (0–100). The unit is the student; the response is the quiz score; the grouping factor is App A vs. App B; the design is independent and — crucially — experimental (random assignment), not observational. These numbers are illustrative and distinct from Dataset G; data are synthetic.
The assumptions and computation. Same two-sample machinery: independence within and between groups, approximate normality of the group means (here \(n = 30\) each), and Welch by default rather than assuming equal variances. Suppose App A has mean \(74\) (SD \(9\)) and App B has mean \(68\) (SD \(10\)), a difference of \(6\) points — deliberately the same \(6\)-point gap as Dataset G, to make the contrast sharp.
set.seed(35203)

# Two-app study: quiz scores (0-100), RANDOMLY ASSIGNED to App A or App B.
#   App A  n = 30, mean 74, SD 9
#   App B  n = 30, mean 68, SD 10
# Synthetic; experimental (random assignment), independent groups.

t.test(quiz ~ app, data = study_apps)        # Welch by default
# Welch Two Sample t-test
#   t ~ 2.45,  df ~ 57,  p-value ~ 0.017
#   95 percent confidence interval:  ~1.1  ~10.9
#   mean App A 74    mean App B 68   -> difference 6 points

library(effsize)
cohen.d(quiz ~ app, data = study_apps)
# Cohen's d ~ 0.63 (medium)
The estimate with its uncertainty, and the interpretation. The estimate is again a \(6\)-point higher mean (App A over App B), with a confidence interval comfortably above zero and a medium \(d\). The arithmetic is the same two-sample \(t\) you ran for Dataset G. But the conclusion you are licensed to draw is stronger, and the reason is the design, not the test. Because students were randomly assigned to App A or App B, the two groups are — apart from the app — alike on average in motivation, preparation, and everything else, known or unknown. Random assignment balances the confounders that self-selection let loose in Dataset G. So here you may say App A caused the roughly \(6\)-point advantage (within the bounds of the interval), not merely that it is associated with it.
Put the two examples side by side and the whole point of the week lands: the same \(6\)-point gap, the same Welch \(t\), the same kind of confidence interval and effect size — but one supports only an association and the other supports causation. What changed is not the statistic. It is whether the grouping was chosen by the students (Dataset G, observational) or assigned at random by the researchers (the two-app study, experimental). The test never tells you which world you are in; only the design does. Read the design before you read the p-value.
A common mistake
This week’s classic applied-methods error has three closely related faces, and all three come from skipping the blueprint’s structure step.
The first is using a two-sample test on paired data — running the independent two-sample \(t\) when the two columns are actually the same units measured twice. If you took last week’s pretest/posttest data and fed it to t.test(score ~ time) as if “pre” and “post” were two independent groups, you would throw away the pairing that removed all the between-student variation, inflate the standard error, and weaken a test that should have been more powerful. The fix is the diagnostic question from the concept section: is each value in group 1 tied to a specific value in group 2? If yes (same person, before and after), it is paired — use the paired analysis. If no (different people in each group, as in Dataset G), it is independent — use the two-sample analysis. The mirror error is just as bad: treating genuinely independent groups as if they were paired when there is no one-to-one link to pair on.
The second face is forcing the pooled (equal-variance) test when Welch is safer. Reaching for var.equal = TRUE out of habit, or because a textbook formula used \(s_p\), assumes the two groups share a common variance — an assumption that can quietly distort the standard error when one group is more spread than the other, especially with unequal group sizes. For Dataset G the equal-\(n\) design makes the two versions agree, so the error is invisible here — but that is exactly why it is a dangerous habit to carry into the unequal-\(n\) comparisons you will meet later. Let Welch run unless you can defend equal variances.
The third, and the costliest, is calling the observational difference causal — reading the \(6\)-point Dataset G gap as “the support center raises scores by \(6\) points.” It does not. Students self-selected into the support center, so the groups differ in more than support-center use, and the gap is an association. The discipline is verbal as much as statistical: write “is associated with,” not “causes” or “raises” or “improves,” whenever the grouping was chosen rather than randomly assigned. Causal verbs are earned by random assignment (the two-app study), not by a small p-value.
Low-stakes self-checks (ungraded)
These are for your own practice — ungraded, no submission. Graded work lives in Blackboard (the LMS).
- In one sentence, explain why Dataset G is analyzed with a two-sample \(t\) and not a paired \(t\), using the words independent and paired.
- The pooled SD for Dataset G is \(s_p \approx 11.27\) and the Welch and pooled standard errors are both \(\approx 2.38\). Explain in one sentence why the two standard errors come out nearly identical here, and name the design feature responsible.
- Write the full estimate-with-uncertainty report for Dataset G in one sentence: the difference, the 95% CI, the effect size, and the p-value — with no causal verb in it.
- The Cohen’s \(d\) is about \(0.53\). Say in one sentence what “half a standard deviation” means for a \(100\)-point exam, and whether you would call the effect practically meaningful.
- A classmate writes: “The support center raised final scores by \(6\) points (\(p = 0.013\)).” Name the two things wrong with that sentence (one about reporting, one about causation) and rewrite it honestly.
- Suppose the two-app study found the same \(6\)-point gap but had randomly assigned students. Explain in one or two sentences why that study may use a causal verb when Dataset G may not, and name the single design feature that makes the difference.
Reading and source pointer
This week is grounded in the instructor notes (the primary course materials) for the two-group comparison and the estimate-with-uncertainty discipline, with the IMS (Çetinkaya-Rundel & Hardin) treatment of inference for comparing two means for the concept sequence — the difference in means, its standard error, the confidence interval, and the pooled-versus-Welch distinction. The R workflow — t.test(score ~ group) run as Welch by default, reading the difference, interval, and effect size off the output — follows the ModernDive (Ismay, Kim & Valdivia) treatment of comparing two groups in R. The applied framing of the comparison draws on ISLBS (Vu & Harrington), a two-group comparison in an applied setting, which the companion lab develops further. These notes are the course’s own synthesis, grounded in but not copied from the sources. No prose, examples, exercises, figures, or solutions are reproduced from any source.
Public vs. graded
These notes, the examples, and the practice here are public and ungraded — study material only. No graded prompts, answer keys, rubrics, point values, or due dates appear on this site. Graded applied-methods checkpoints, weekly quizzes, homework and analysis memos, applied analysis labs, the midterm, the applied methods project, and the final exam live in Blackboard (the LMS), which is authoritative for due dates, submissions, and grades. If this page and Blackboard ever disagree, follow Blackboard.
Looking ahead
Next week we keep the same blueprint but raise the number of groups: instead of two, we compare many groups at once with one-way ANOVA, using Dataset F’s four instructional formats. The reason we do not simply run a two-sample \(t\) on every pair will become the heart of the week — running many pairwise tests inflates the family-wise error rate, so a chance “significant” gap becomes almost guaranteed across enough comparisons. ANOVA asks the single honest question first (“do any of the group means differ?”) before any pair is examined, and it is the natural next step on the same question → structure → method → estimate → conclusion path you walked this week.
See also
- Week 4 — One-sample and paired comparisons — the paired design this week is contrasted against; same students measured twice.
- Week 6 — Many-group comparisons and one-way ANOVA — the same comparison logic extended to more than two groups, with error-rate control.
- Lab 5 — Two-group comparison and effect size — the companion hands-on lab: run the Welch \(t\) and Cohen’s \(d\) on Dataset G in R.
- Method chooser — the question → structure → method decision guide; paired vs. independent, pooled vs. Welch.
- Reporting and interpretation guide — effect sizes, confidence intervals, and statistical vs. practical vs. causal conclusions.